Core-Cast is our model and publication series for nowcasting the Fed's Personal Consumption Expenditures (PCE) inflation gauges. We update our estimates from CPI, PPI, Import Price, and GDP data, along with previews and final recaps. If you'd like to become a MacroSuite subscriber to get all of our model updates before PCE is released, you can do so usingthis link. If you have any questions or would like to see samples of our past content, contact us here.
Summary: PCE Nowcasts
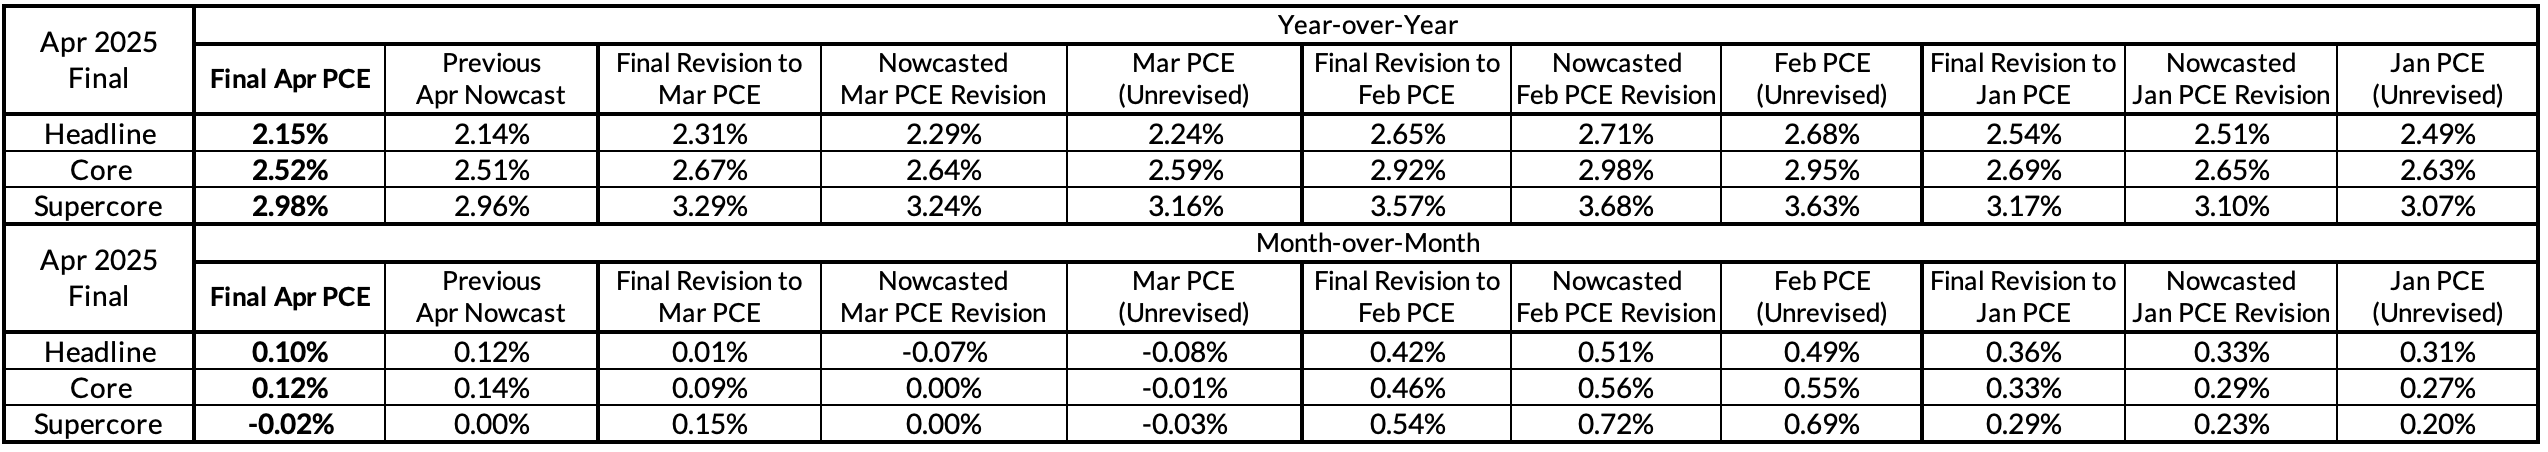
Our final nowcasts broadly fared well yet again despite a very messy set of revisions to Q1 PCE inflation. Our year-over-year Core PCE nowcast was too cool by 1 basis point and our month-over-month Core PCE nowcast was too hot by 2 basis points.
We were expecting softer CPI and PCE inflation in April and were largely validated. While CPI poses more upside risk in May as a result of trade policy uncertainties, PCE inflation is likely to be weighed down by the effects of a falling stock market in April on financial service prices.
We don't think the Fed is likely to be moved substantially by this soft inflation print because most of the Fed's fears about inflation risk relate to future inflation readings and only recent policy shifts. Financial service prices are also likely to jump back up in June as a result of the equity market recovery post-April. While we still do not know the scale and duration of inflationary pressures stemming from tariff shocks, June, July, and August CPI releases are most likely to be the real proof points. Until the Fed sees those proof points, they are likely to remain on hold.
What today's data makes clear is that inflation was coming into 2025 poised to decline further. In the absence of upside inflation risks, the Fed would be highly justified in reducing interest rates further, and the benefits of achieving a soft landing would be more obvious.
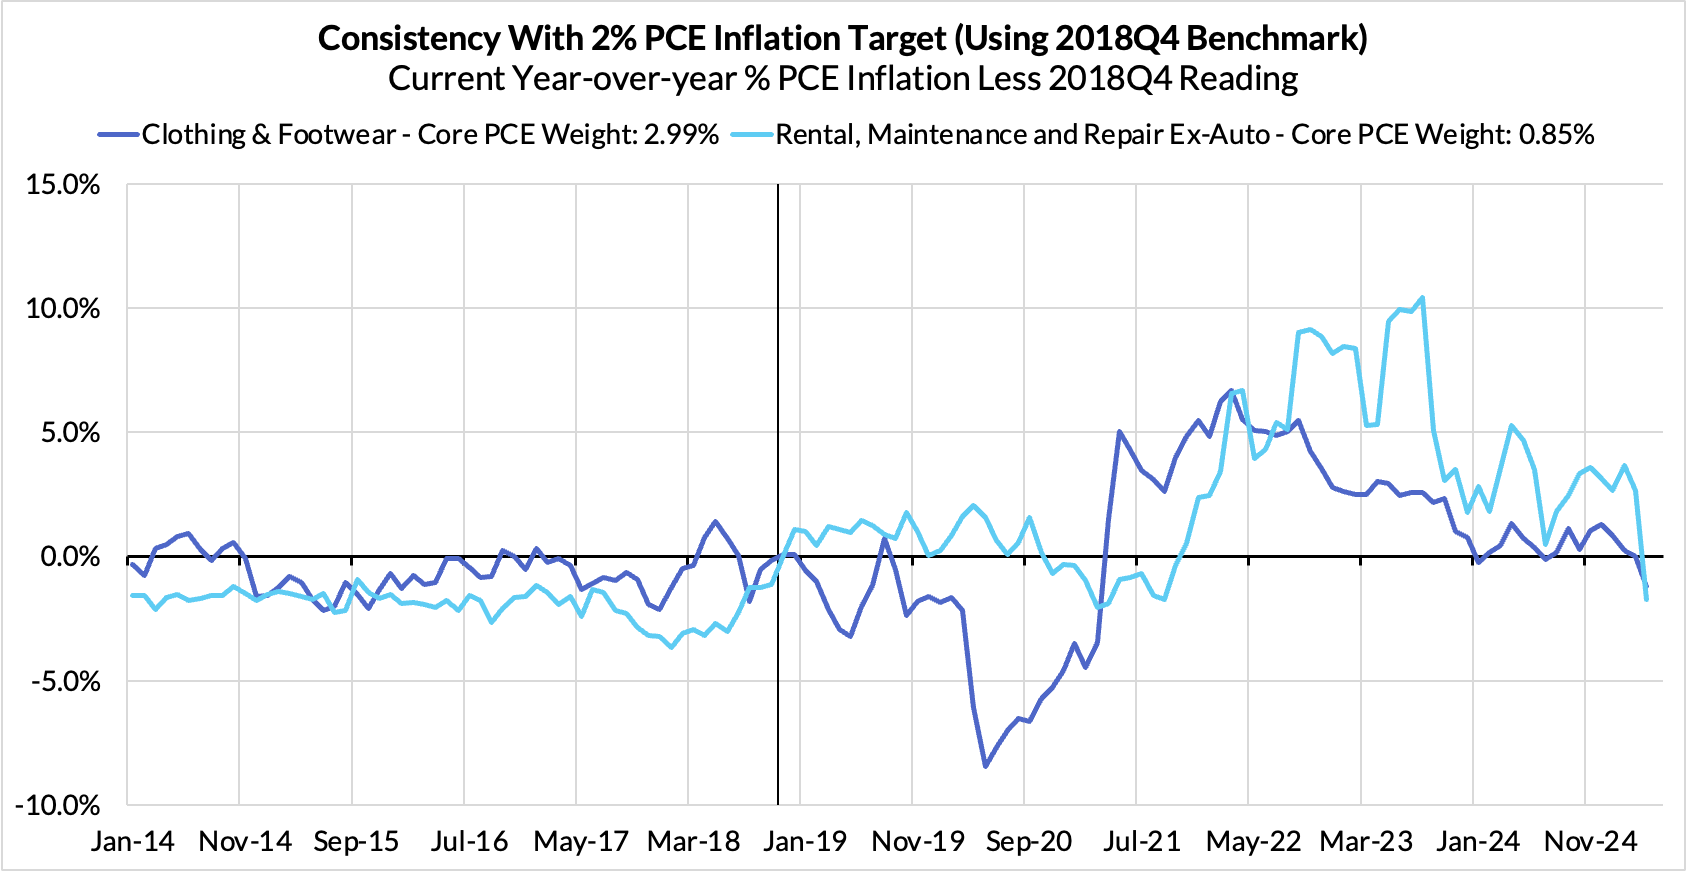
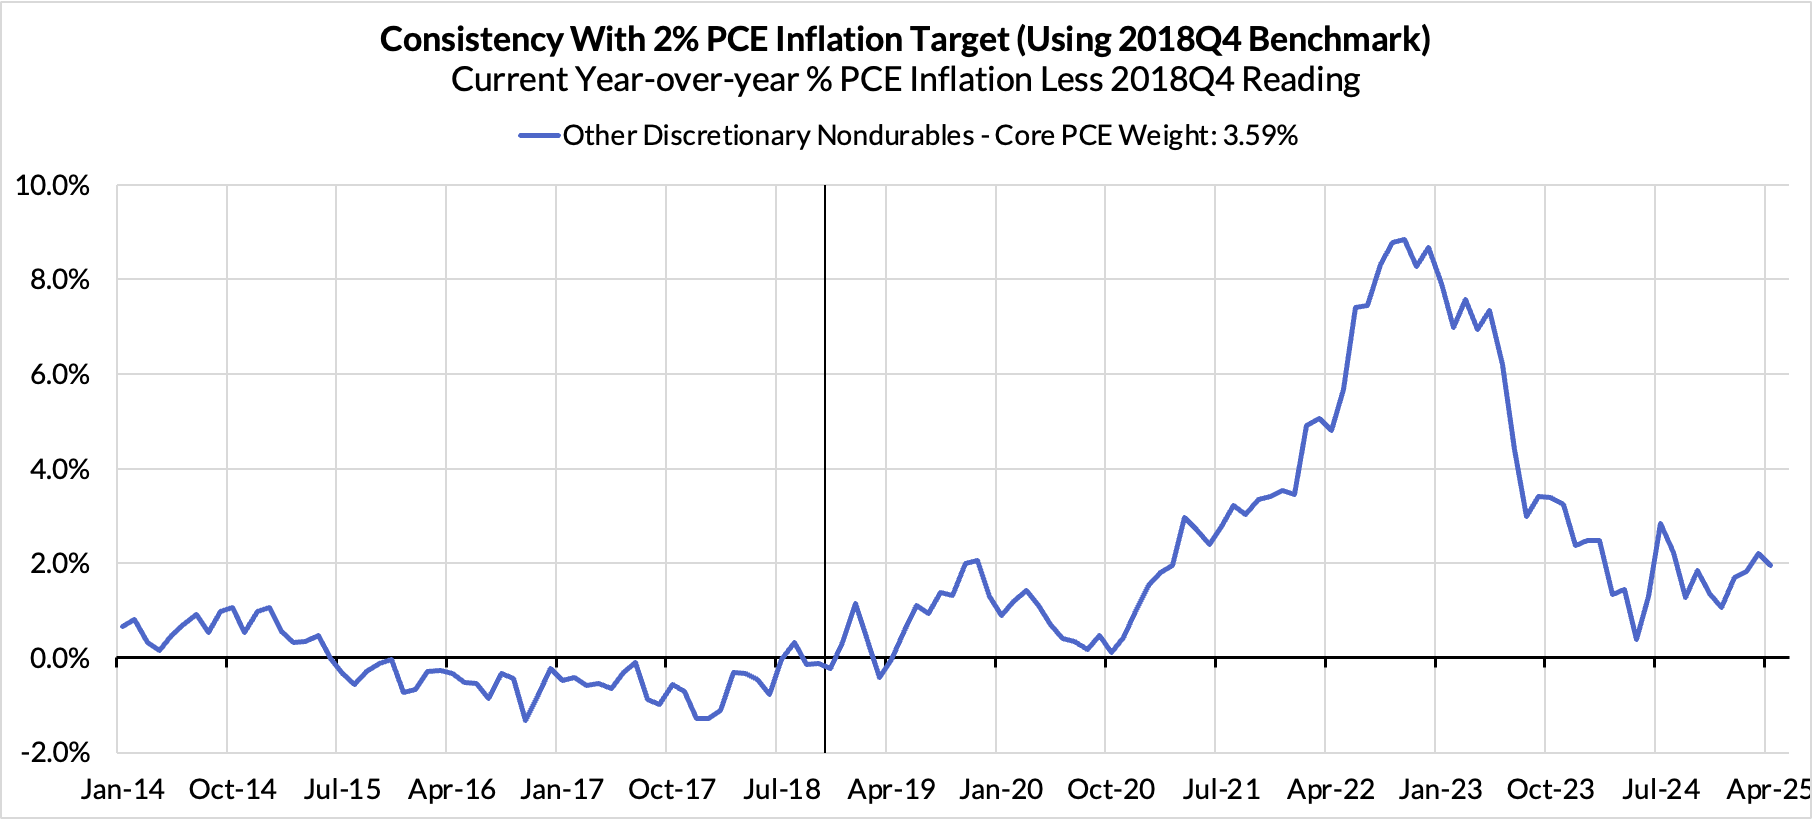
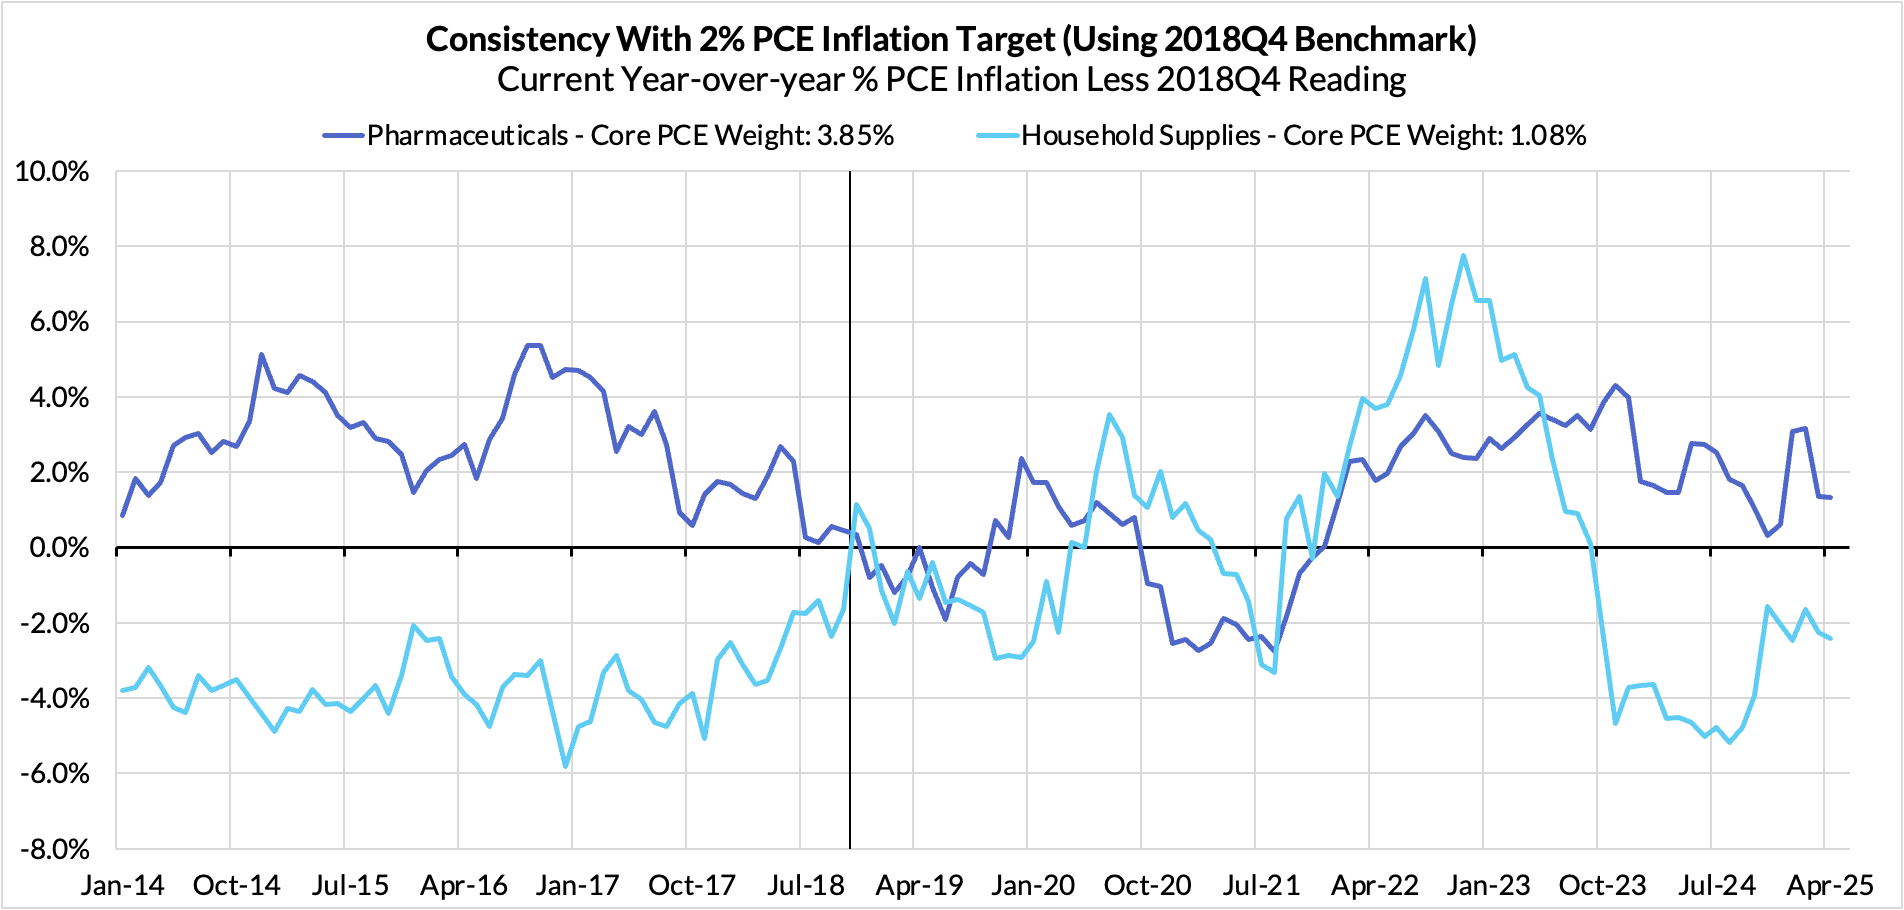
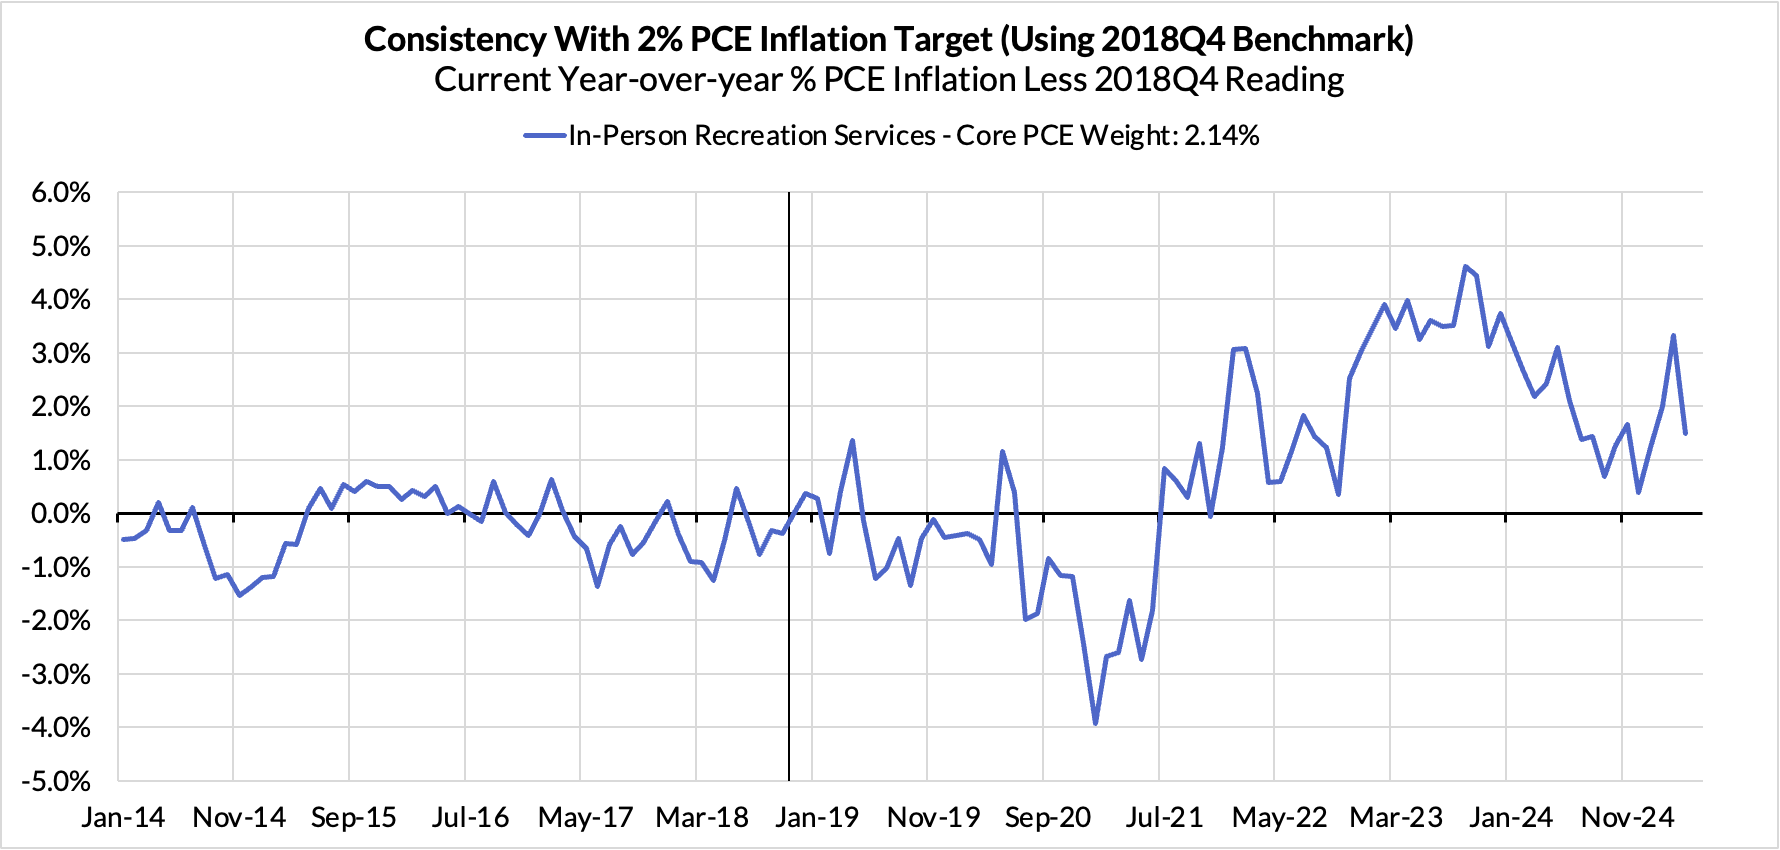
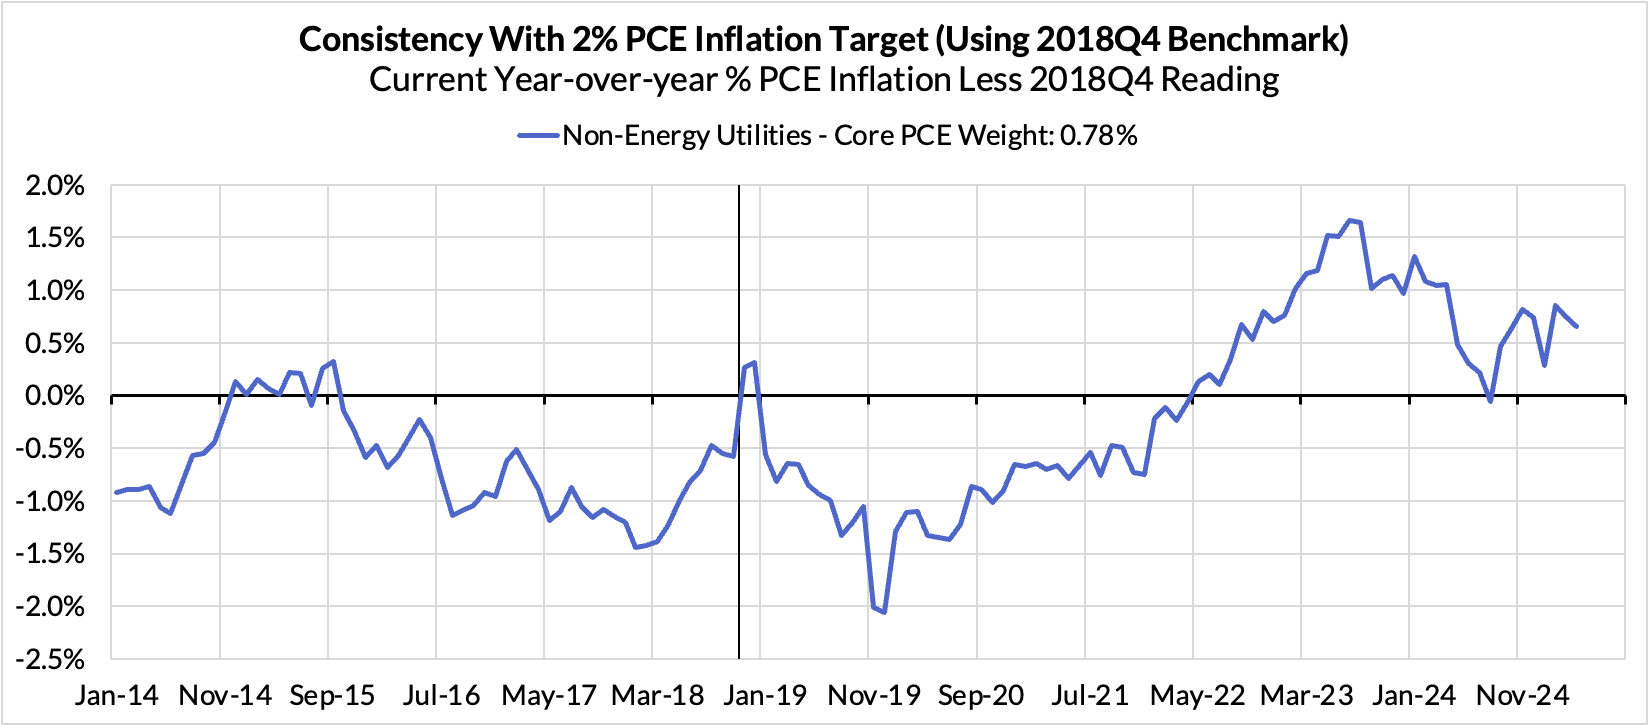
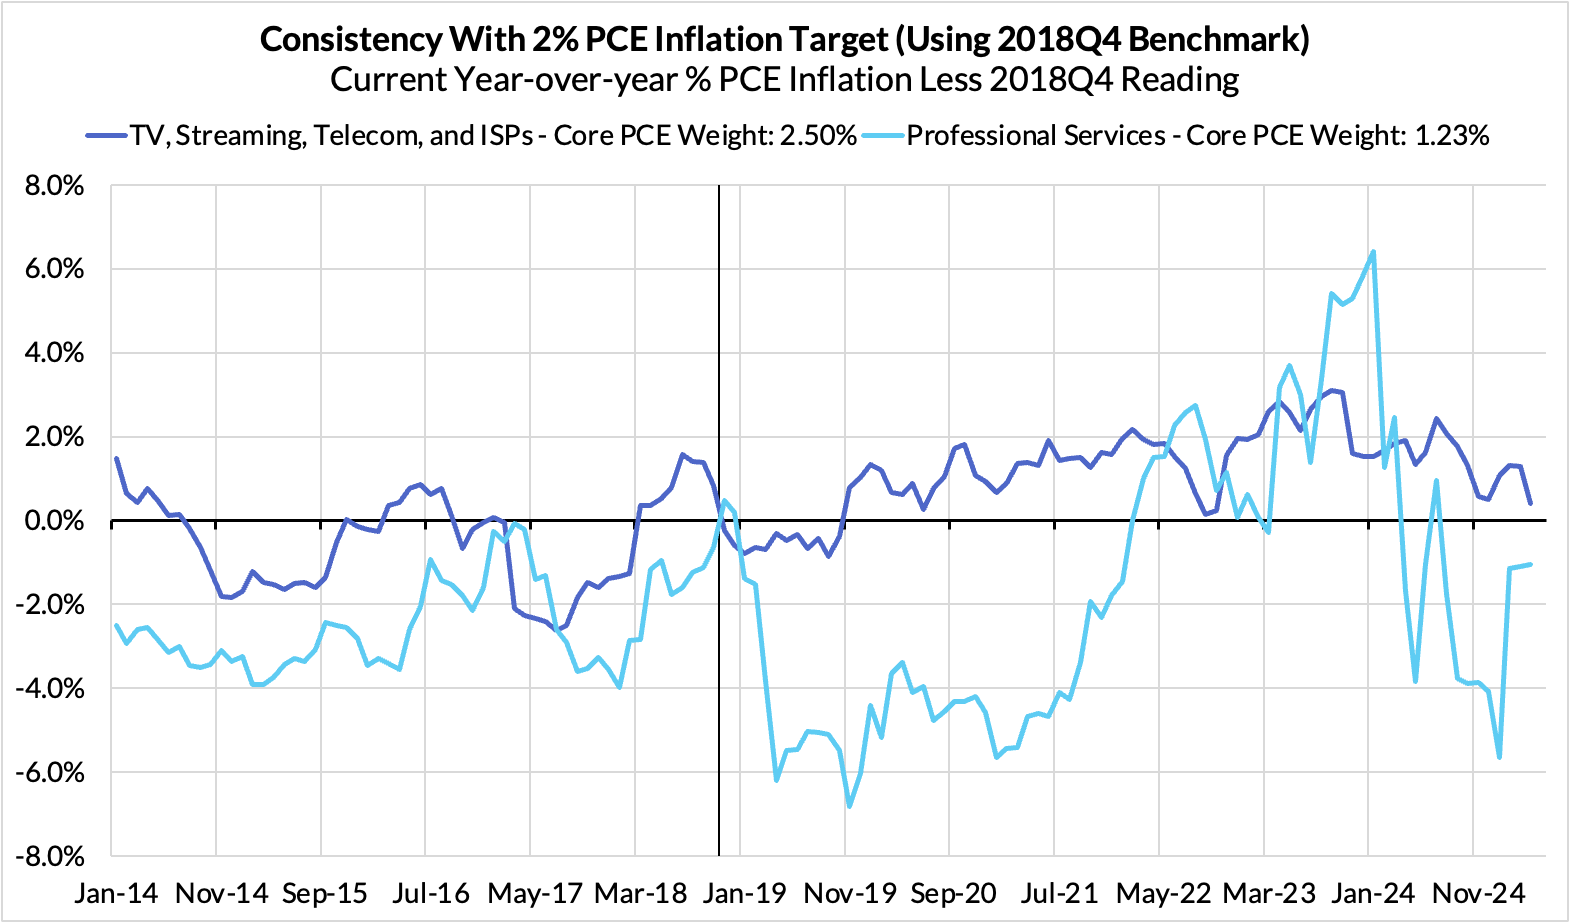
Inflation Overshoots At The Component Level
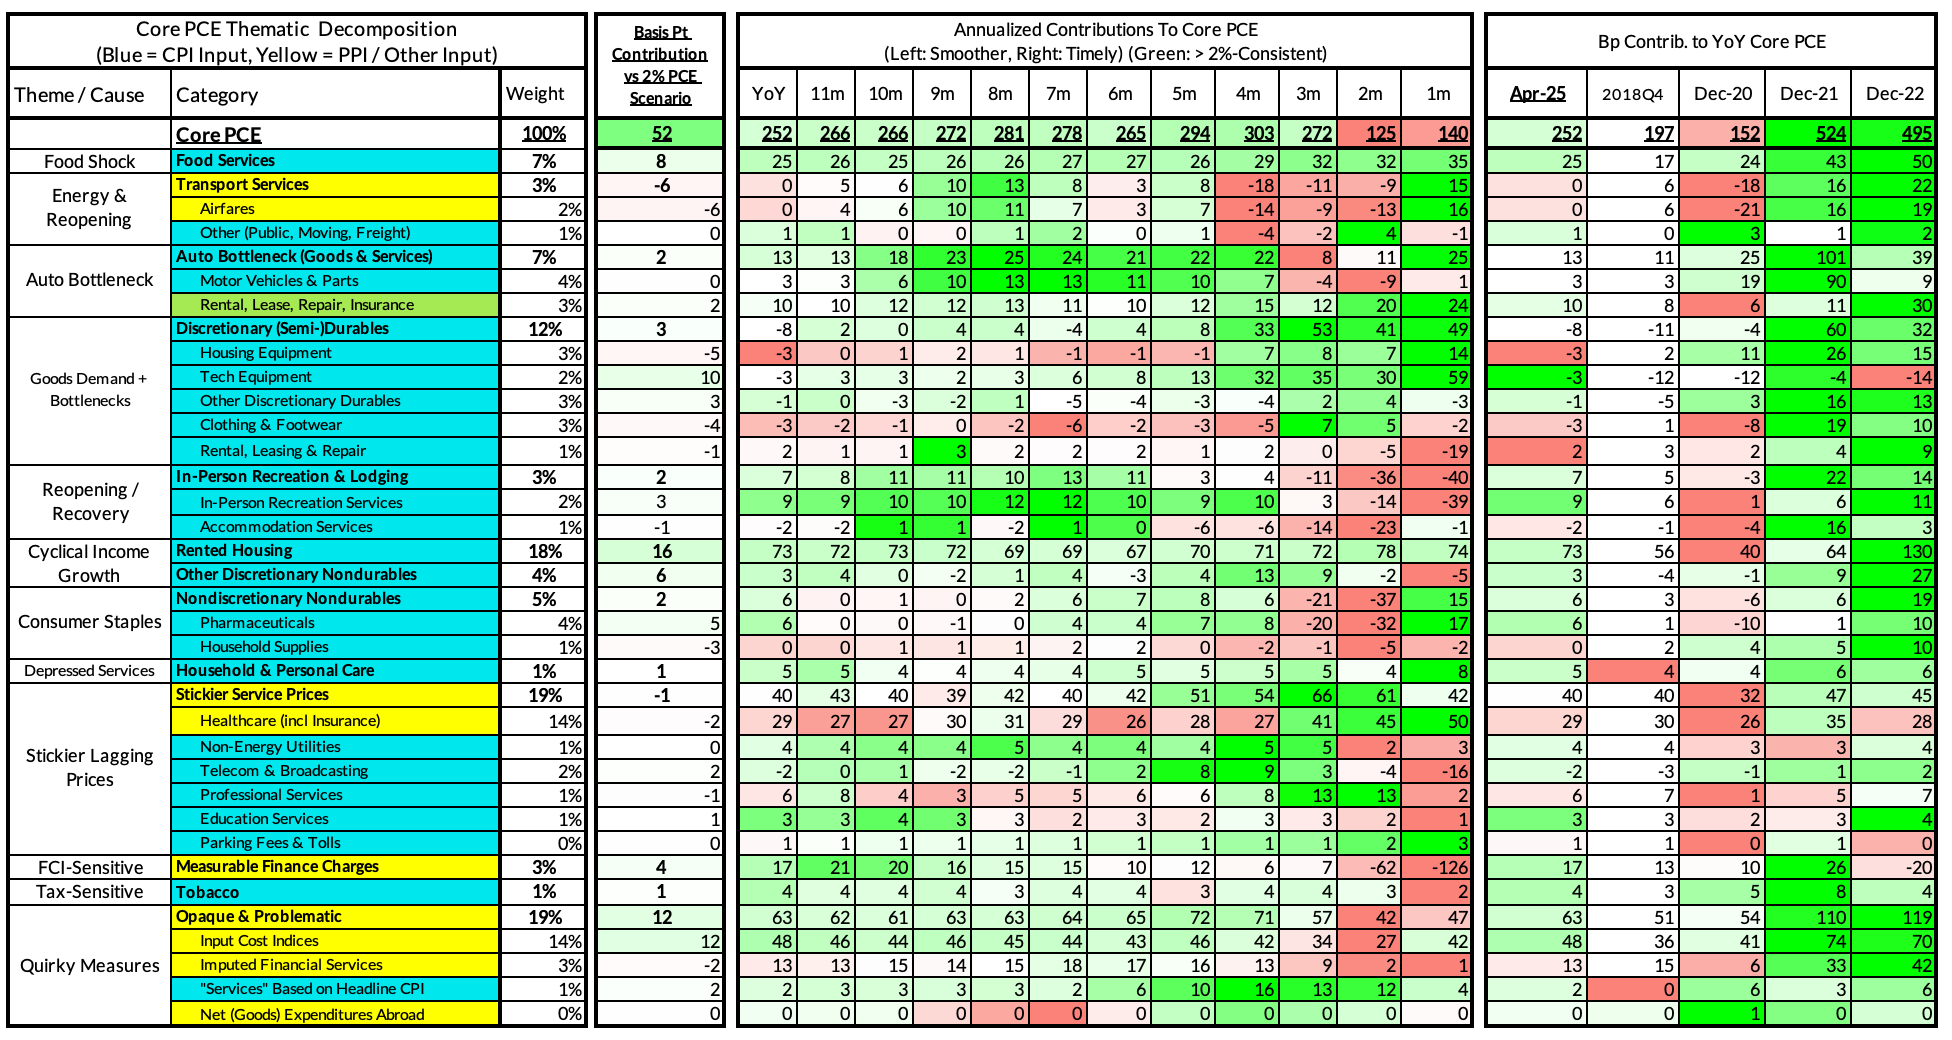
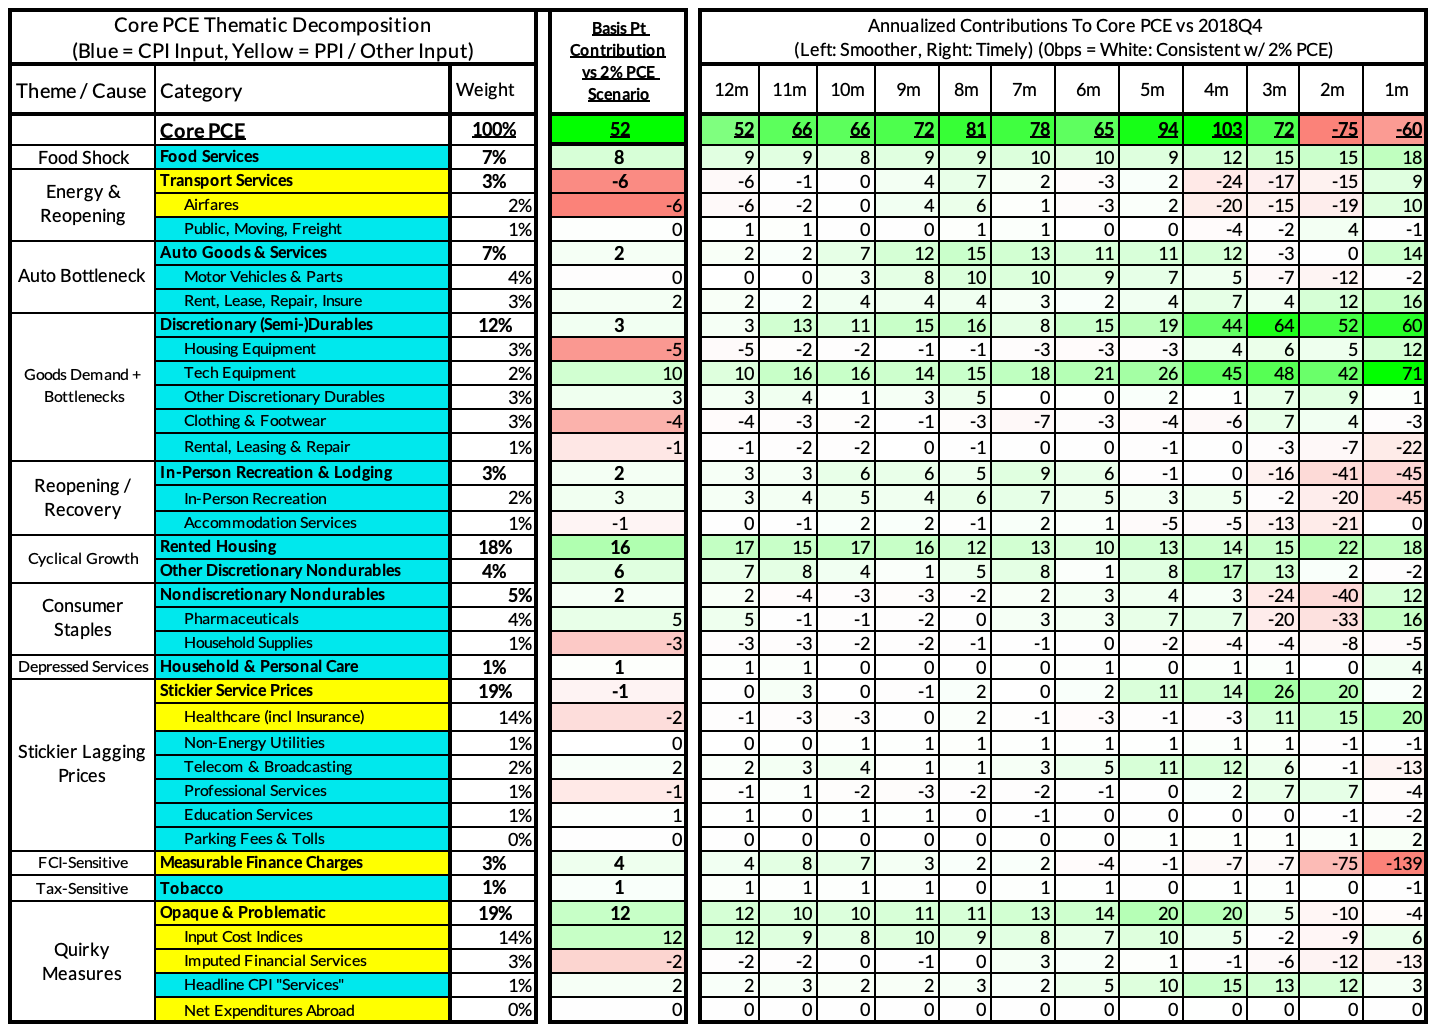
For the Detail-Oriented: Core PCE Heatmaps
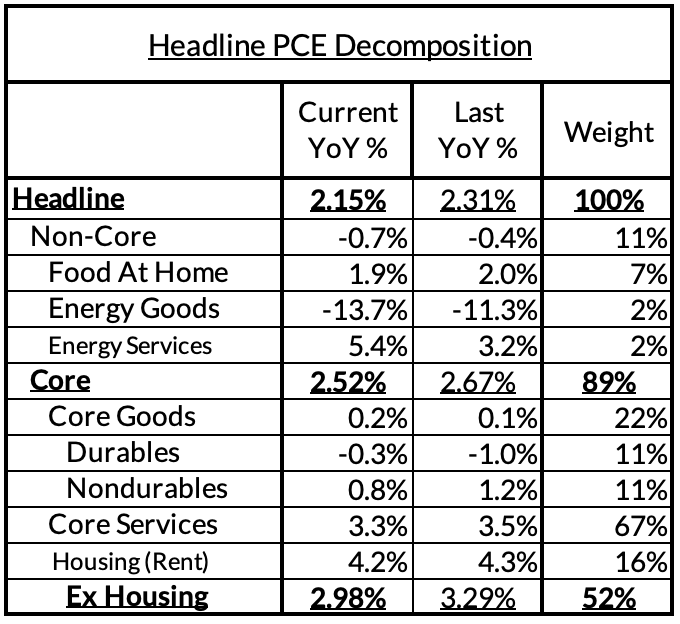
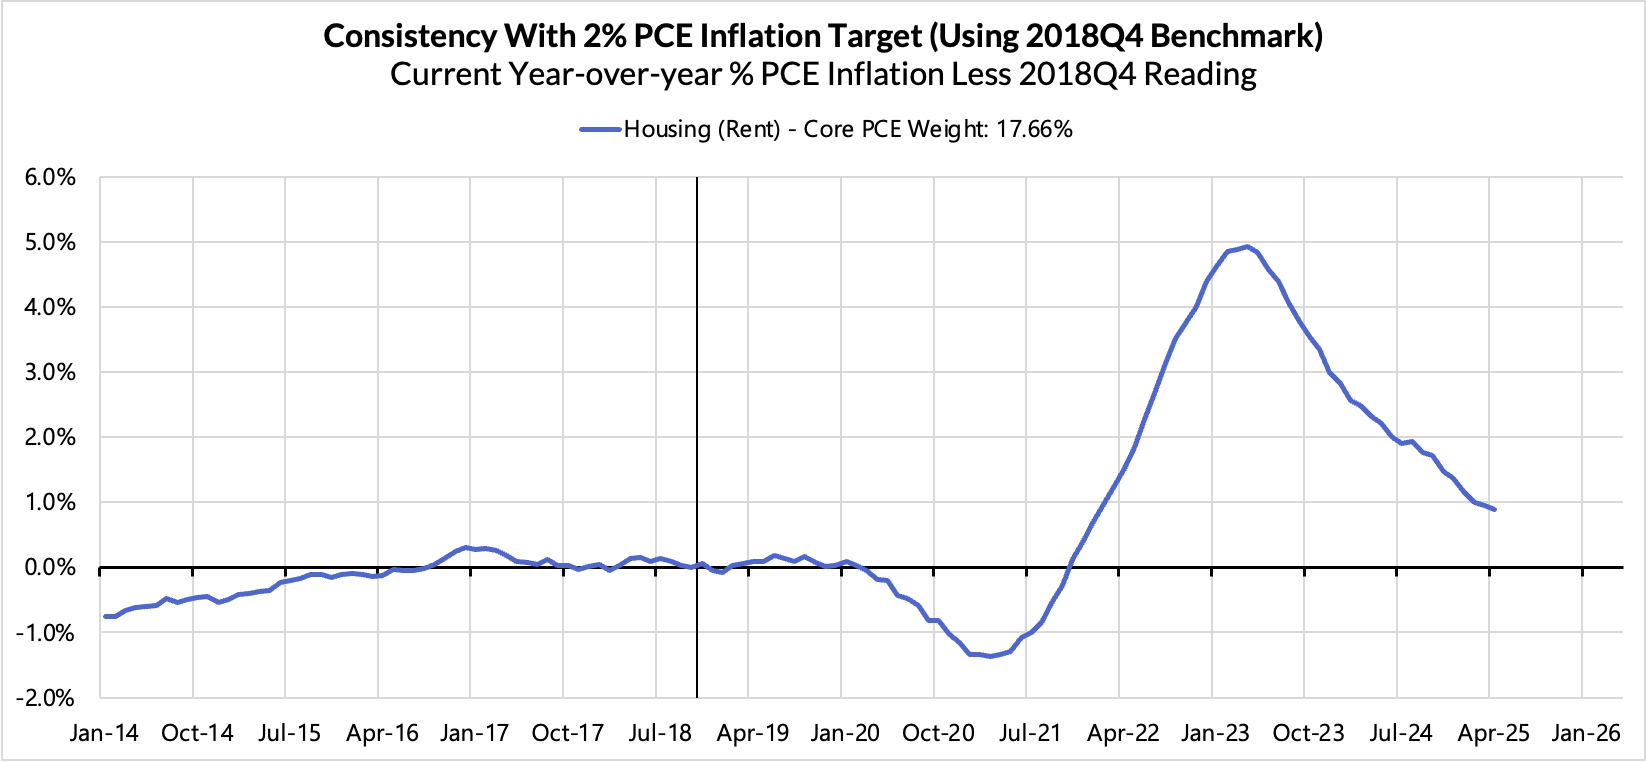
Right now Core PCE (PCE less food products and energy) is running at a 2.52% year-over-year pace as of April, 52 basis points above the Fed's 2% inflation target for PCE. That projected overshoot is still driven substantially by catch-up rent CPI inflation in response to the surge in household formation (a byproduct of rapidly recovering job growth) and market rents in 2021-22. Rent is on track to contribute 16 basis points to the 52 basis point Core PCE overshoot.
There are other contributors to the overshoot:
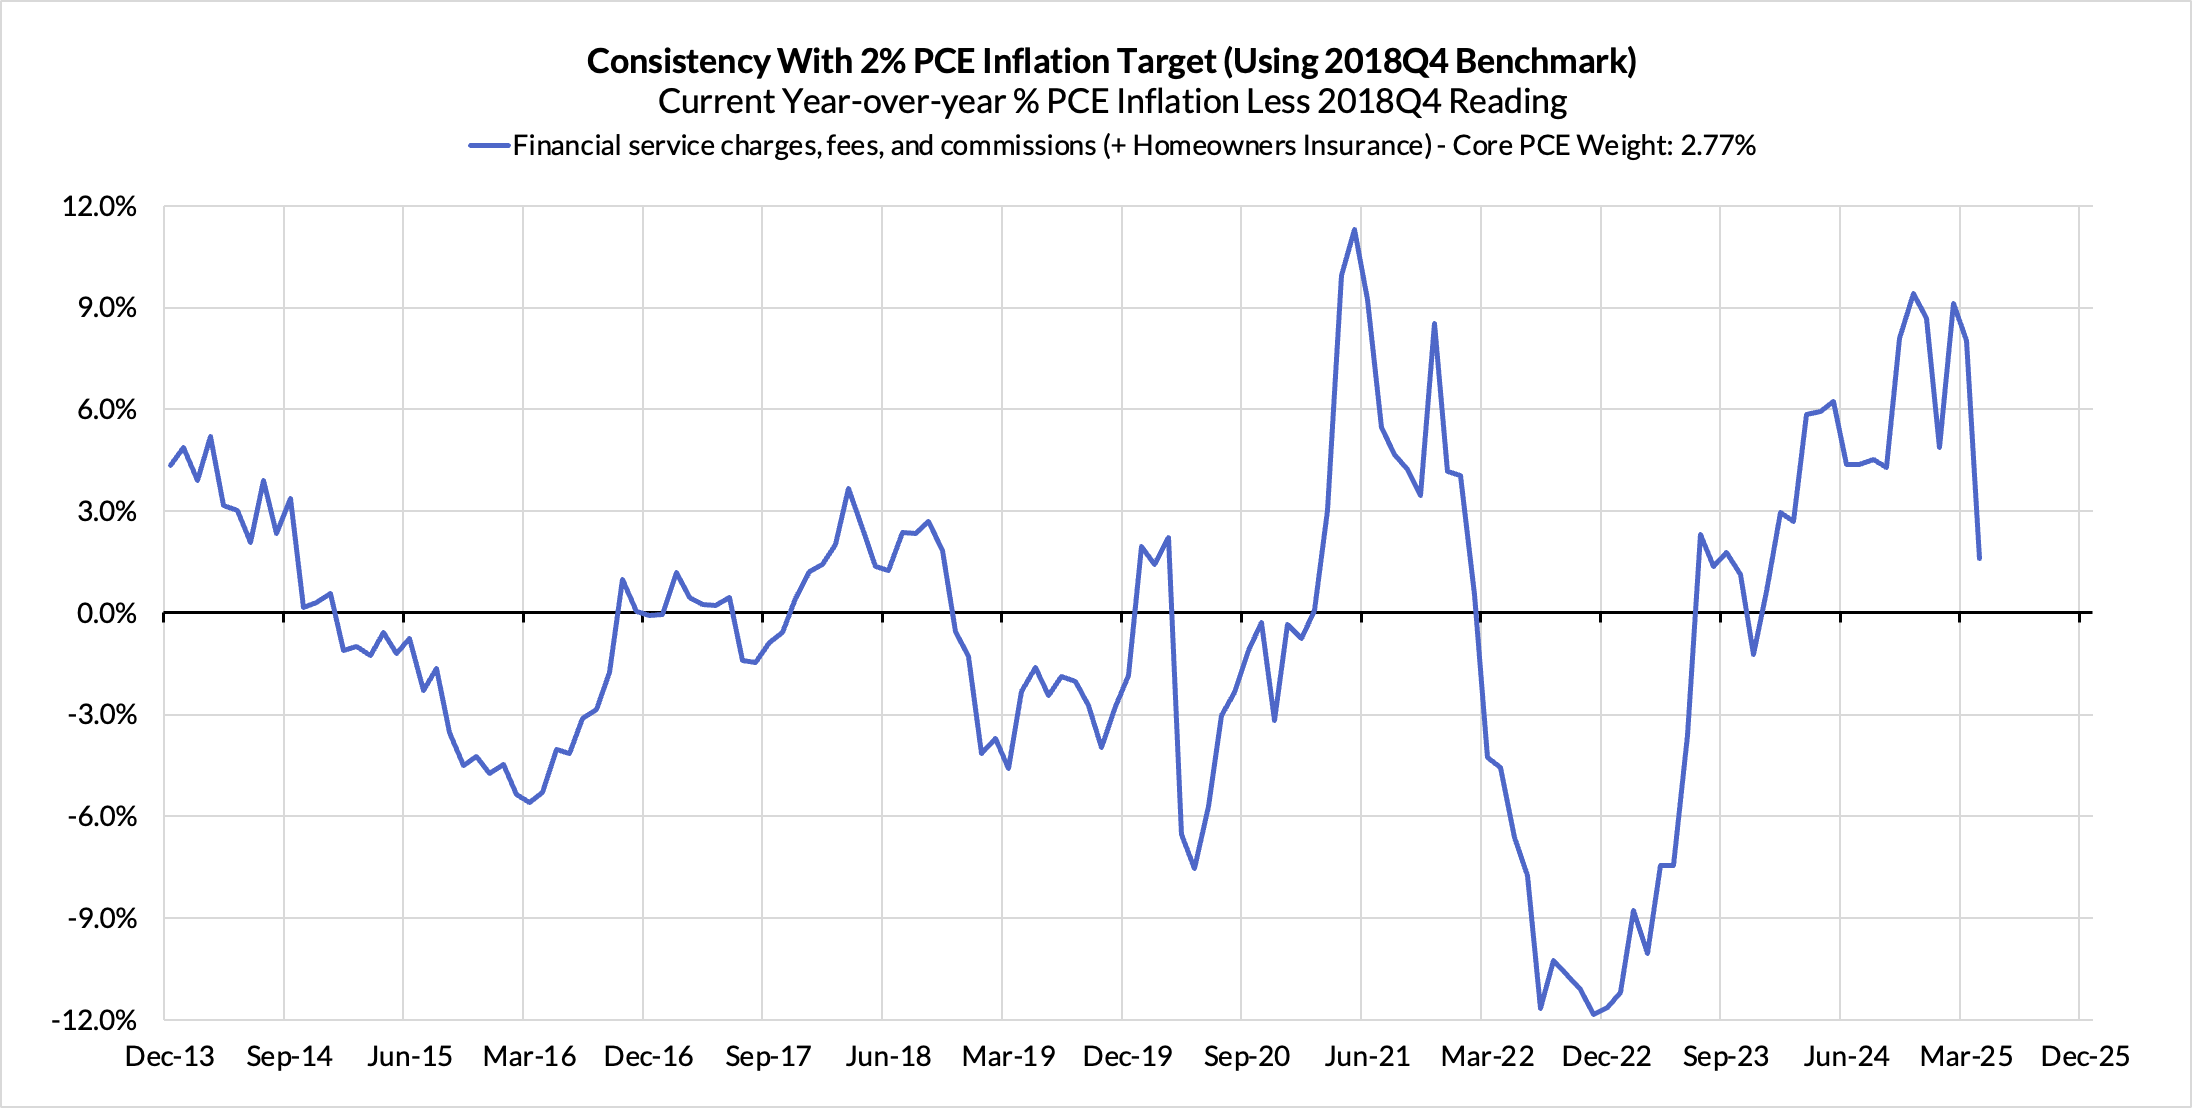
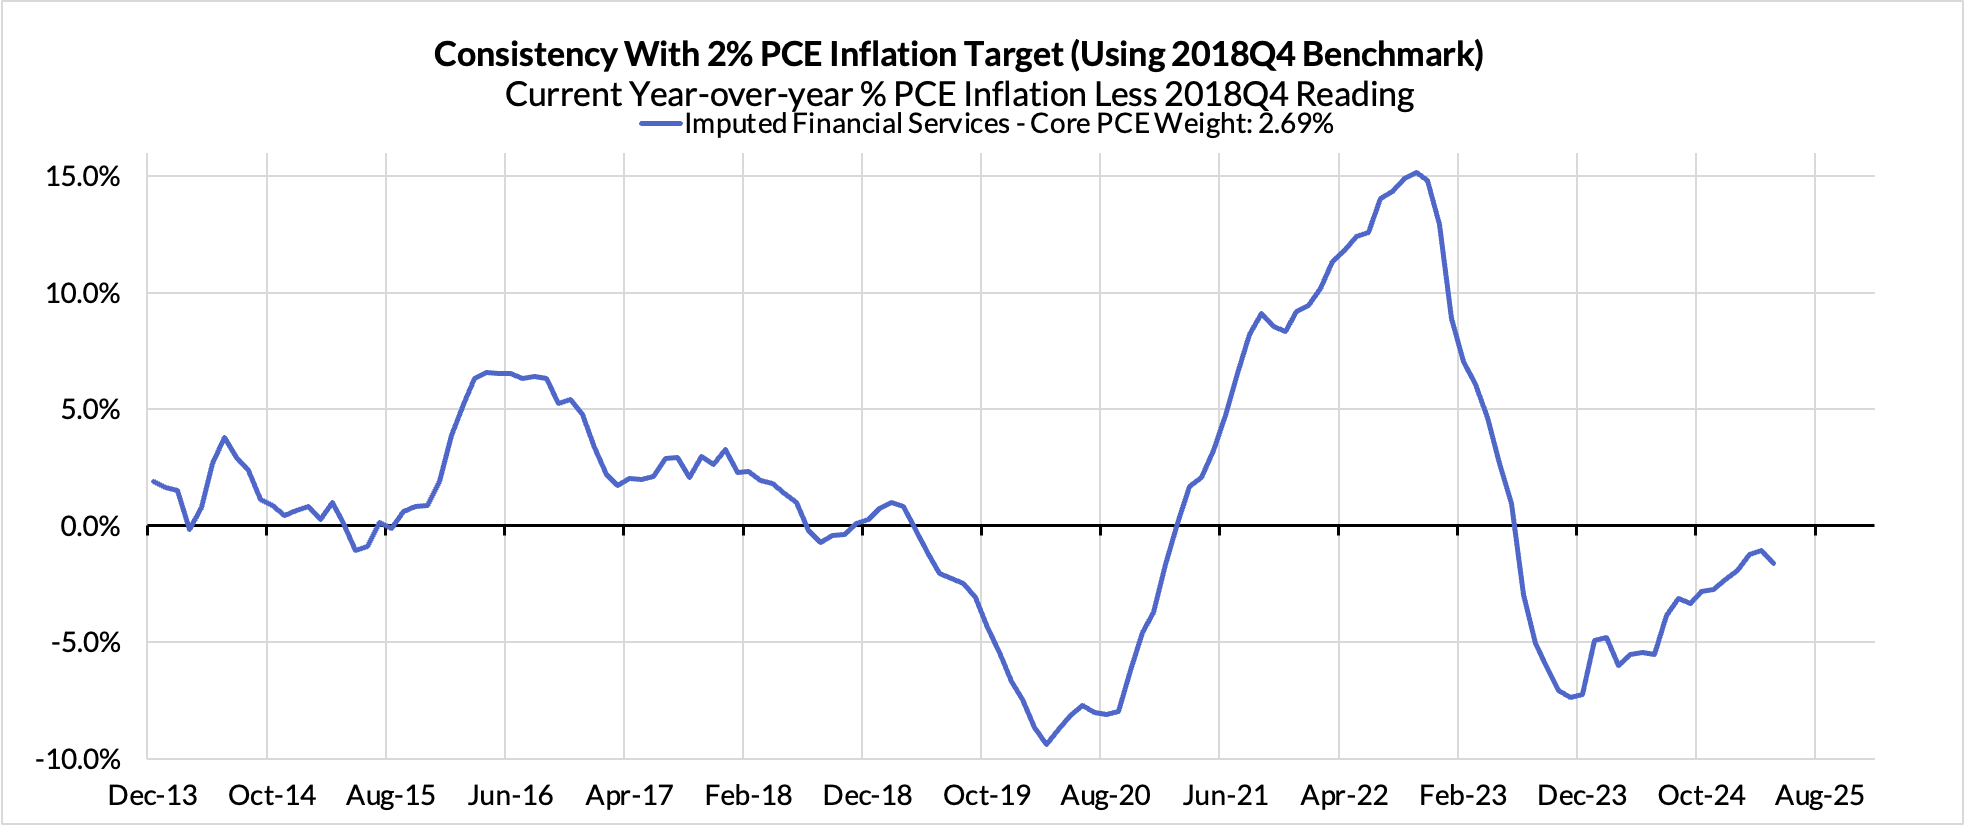
Measured financial service charges are now adding only 4 basis points due to the strong equity market performance over the past 12 months
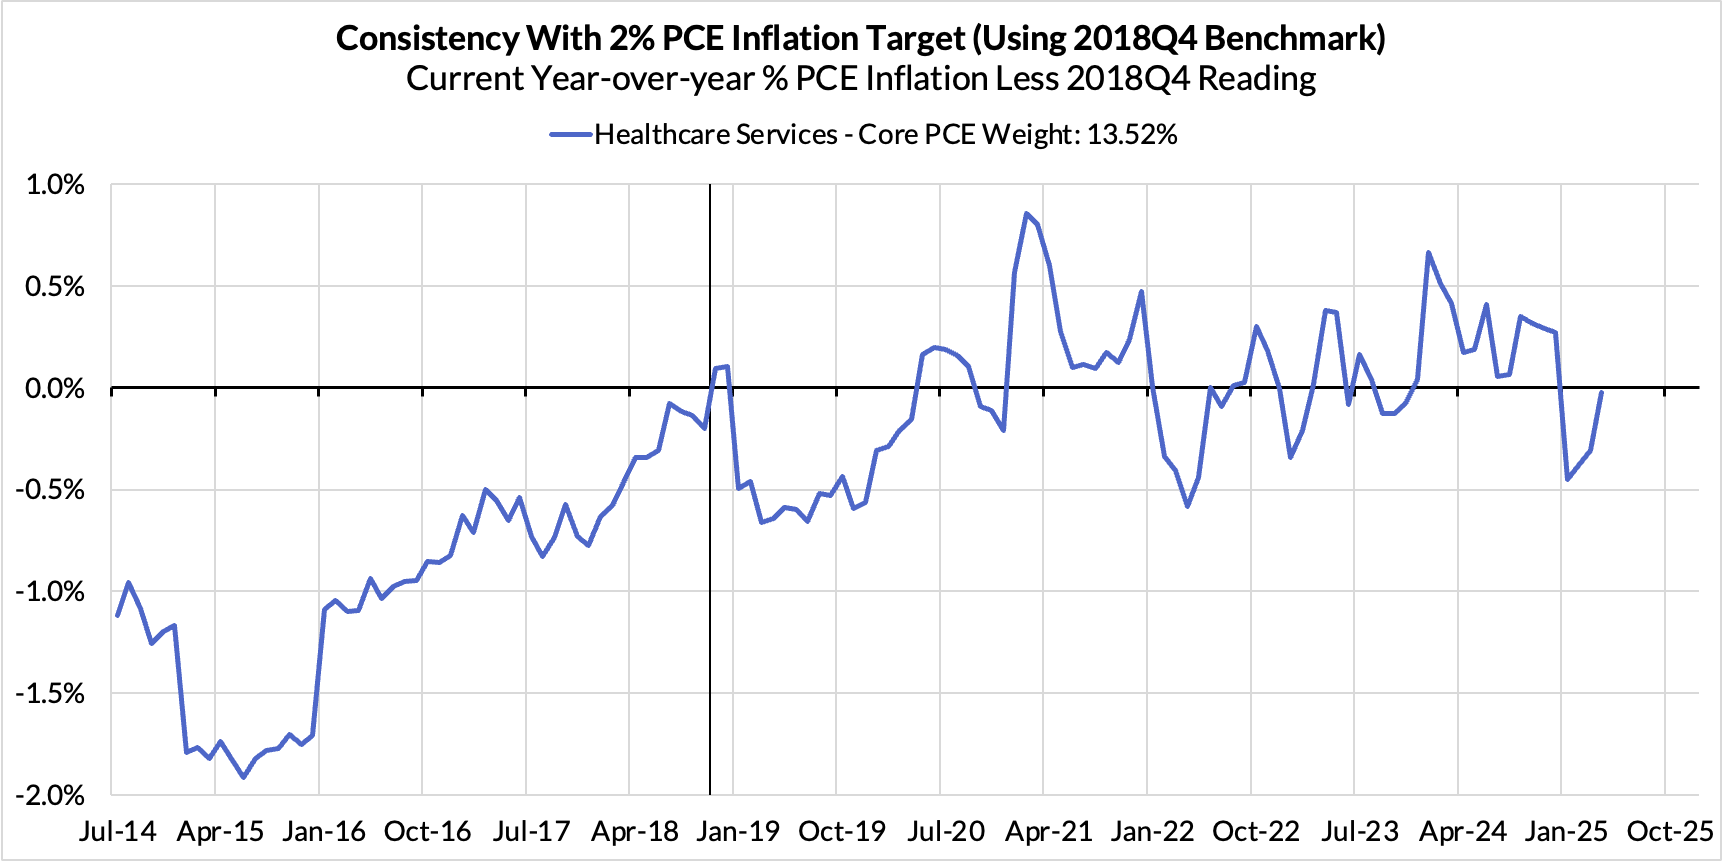
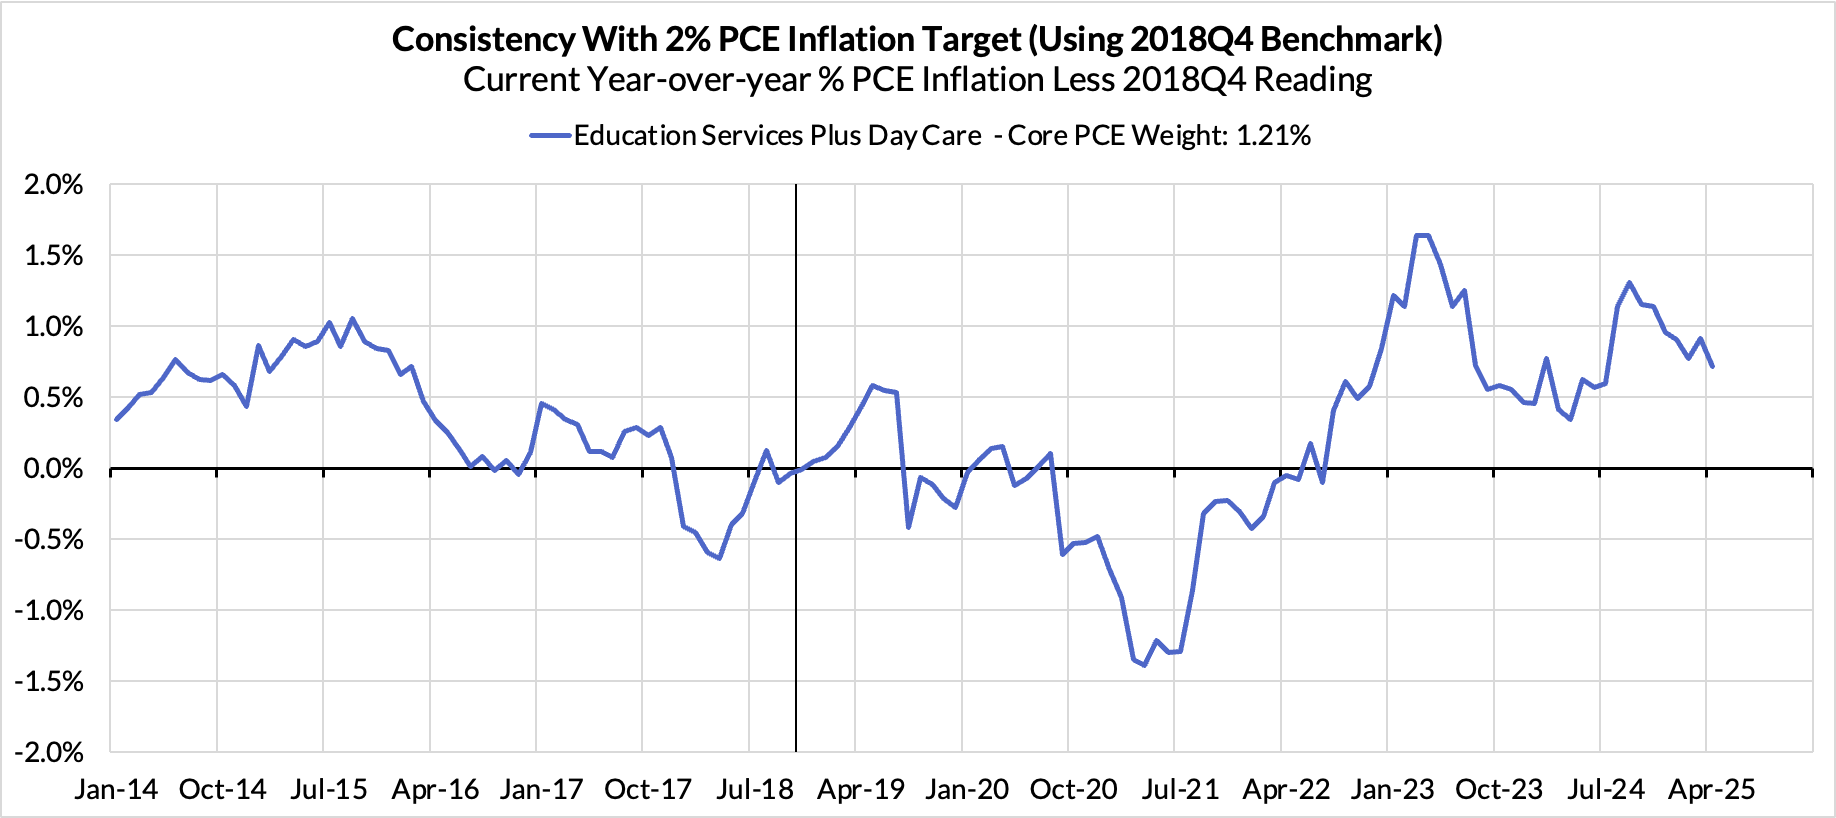
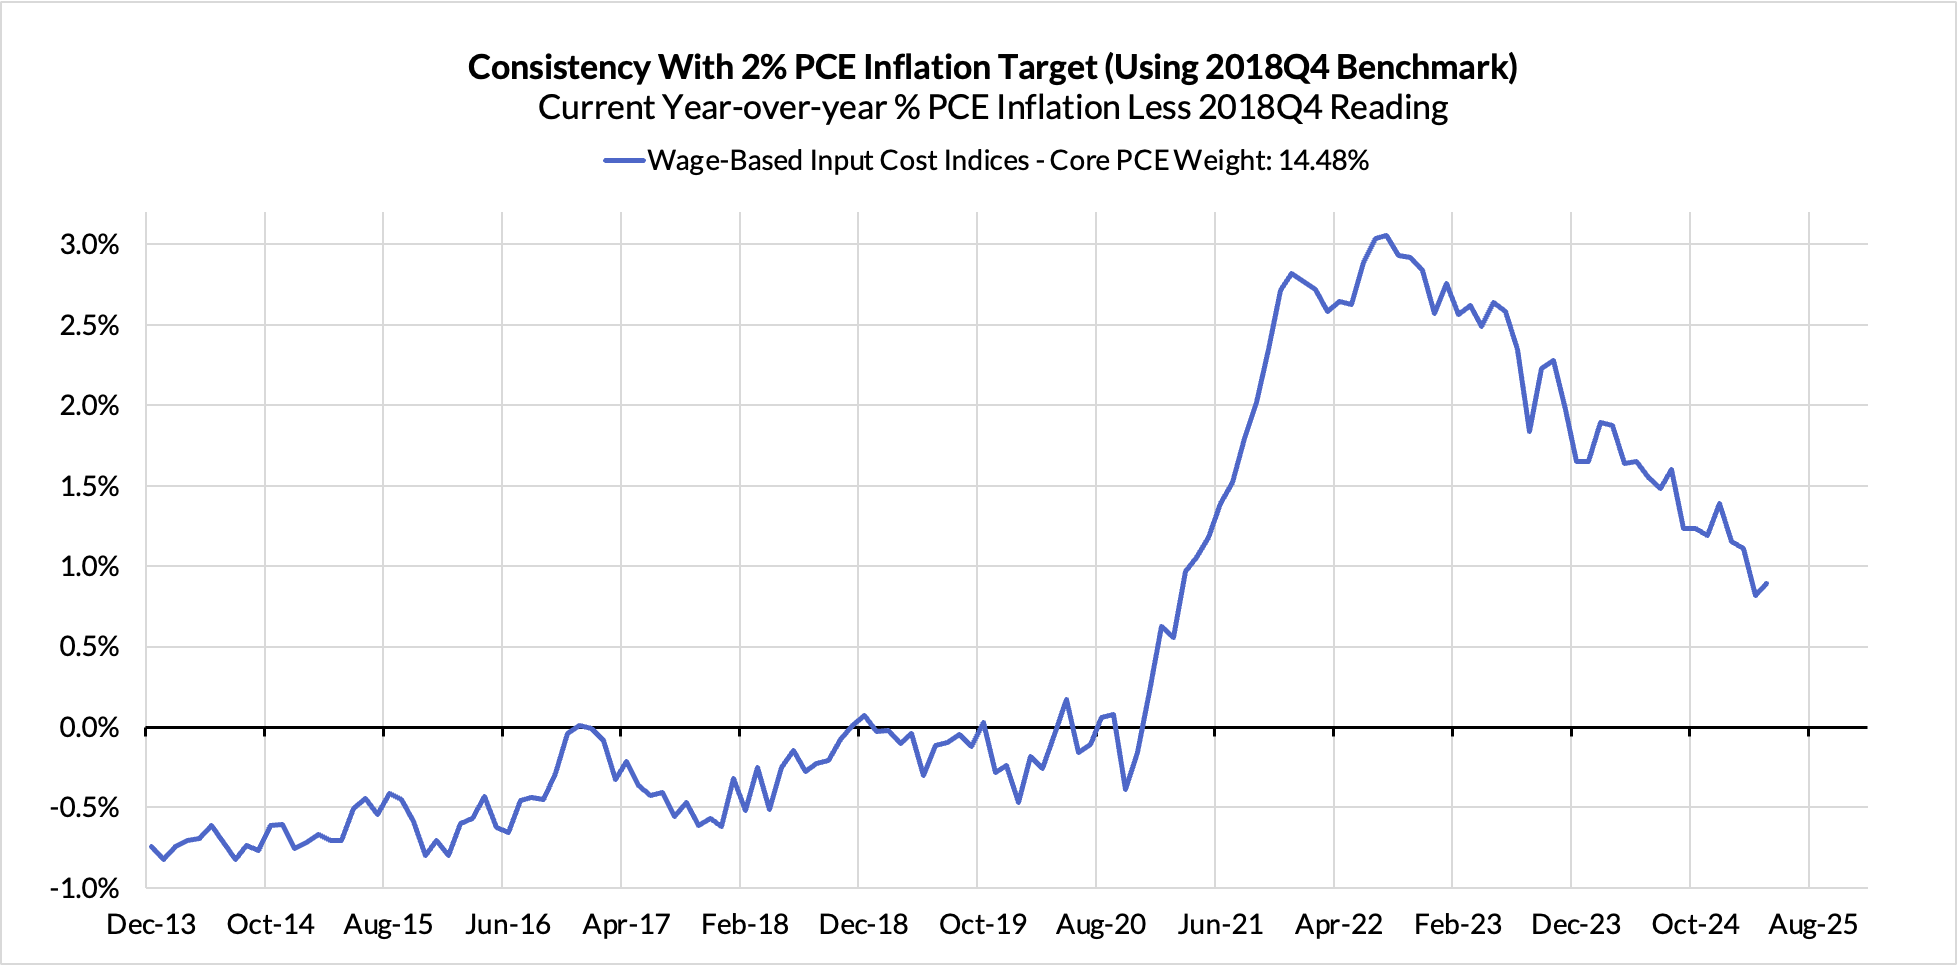
Contributions from input cost indices (wages in specific sectors where market prices don't exist) are now adding 12 basis points to the overshoot
Food inputs are adding 8 basis points to the overshoot
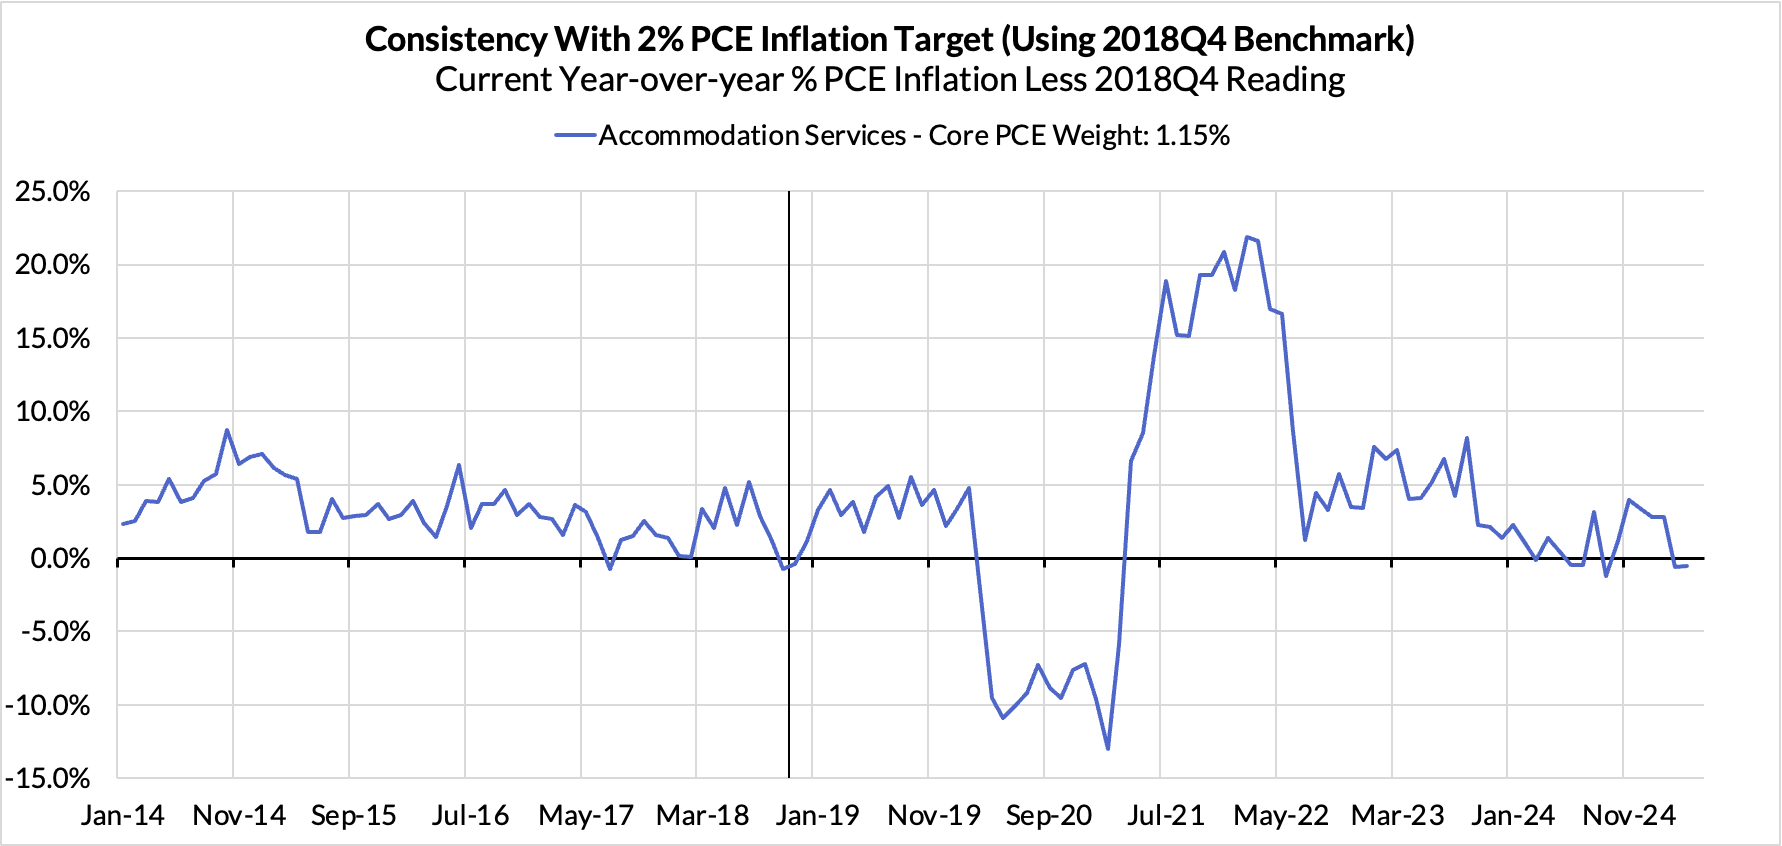
In-person recreation and lodging services are contributing 2 basis points
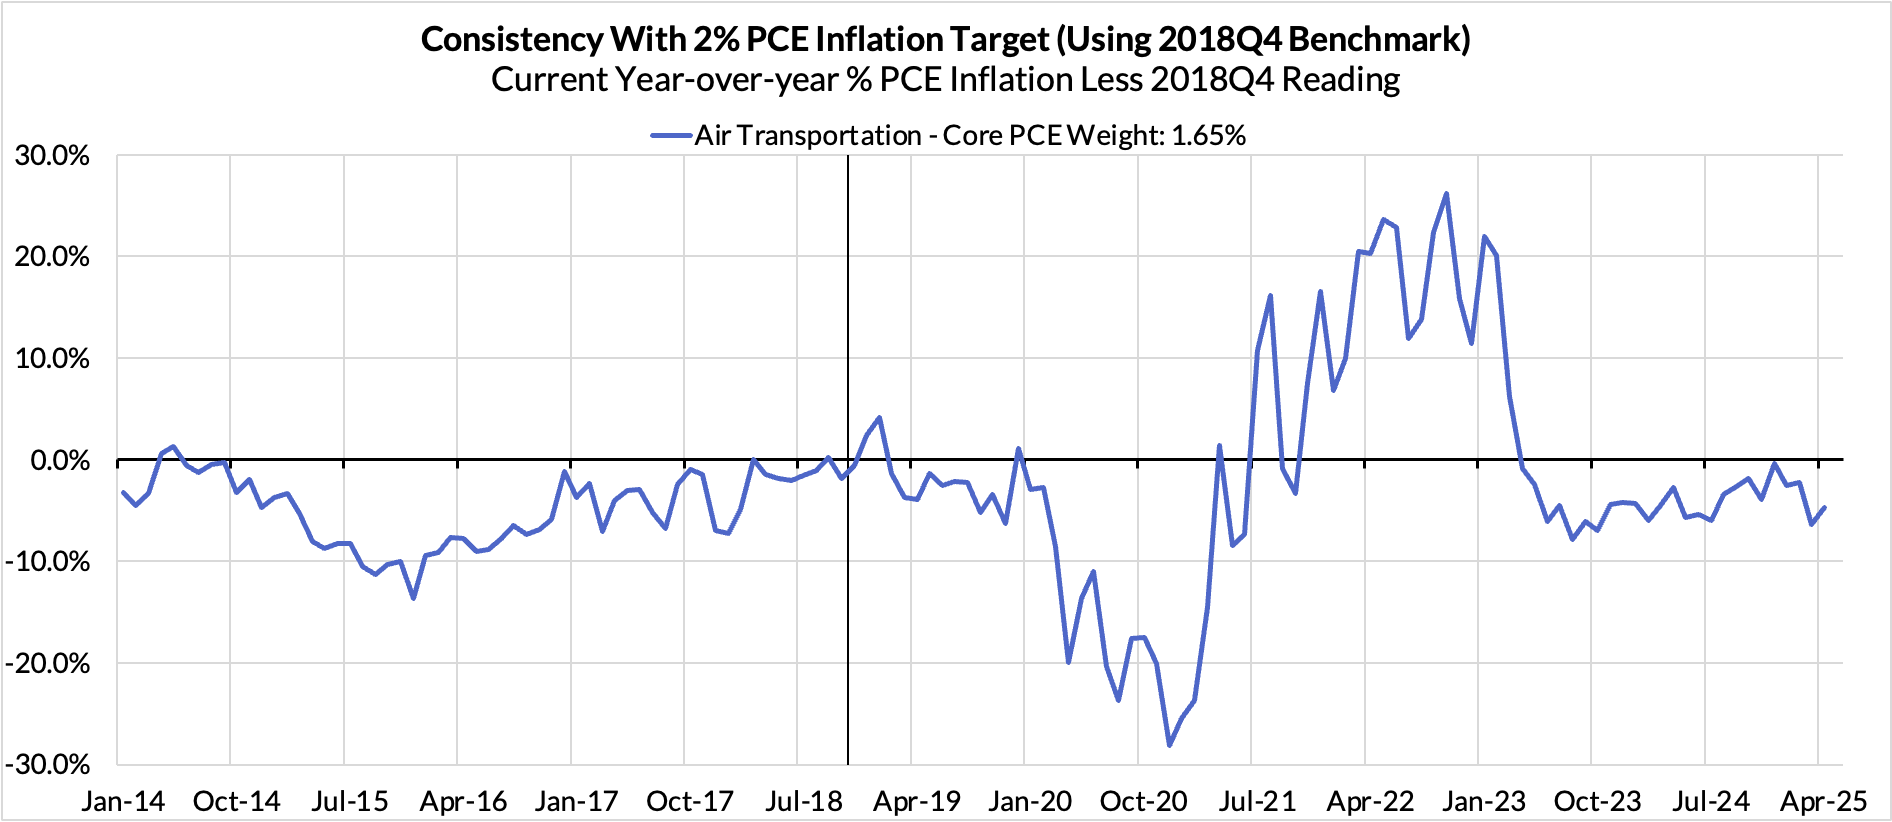
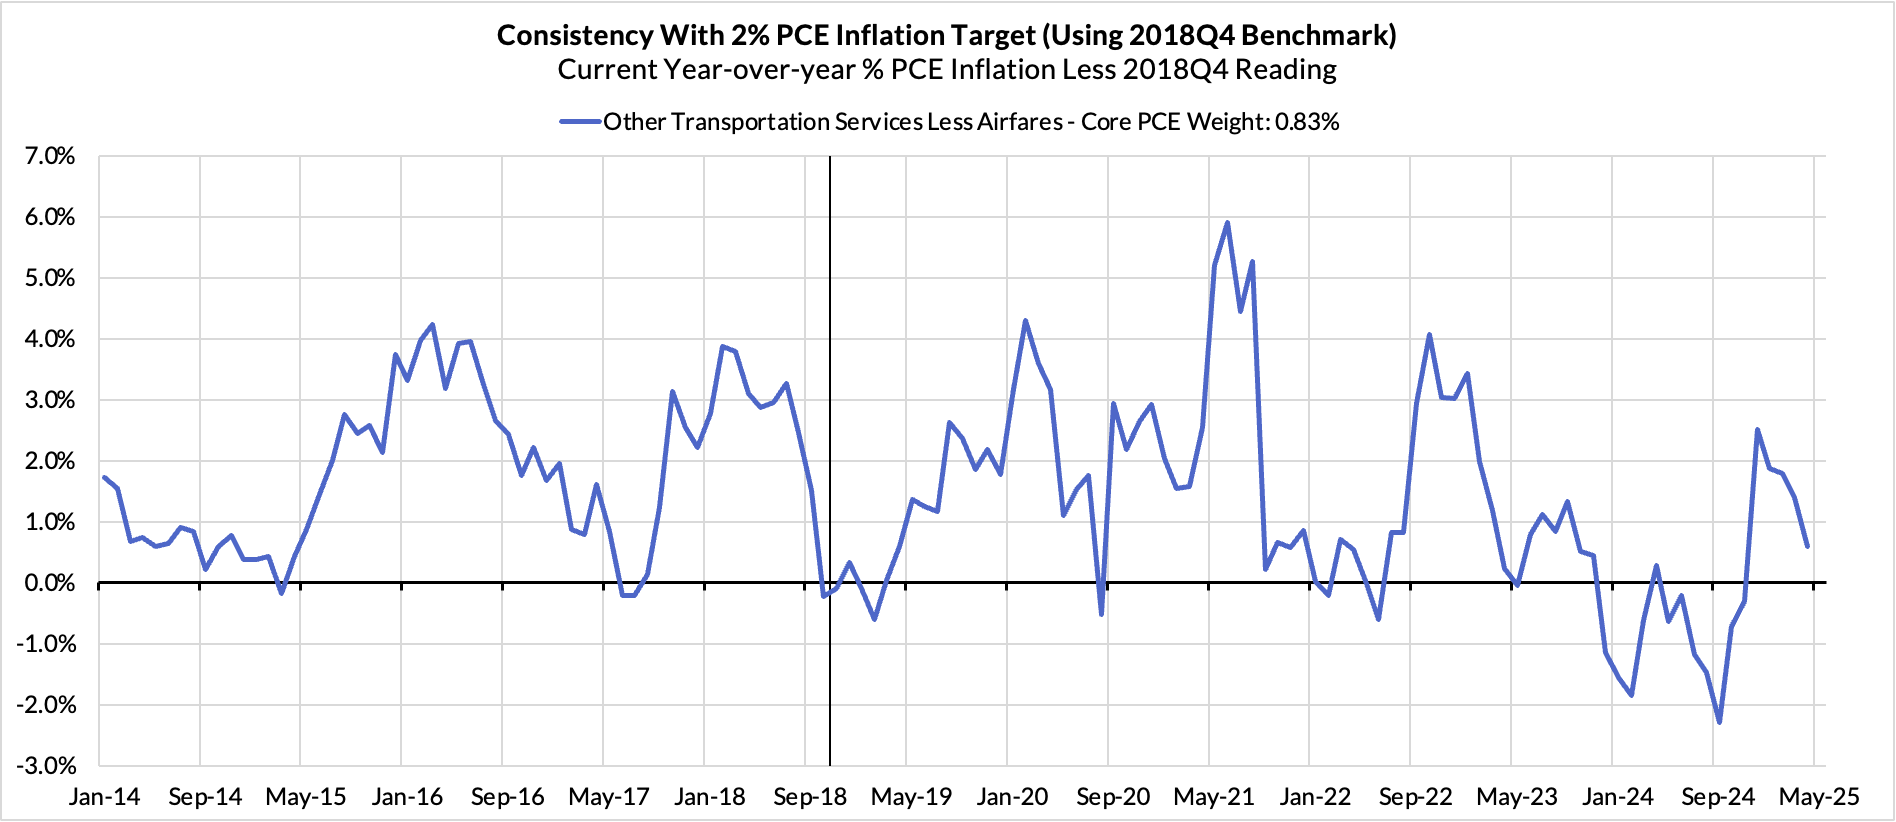
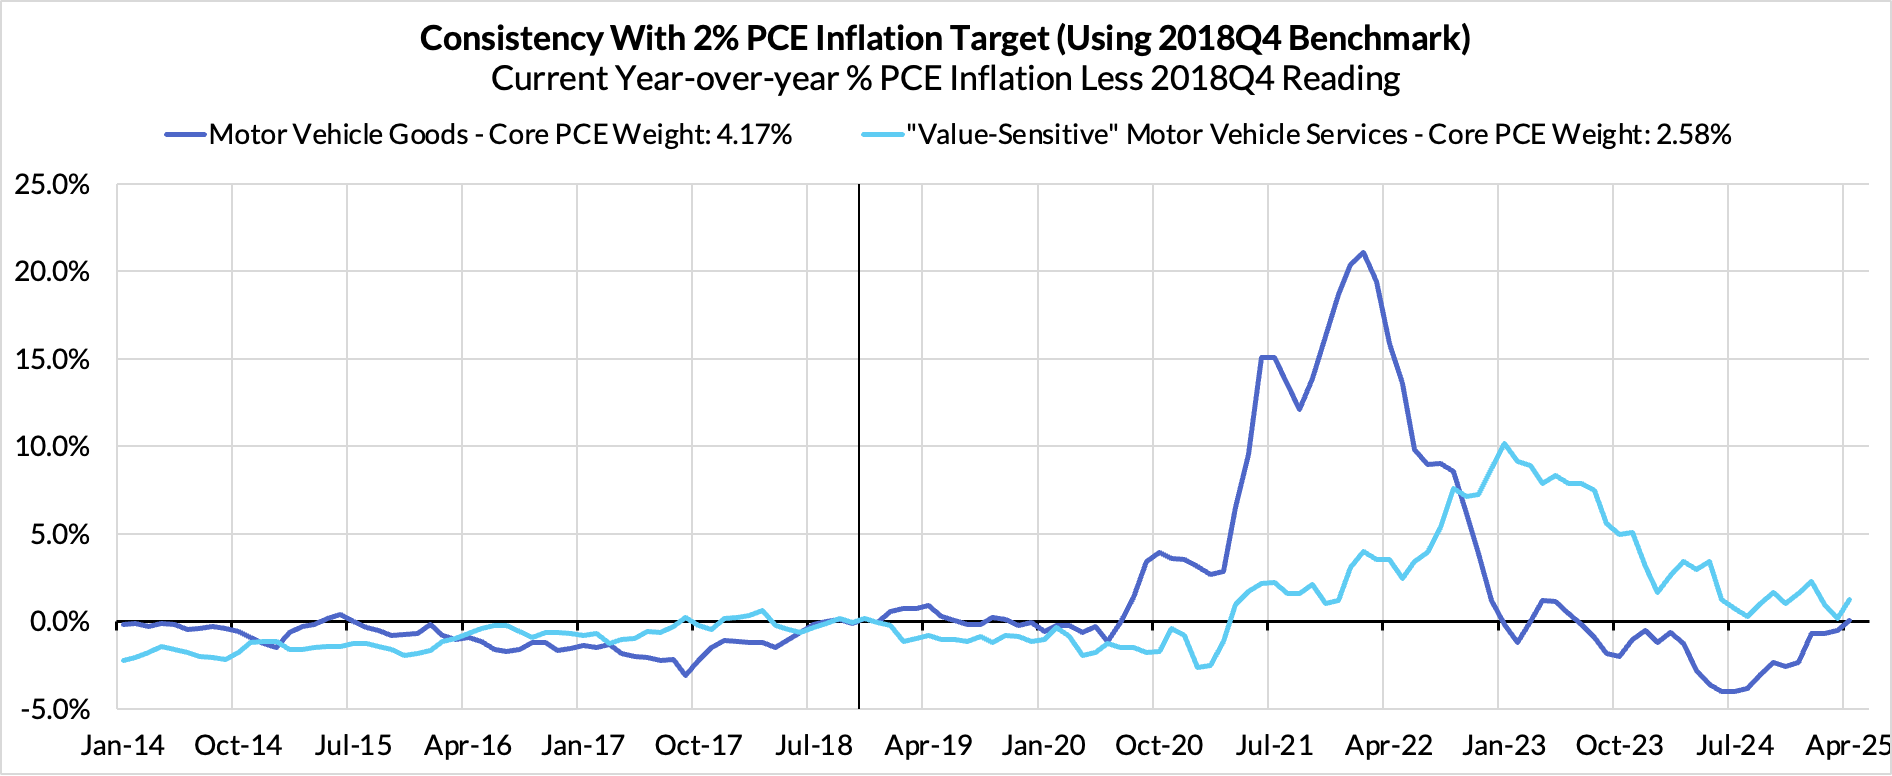
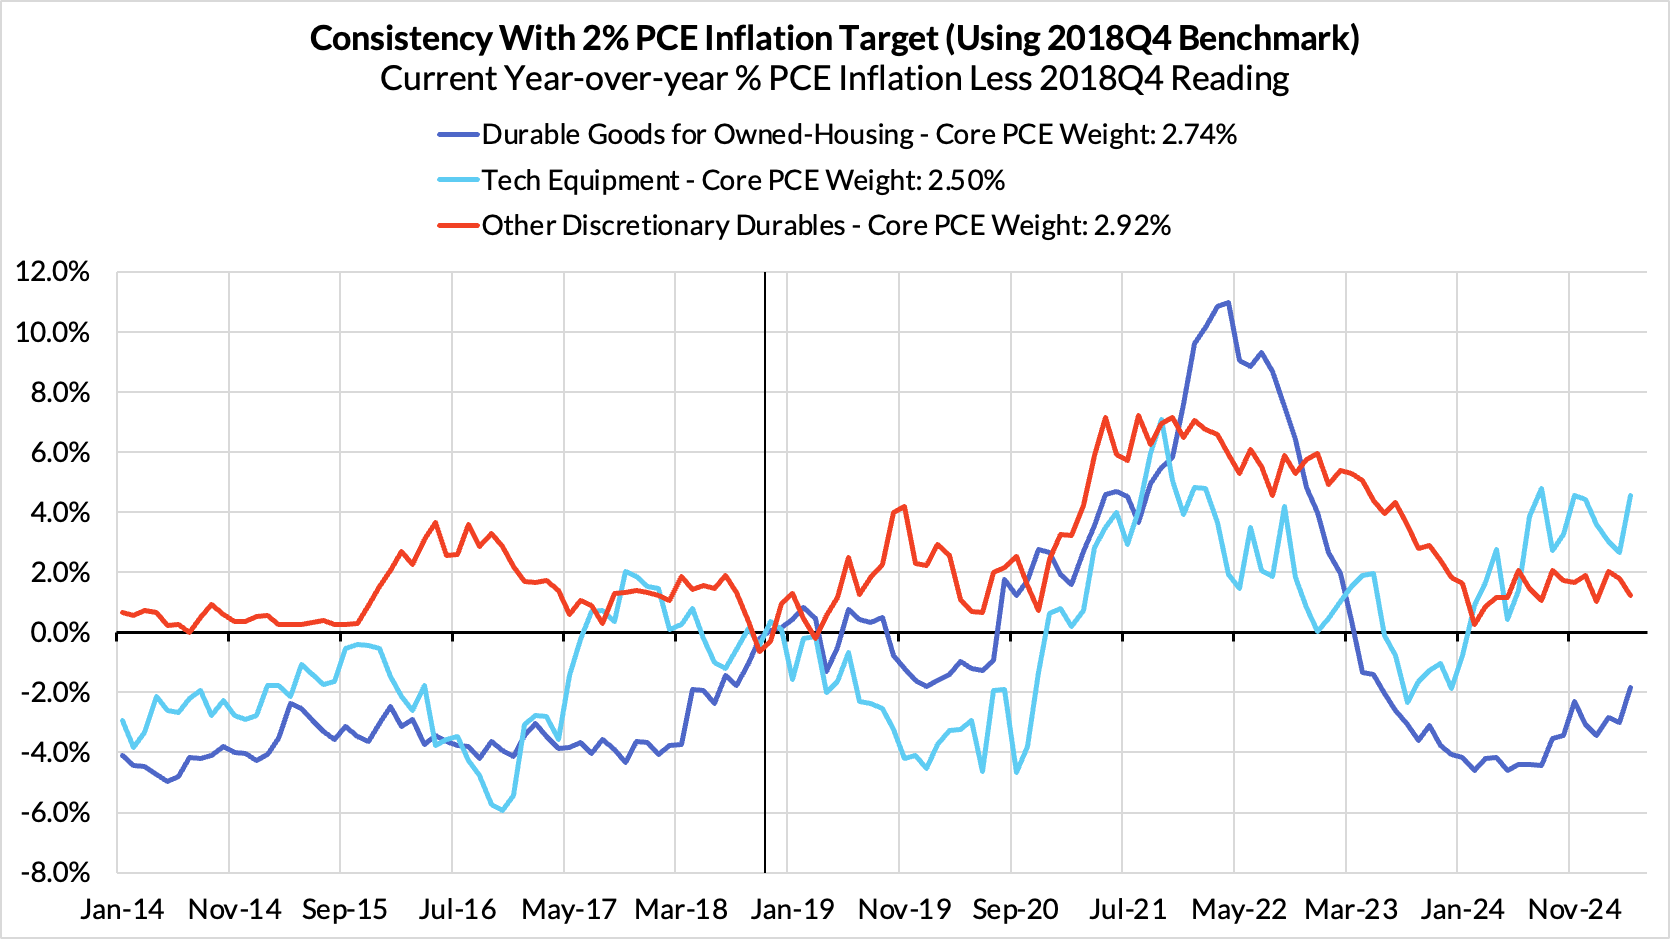
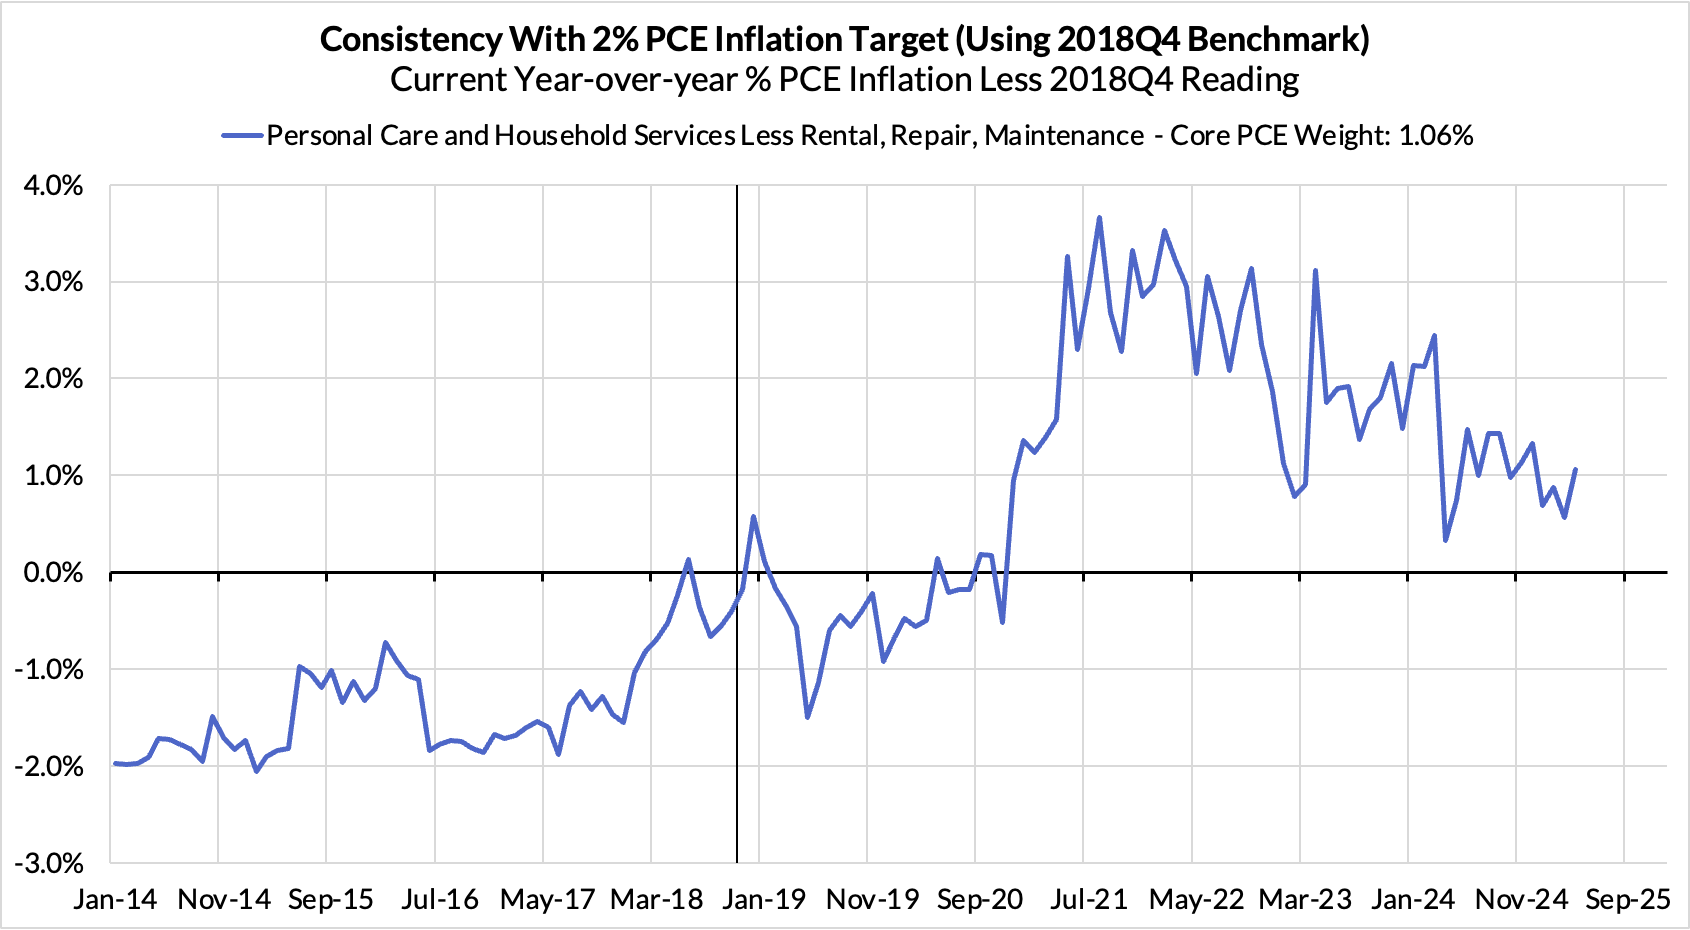
Discretionary goods and adjacent services are adding 9 basis points
The final heatmap below gives you a sense of the overshoot on shorter annualized run-rates. April monthly annualized Core PCE ran at a 1.40% annualized pace, a 60 basis point undershoot vs 2% target inflation.
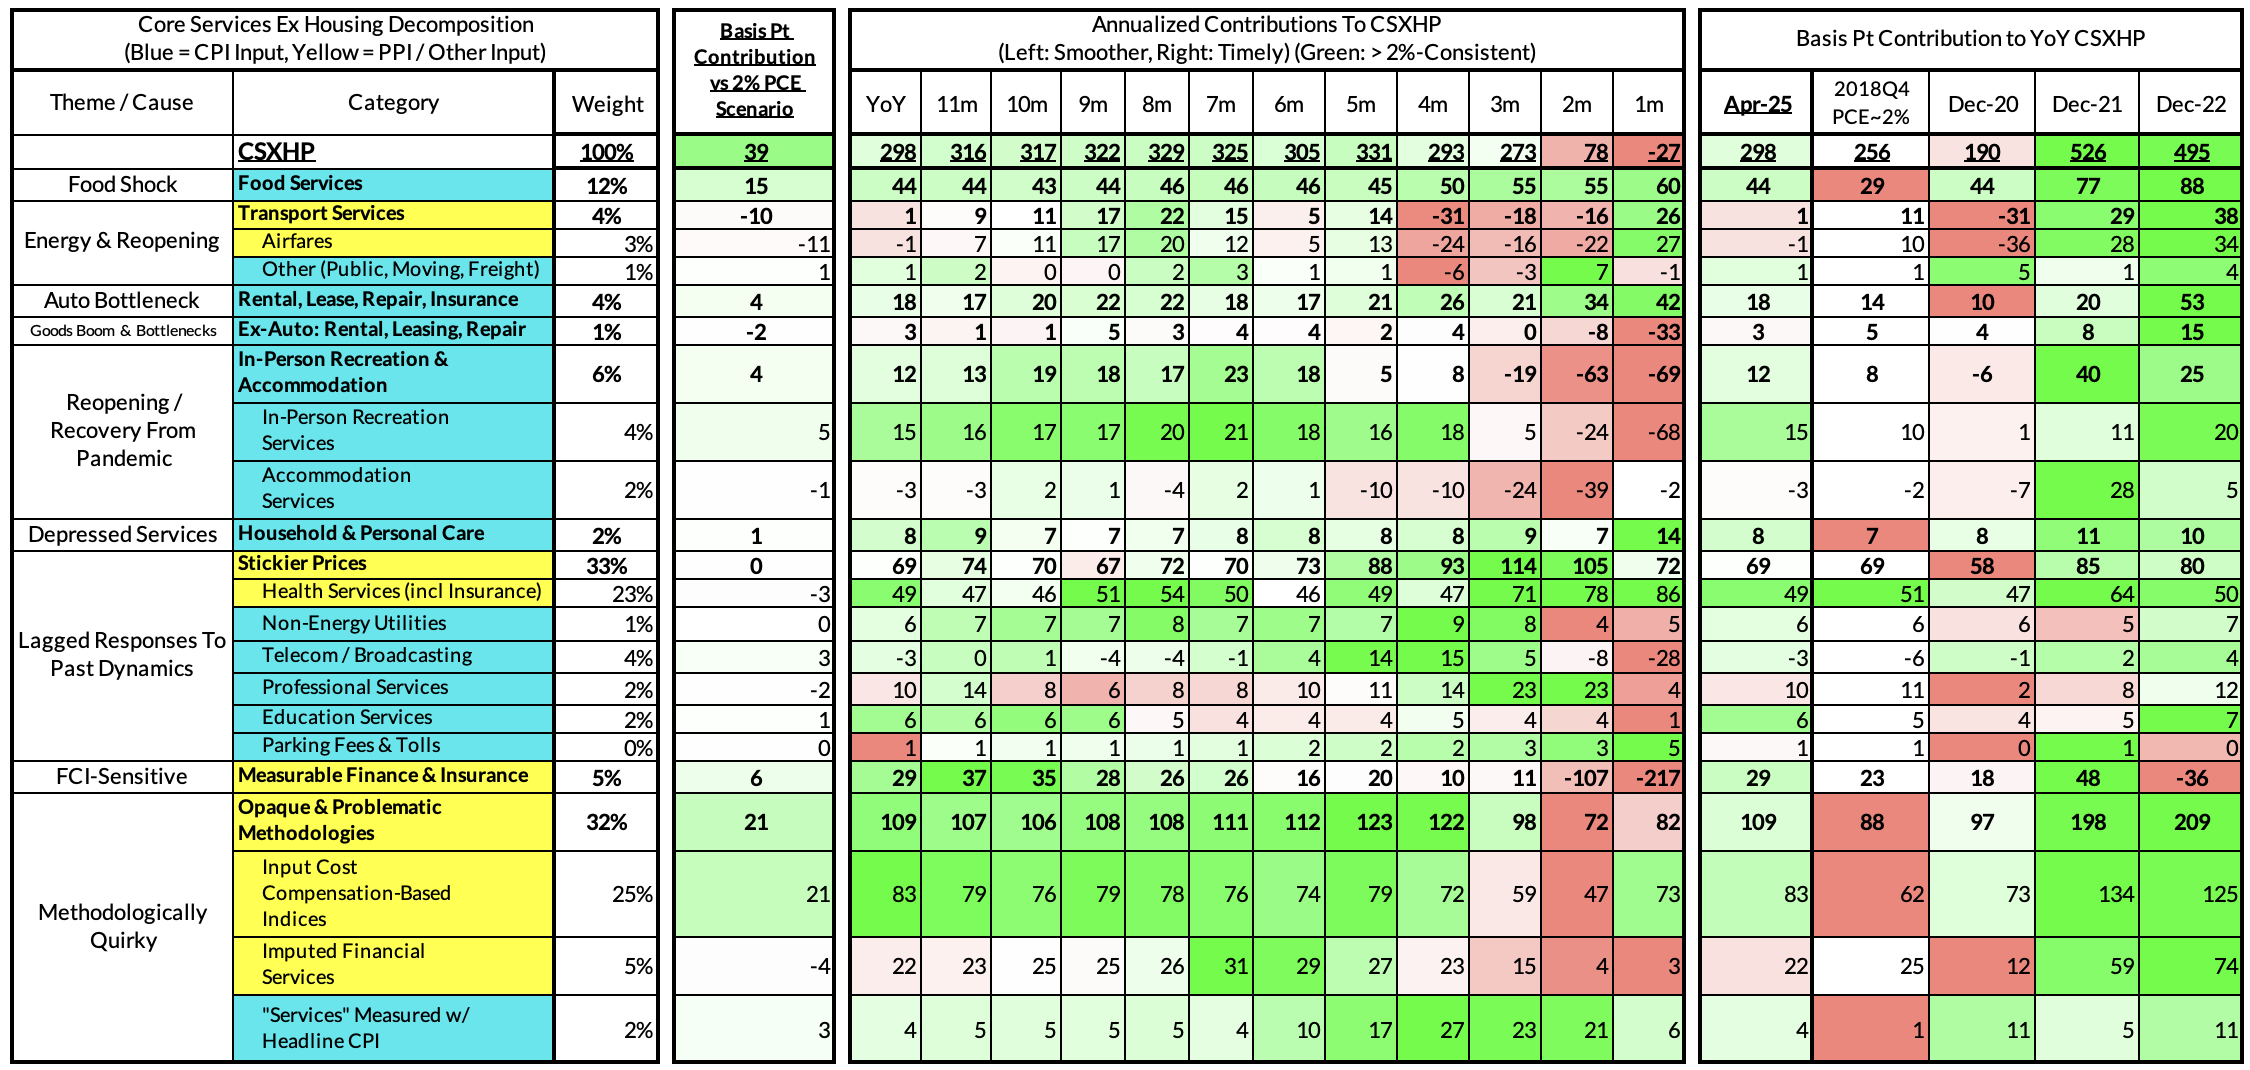
For the Detail-Oriented: Core Services Ex Housing PCE Heatmaps
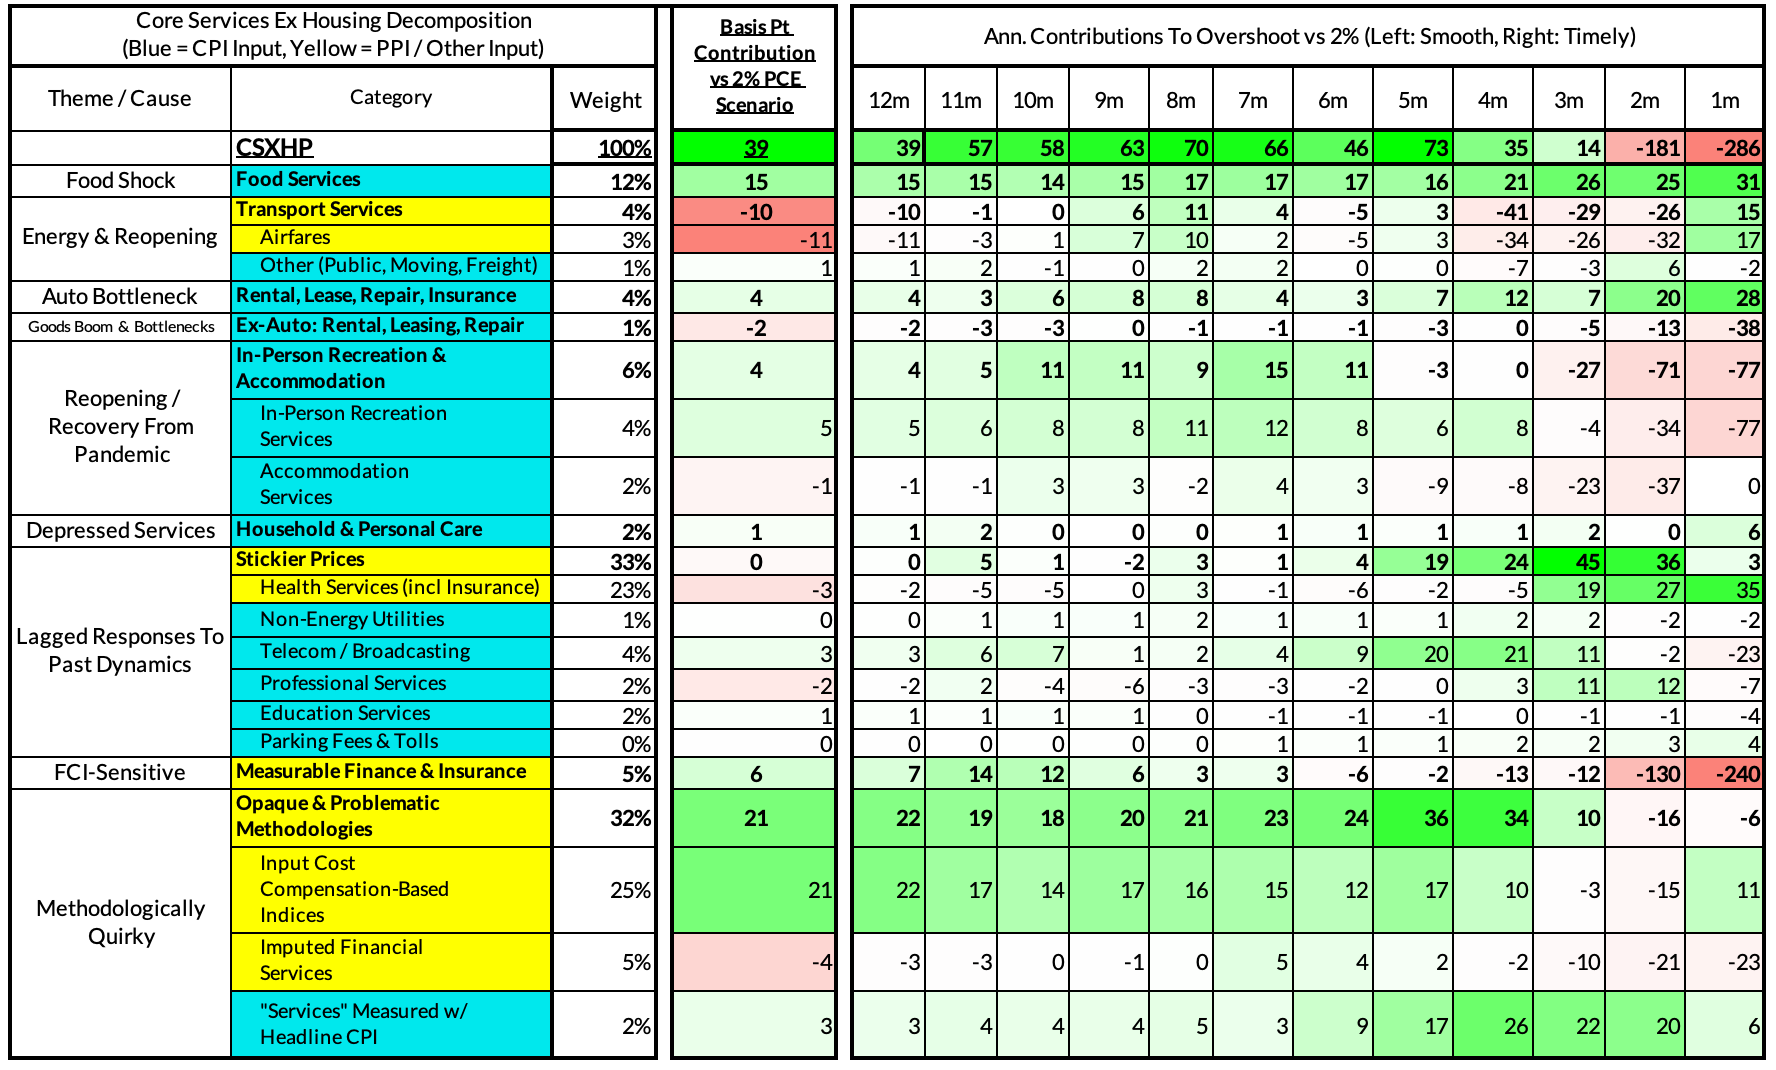
The April growth rate in "Core Services Ex Housing" ('Supercore') PCE is running at a 2.98% year-over-year pace, a 39 basis point overshoot versus the ~2.59% run rate that coincided with ~2% headline and Core PCE.
April monthly supercore ran at a -0.27% annualized rate, a 286 basis point annualized undershoot of what would be consistent with 2% Headline and Core PCE.
The link has been copied!
Your link has expired. Please request a new one.
Your link has expired. Please request a new one.
Your link has expired. Please request a new one.
Great! You've successfully signed up.
Great! You've successfully signed up.
Welcome back! You've successfully signed in.
Success! You now have access to additional content.