The December PCE release came with very few surprises relative to our models, in what is a confusing schedule of data releases and one-off revisions. Core PCE was 1bp lower on a month-over-month basis for December relative to what we anticipated for this release (0.36% m/m realized vs 0.37% modeled), while the year-over-year reading in December was 1bp higher (3.00% y/y realized vs 2.99% modeled).
Some technical issues make our tables more confusing to read; the modeled estimates for today's release are distinct from our latest real-time tracking for PCE. Usually we receive the official PCE inflation data before the next batch of CPI, but that was not the case this time. January CPI data is already out, and also includes some special information that was not factored into the December PCE release as it pertains to CPI seasonal factor revisions. These seasonal factor revisions are only partially incorporated into PCE in the January release, with the full revisions arriving later this September.
Add it all together and what we see is a 3.1% year-over-year reading for January based on today's data, the effects of seasonal factor revisions on Q4 PCE data, and the January CPI release, which came in strong despite an unsustainably sharp decline in used car prices. These nowcasts are likely tracking marginally hotter than what most FOMC members and the Fed staff were tracking at the very beginning of the year.
Following the administration's response to today's Supreme Court ruling, we would be surprised to see today's effective decline in tariff rates to reflect a new policy equilibrium. Firms are likely in wait-and-see mode until the policy response becomes clearer. As a result, the lags from tariff passthrough to consumer prices are likely to be especially elongated.
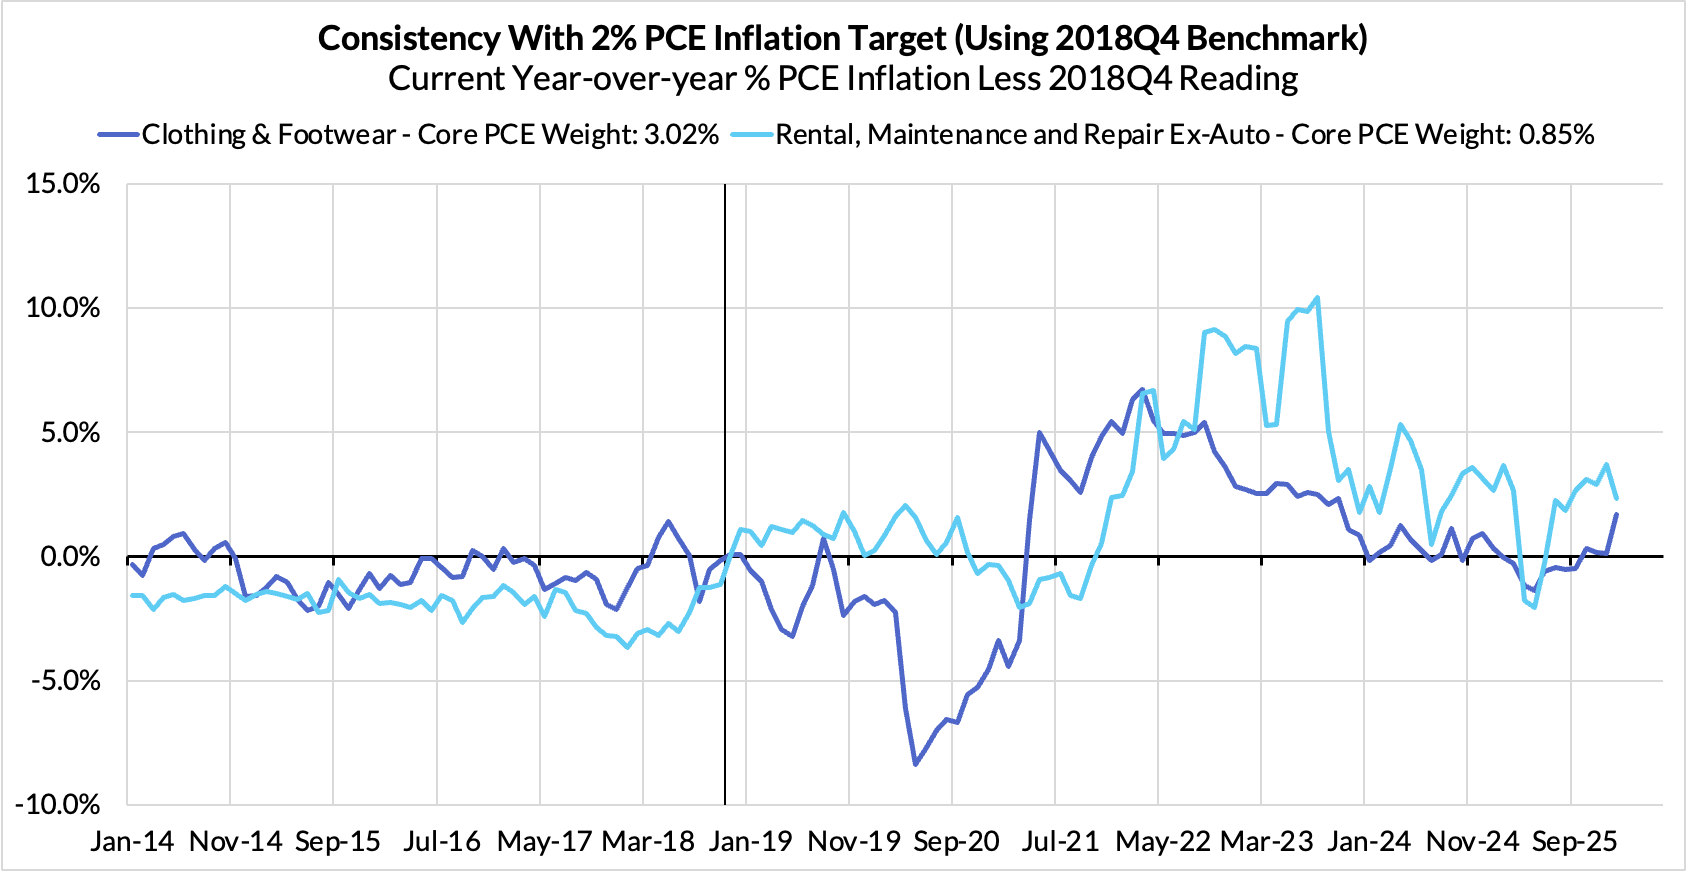
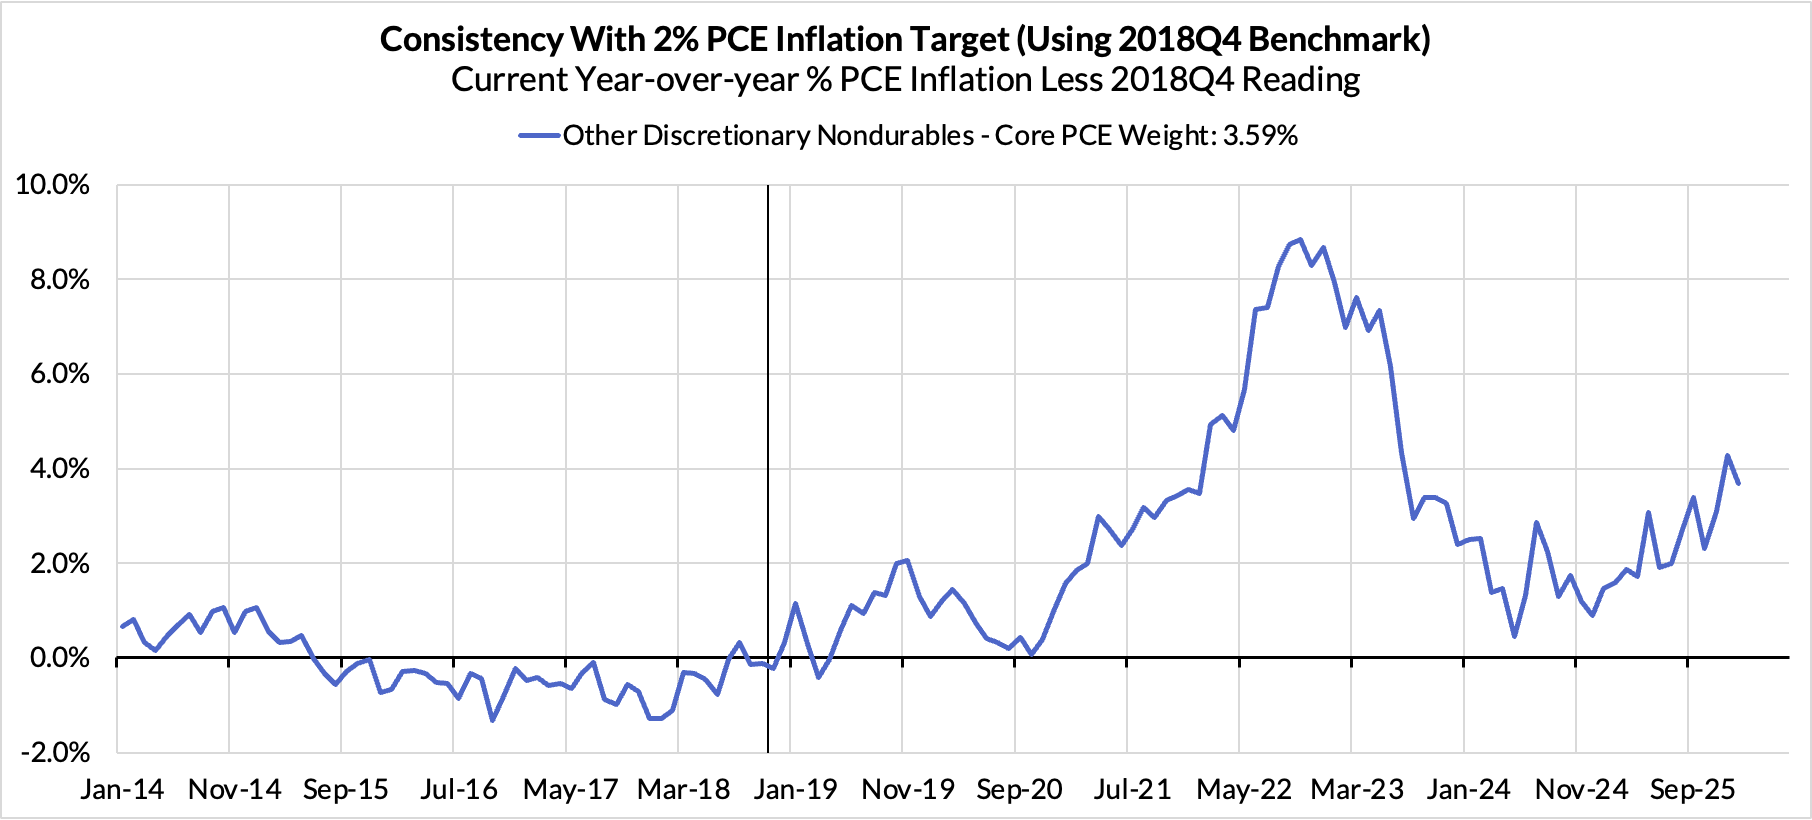
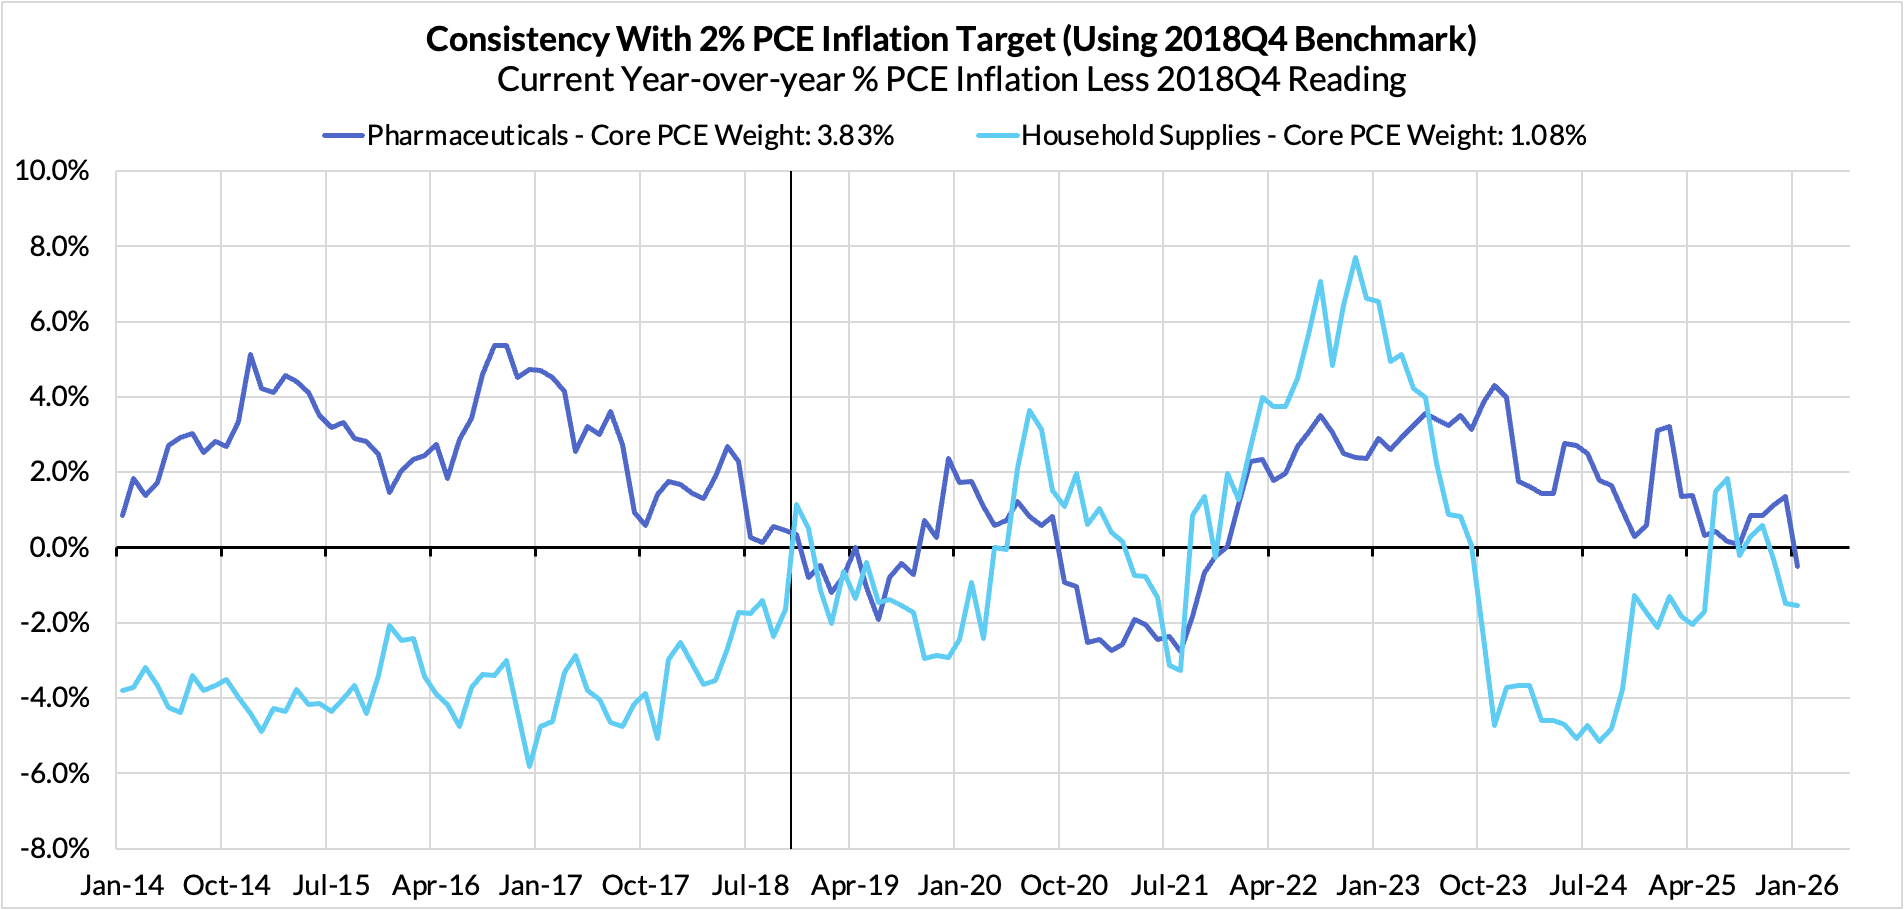
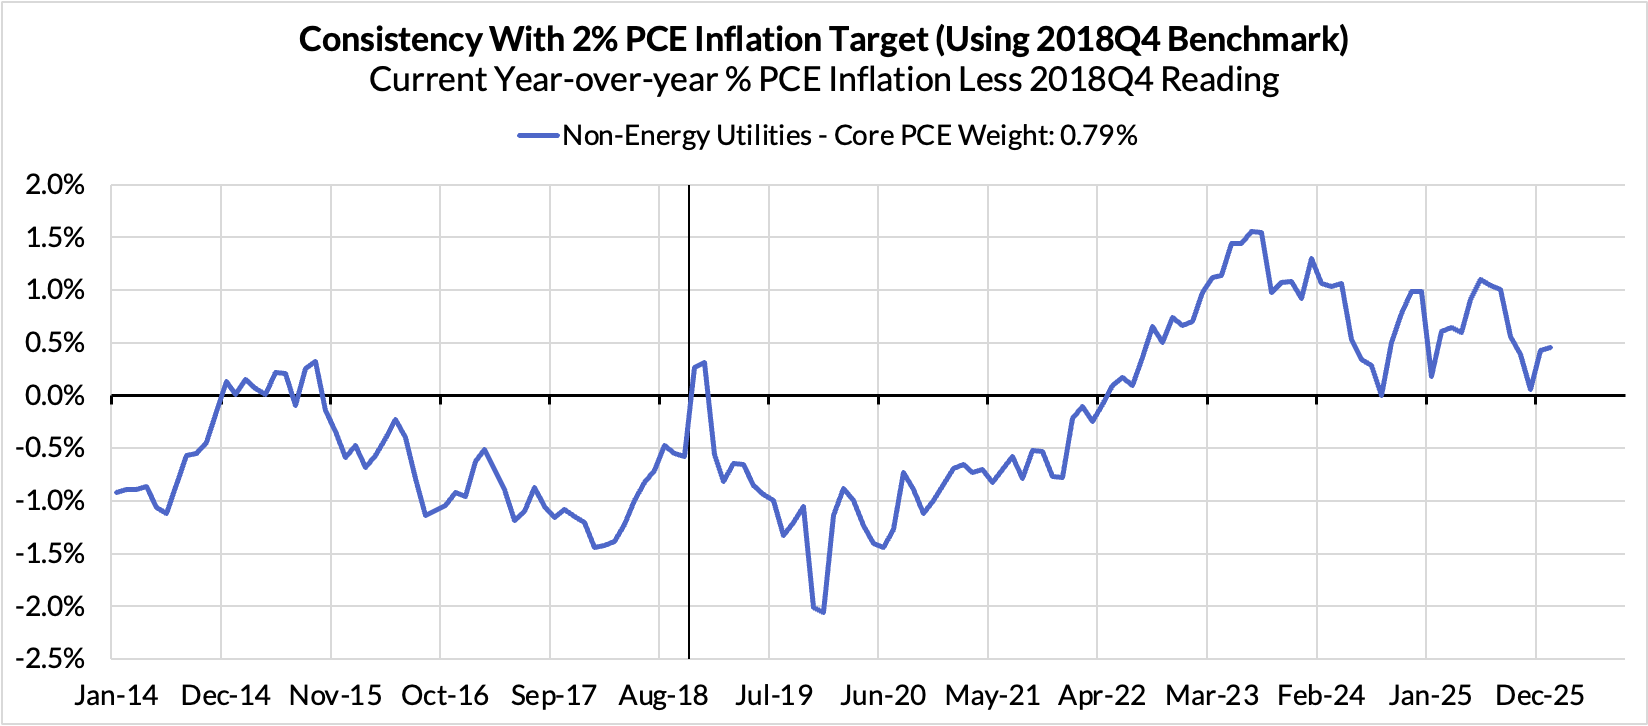
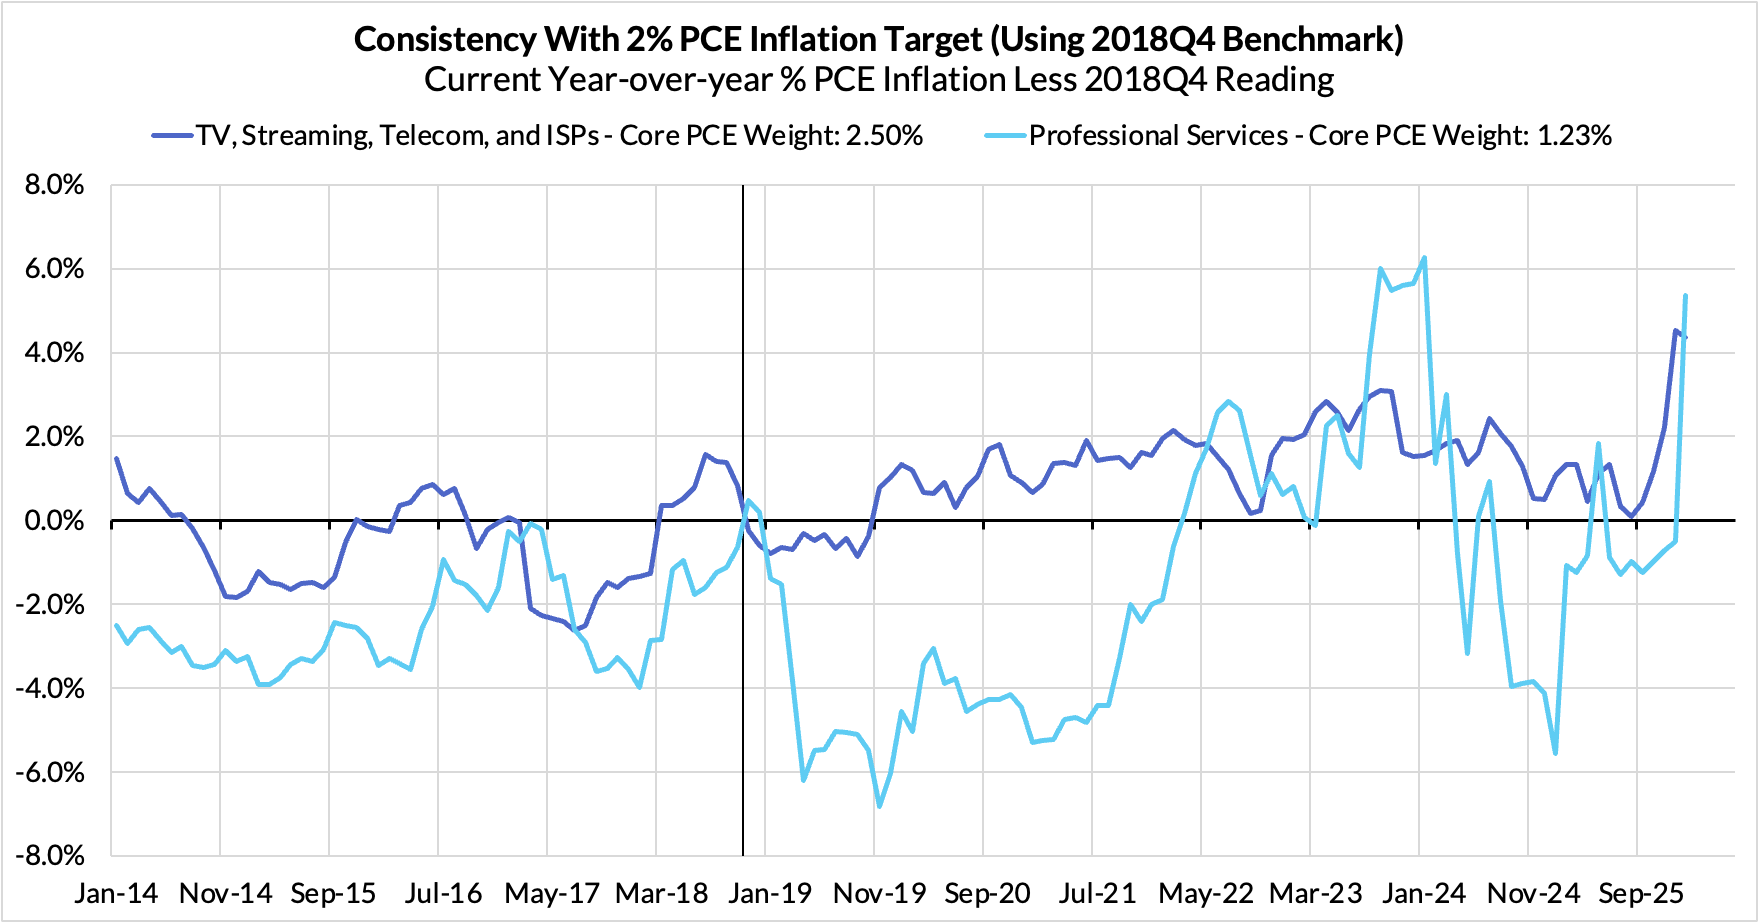
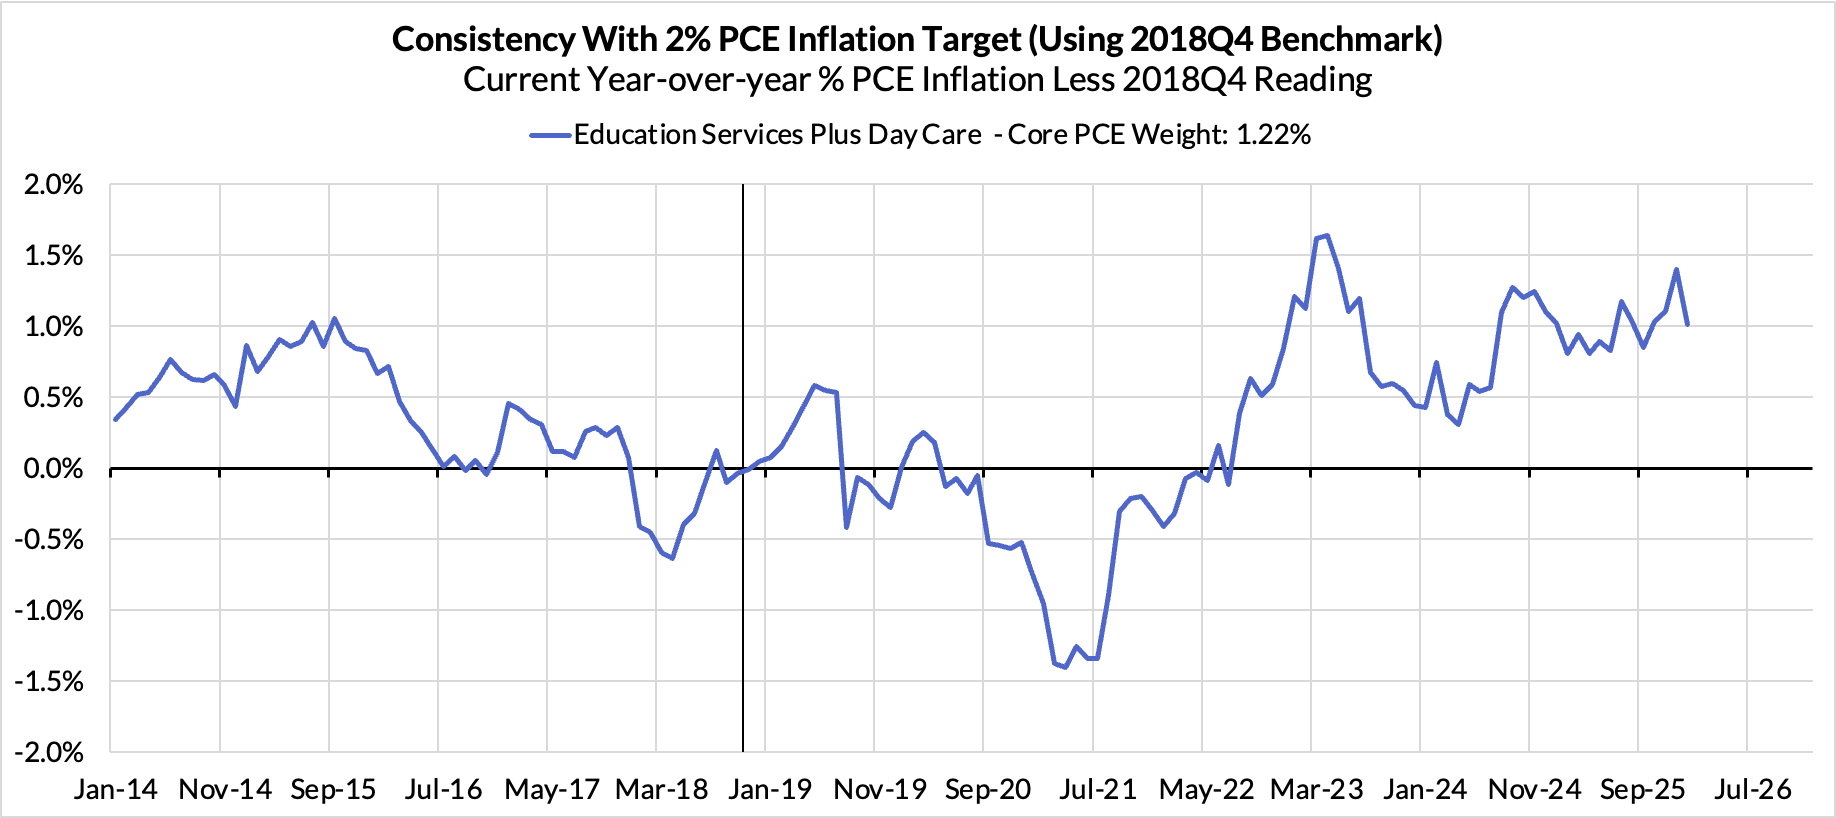
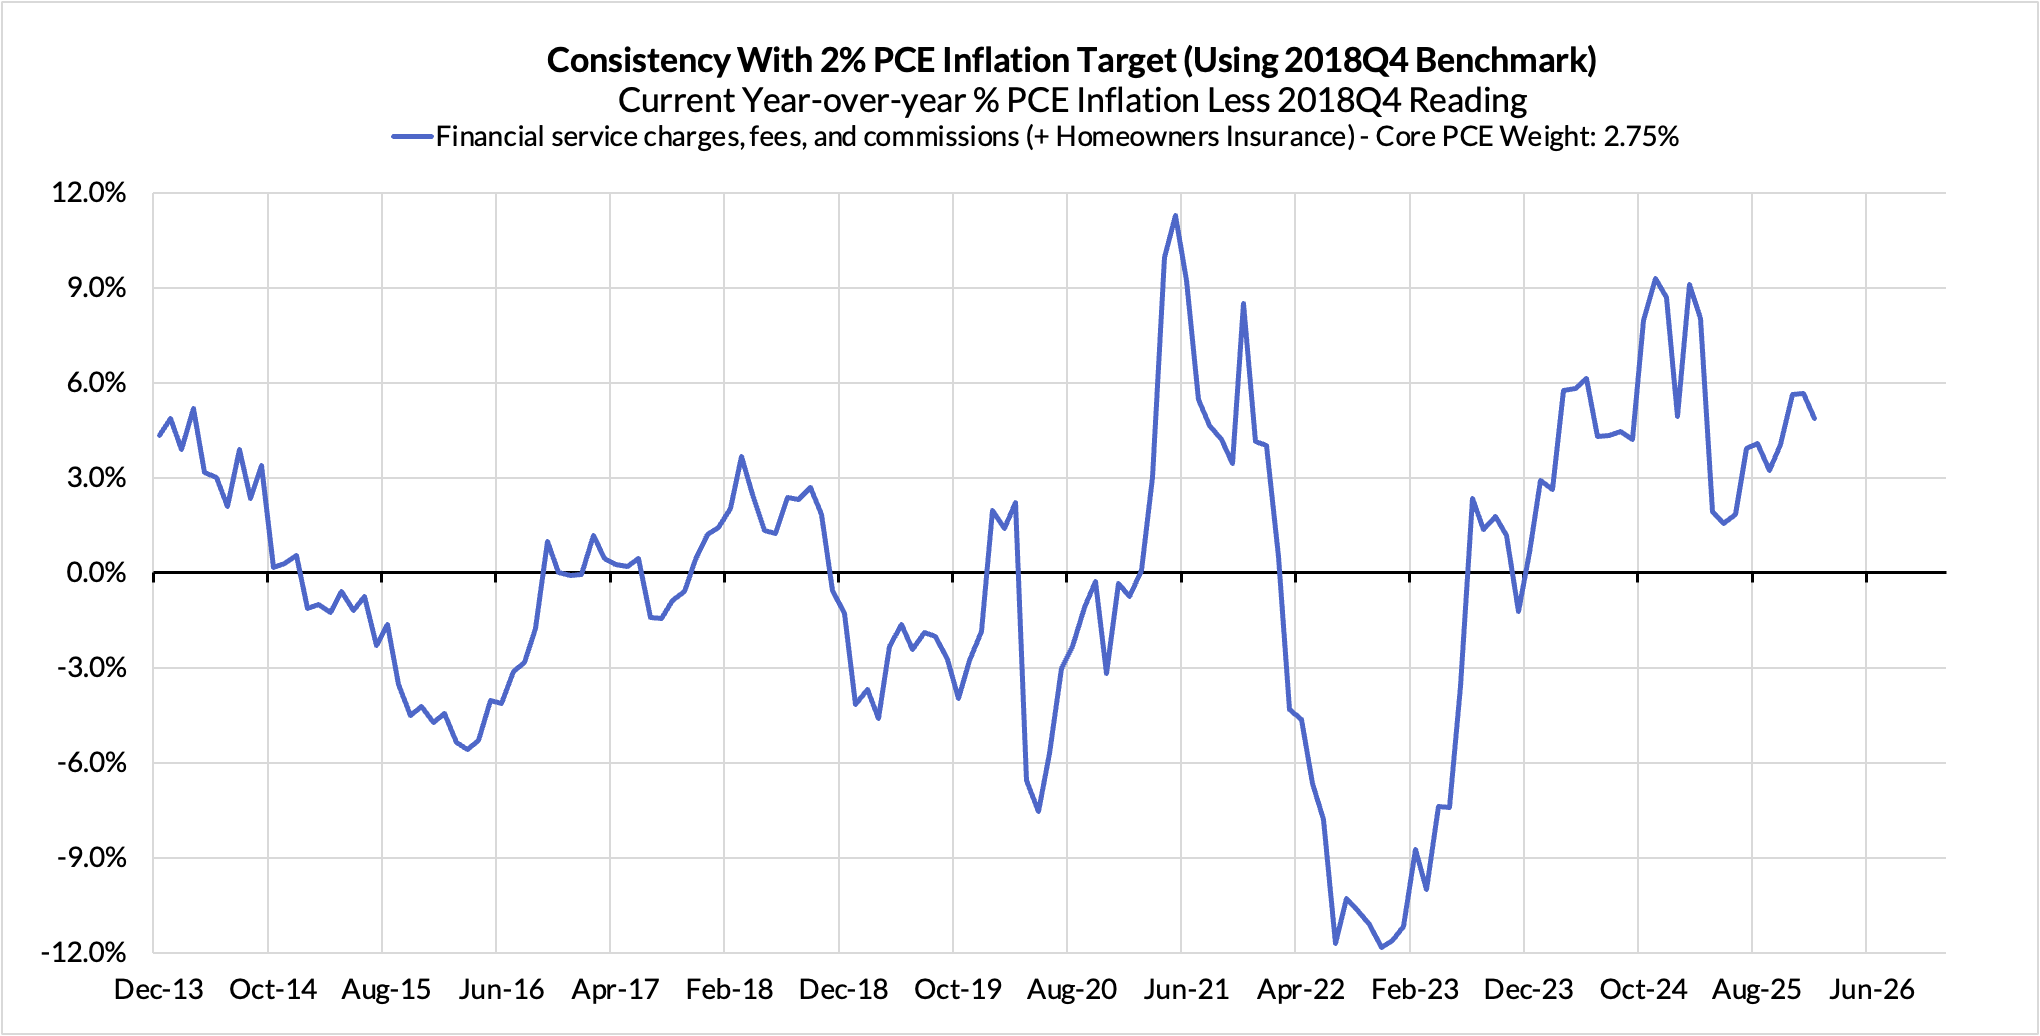
Inflation Overshoots At The Component Level (Updated Through January Nowcasts + Revisions)
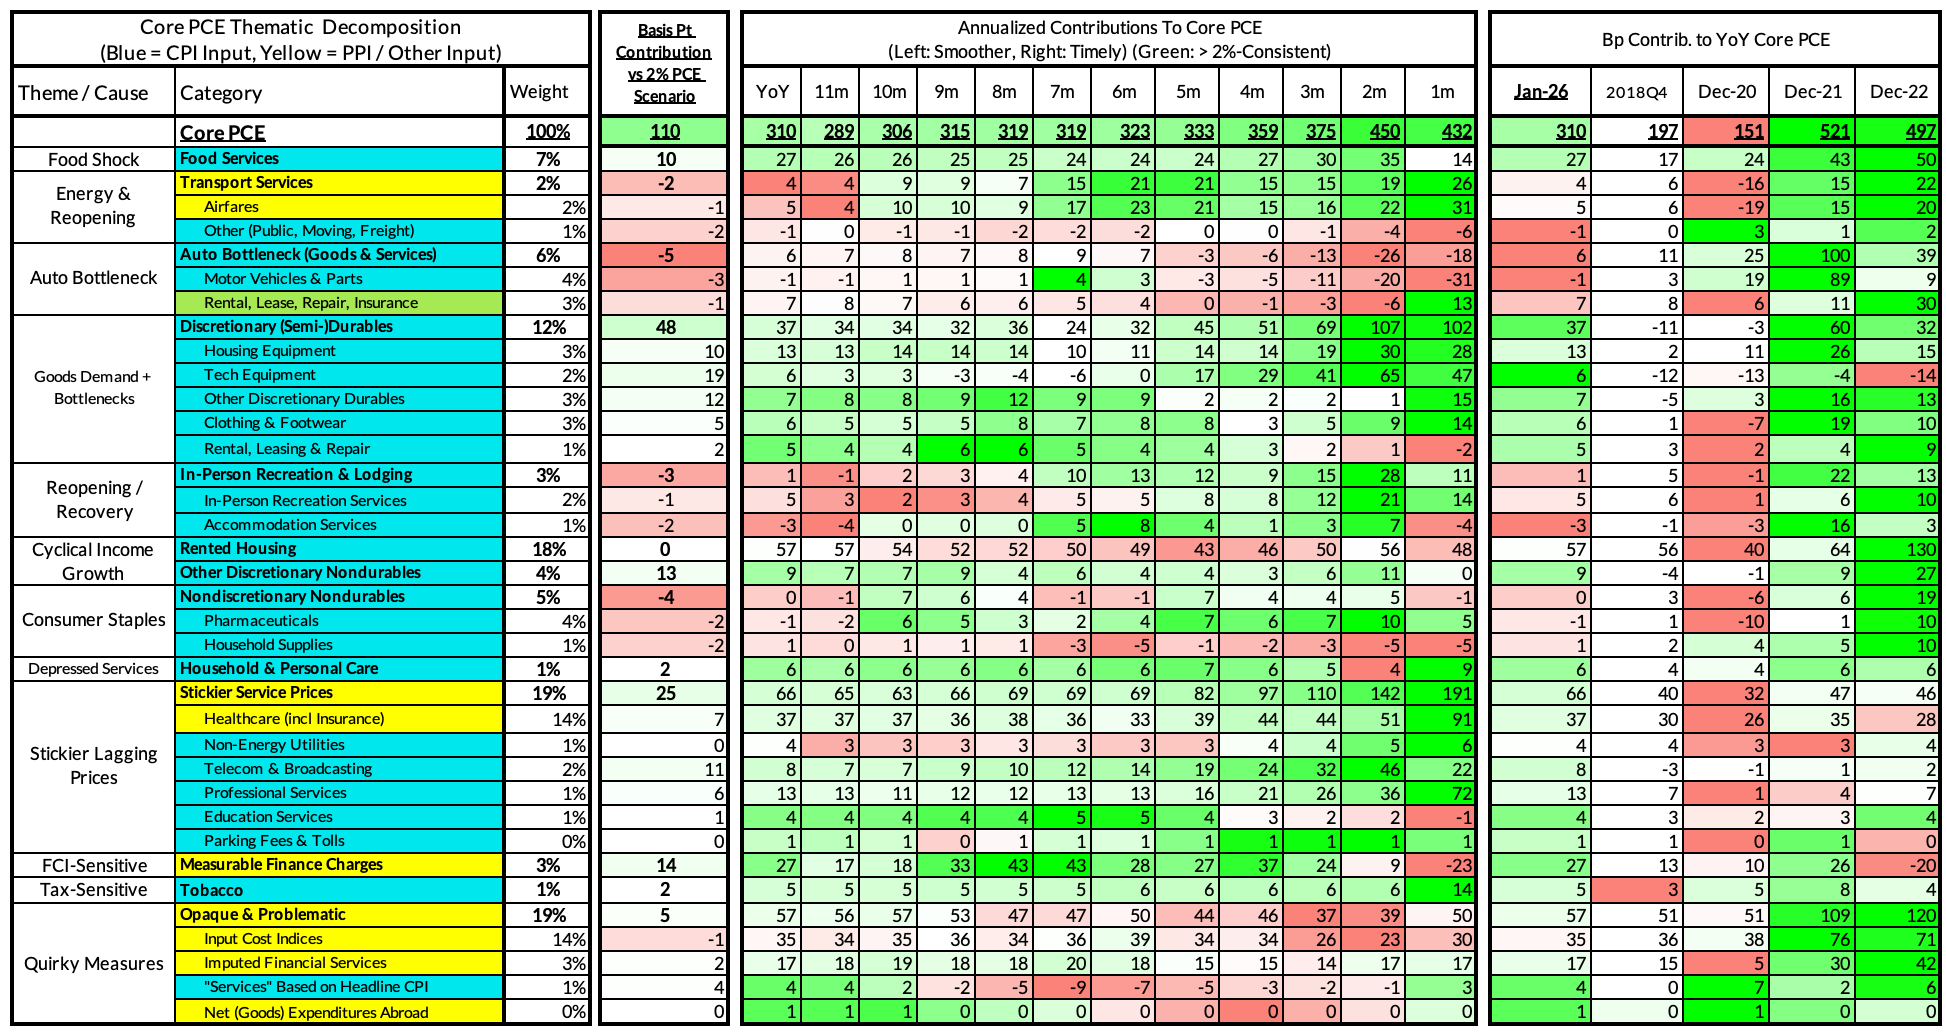
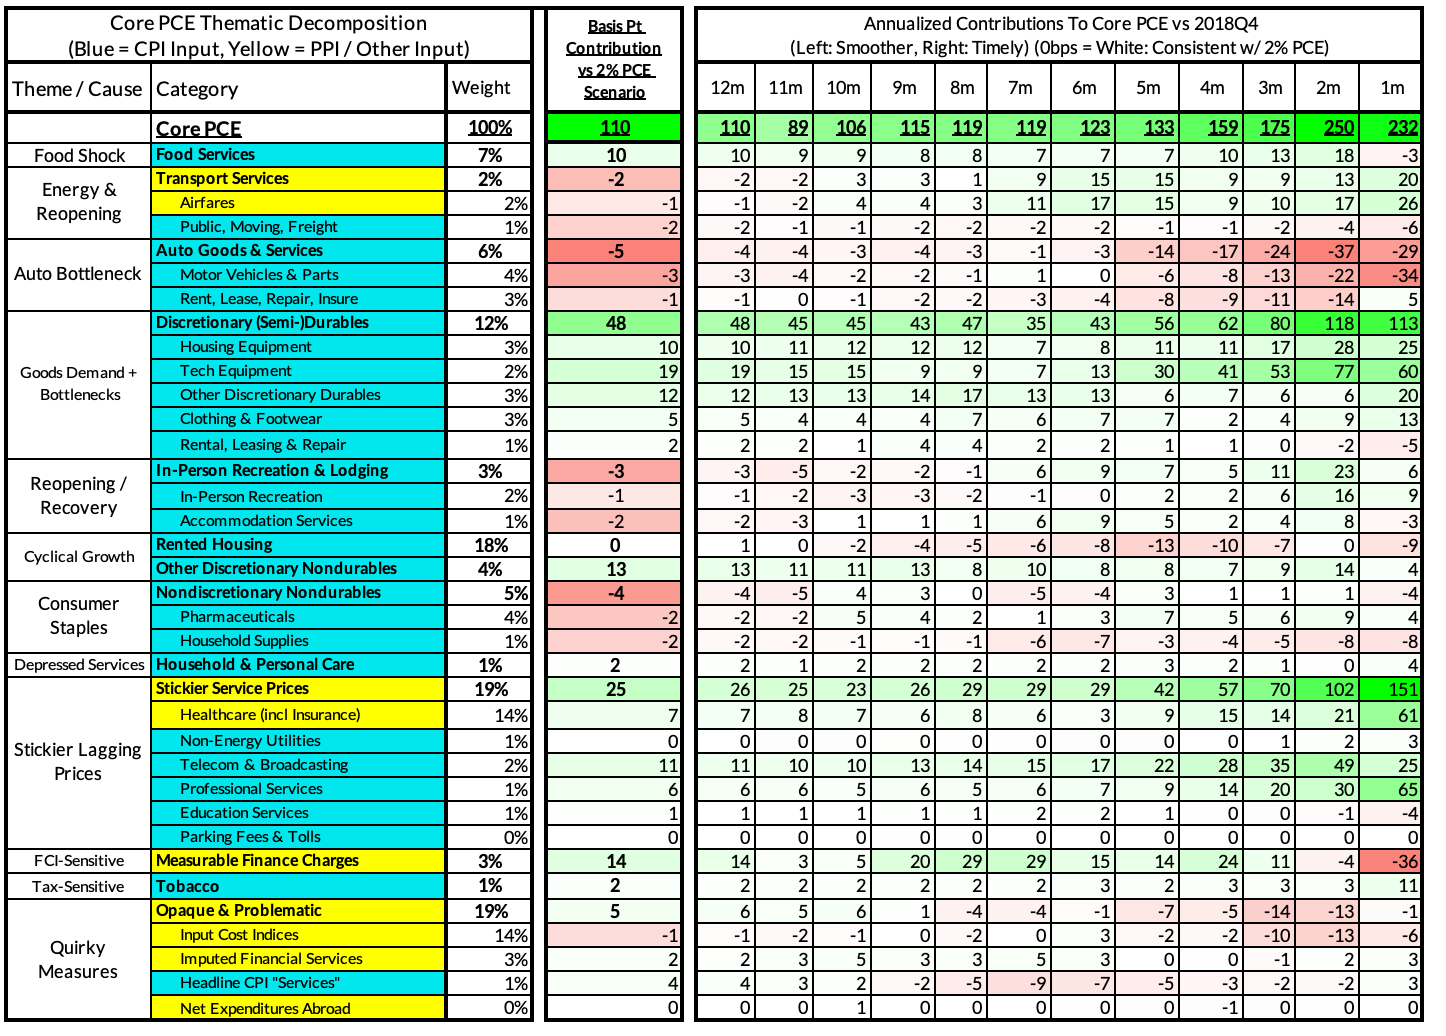
For the Detail-Oriented: Core PCE Heatmaps
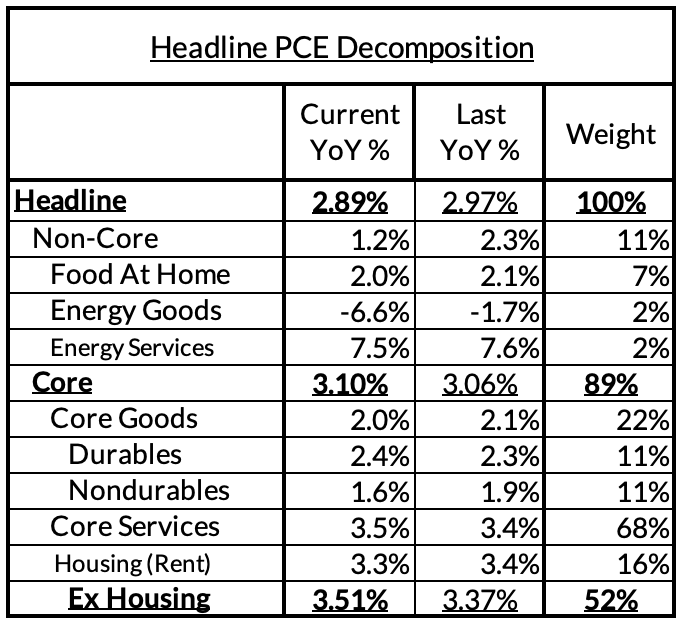
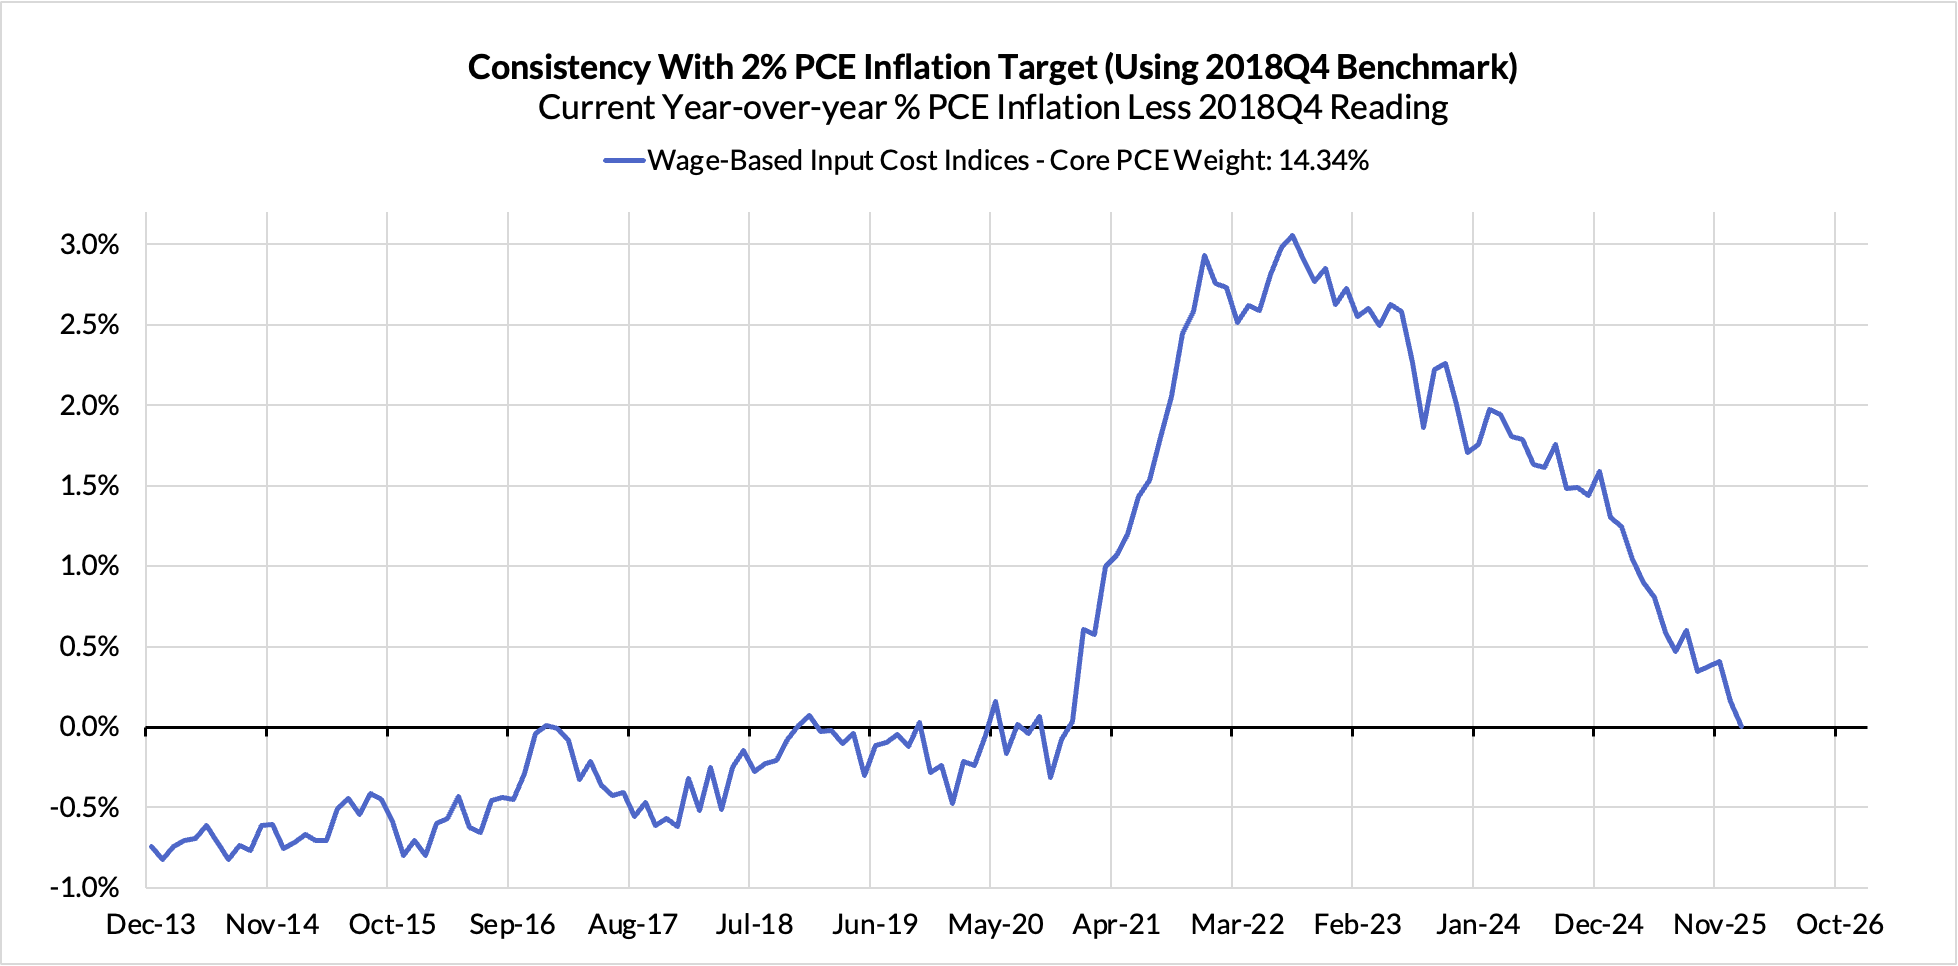
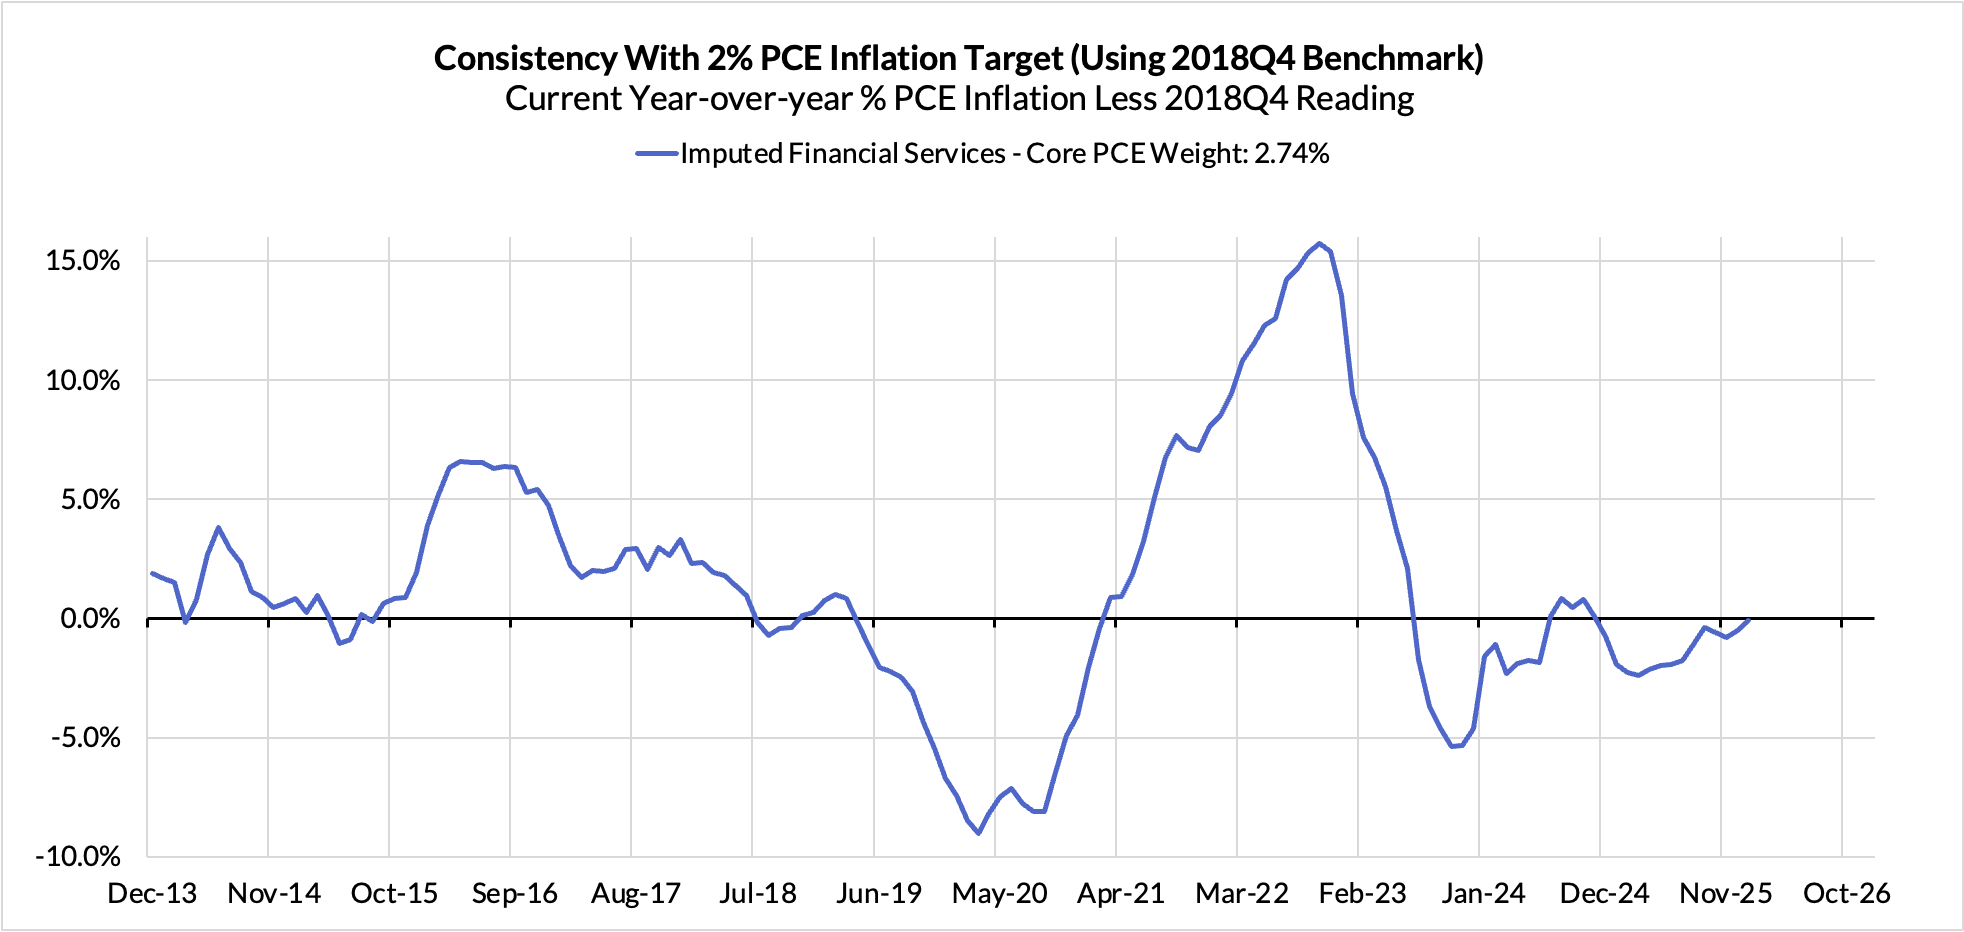
Right now Core PCE (PCE less food products and energy) is on track to run at a 3.10% year-over-year pace as of January, 110 basis points above the Fed's 2% inflation target for PCE. This data will change as we get more January inflation inputs.
Equity market effects are adding 14 basis points to the overshoot.
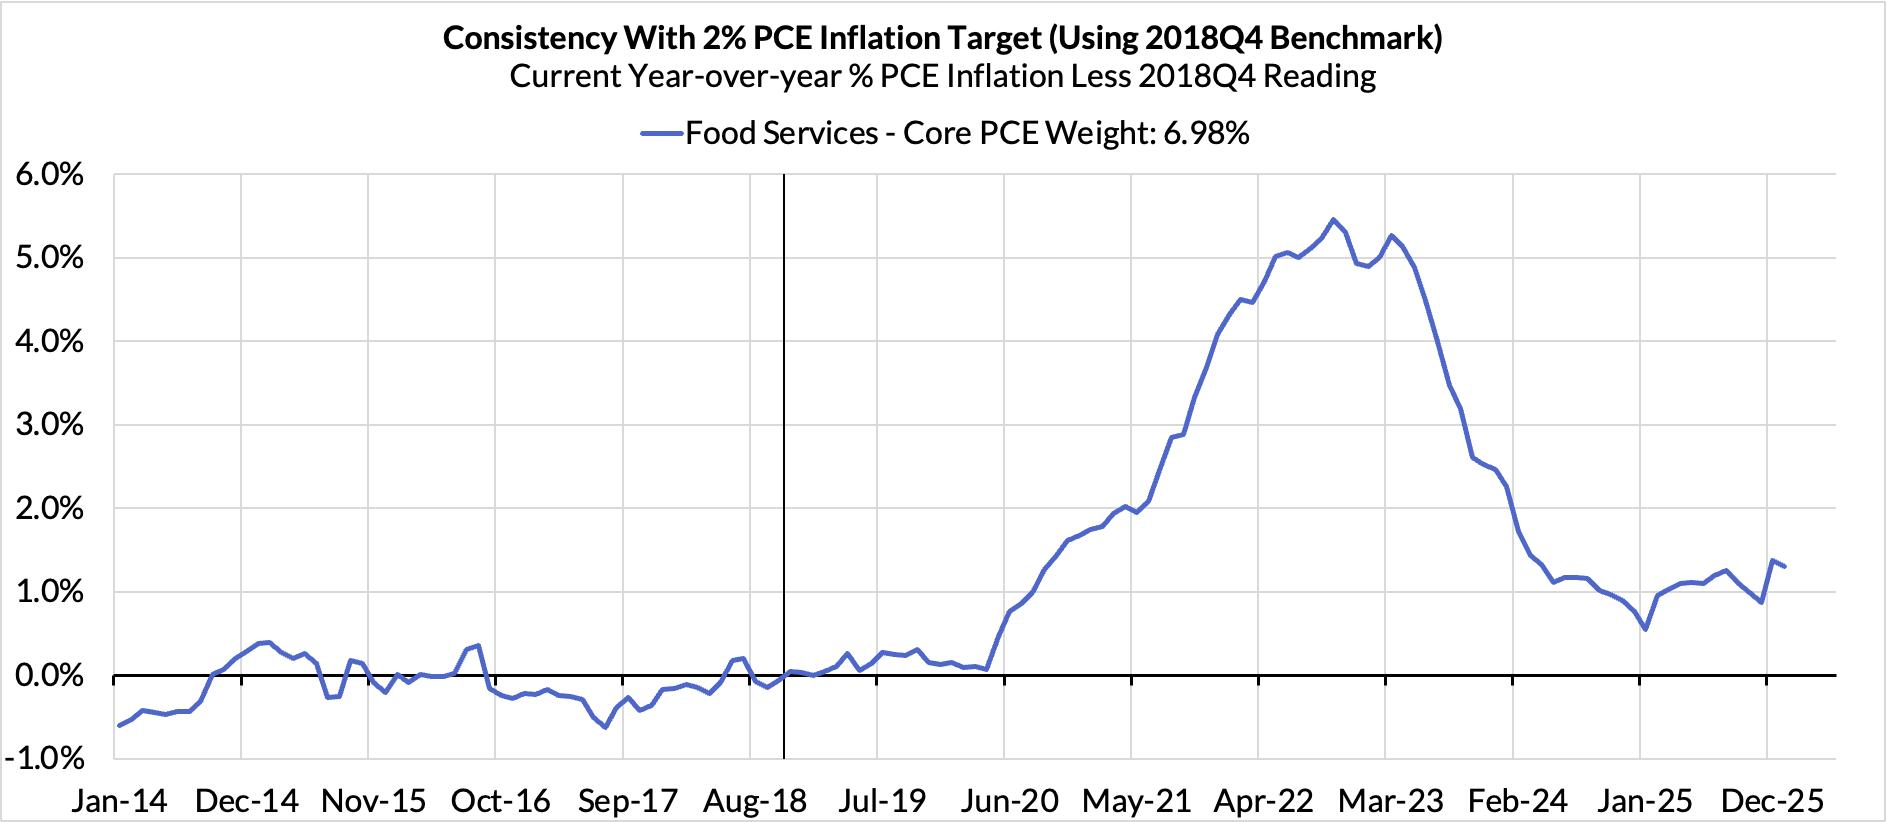
Food inputs likely adding 10 basis points to the overshoot.
Telecommunications and broadcasting are adding 11 basis points
The final heatmap below gives you a sense of the overshoot on shorter annualized run-rates. January monthly annualized Core PCE is on track to run at a 4.32% annualized pace, a 232 basis point overshoot vs 2% target inflation. These estimates are subject to some revision as more data gets released (PPI, IPI, GDP, PCE).
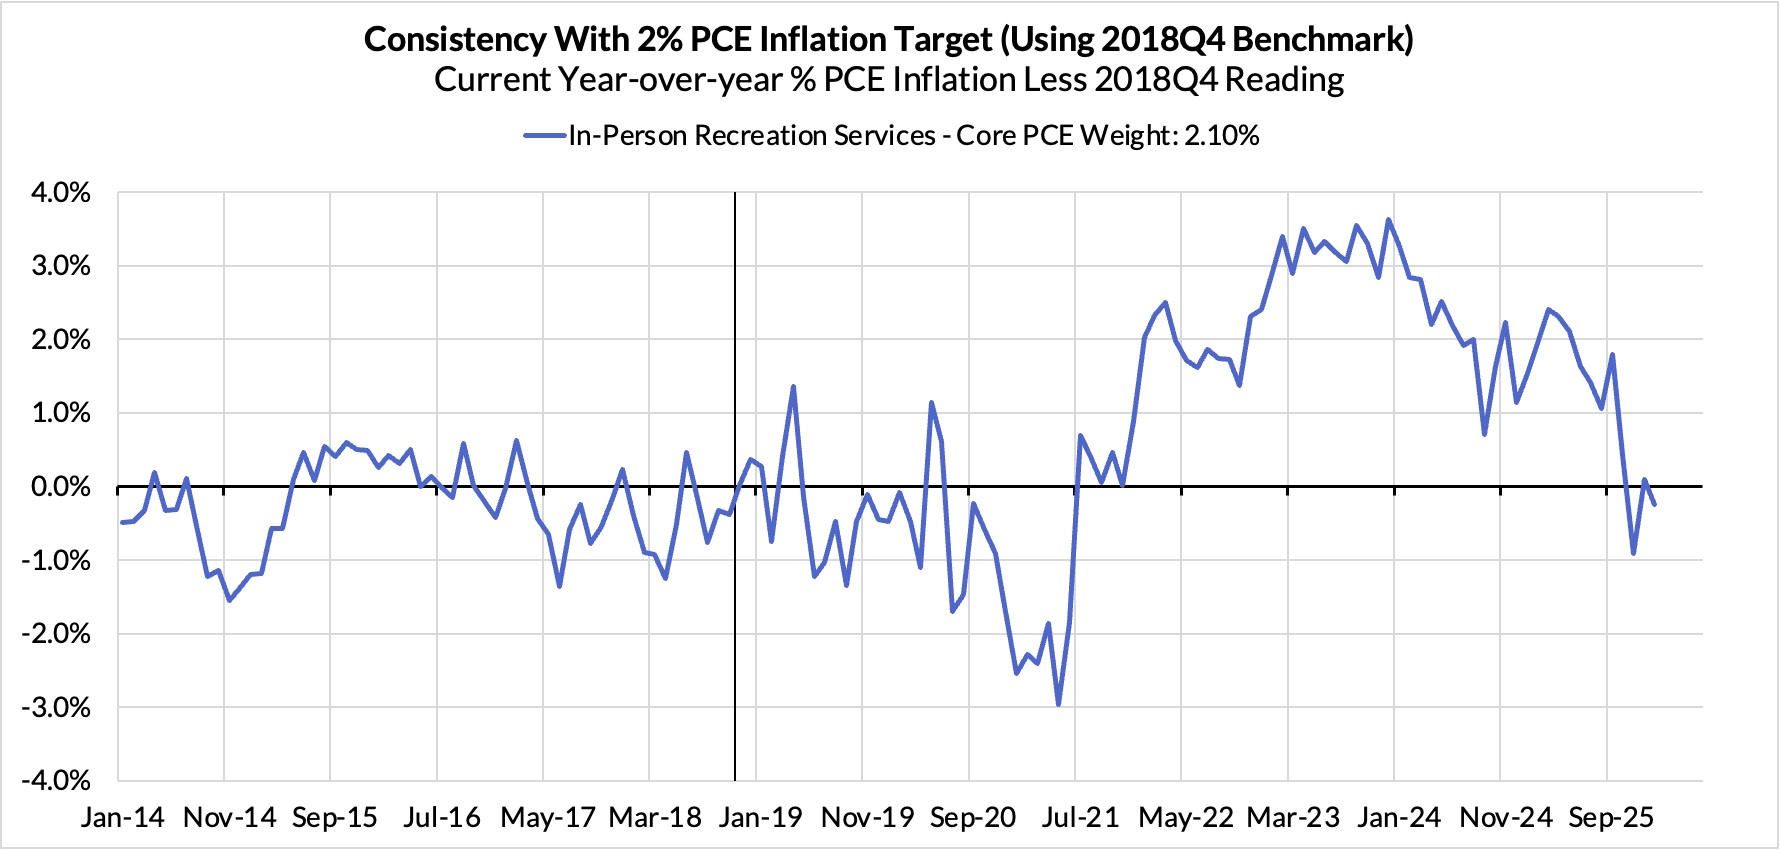
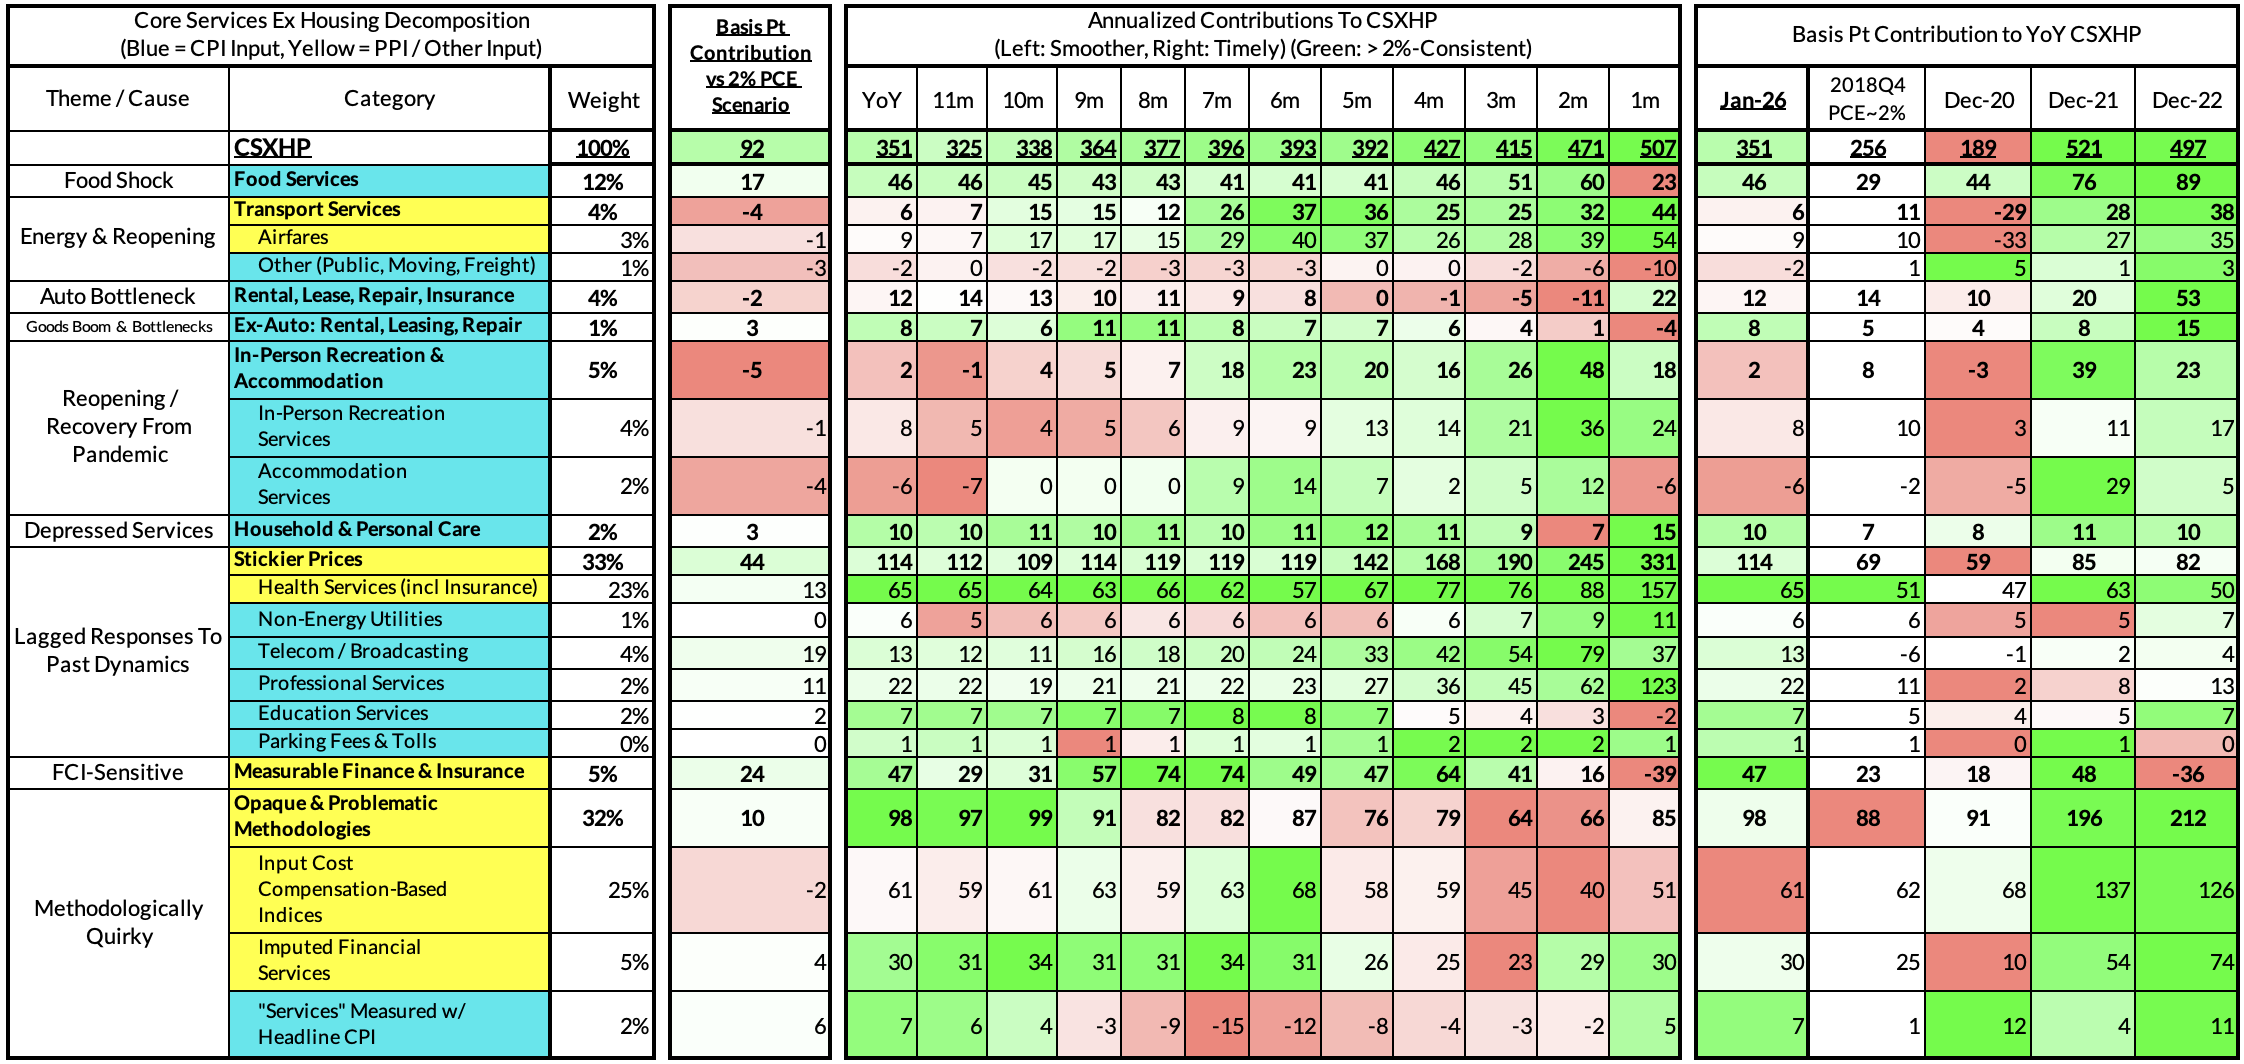
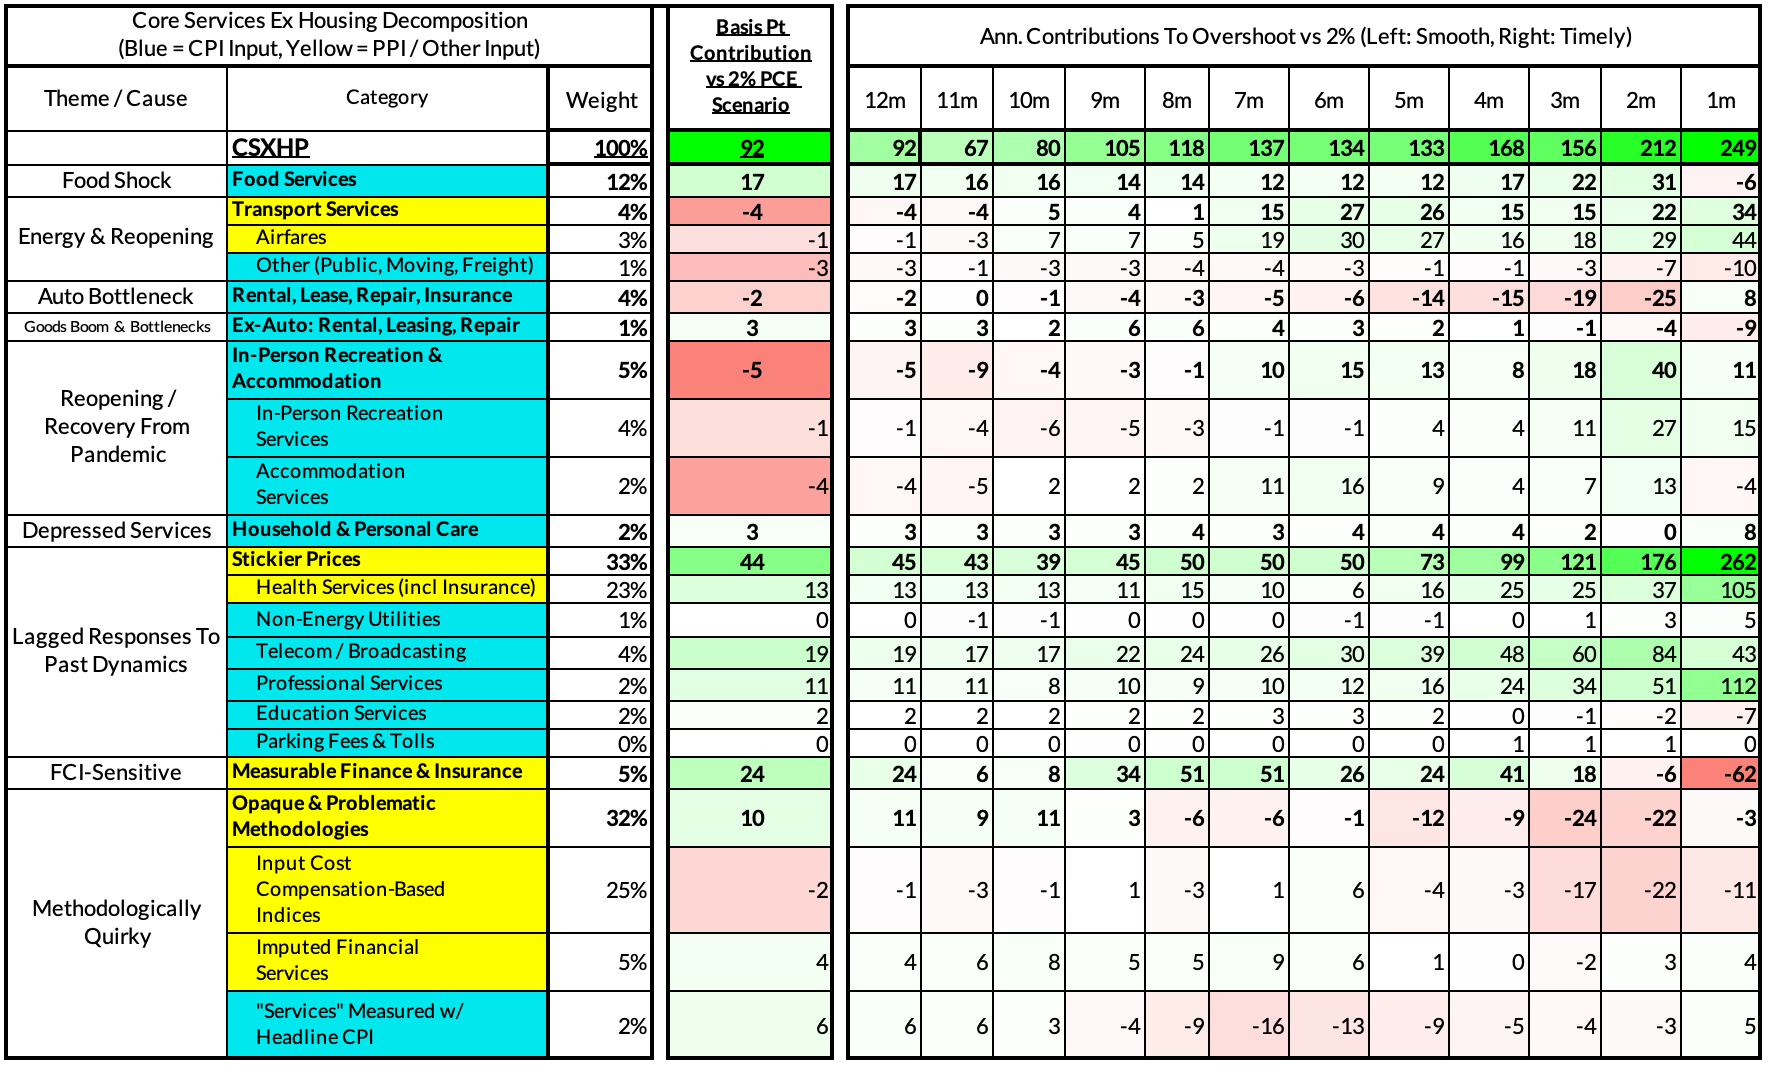
For the Detail-Oriented: Core Services Ex Housing PCE Heatmaps
The January growth rate in "Core Services Ex Housing" ('Supercore') PCE is on track to run at a 3.51% year-over-year pace, a 92 basis point overshoot versus the ~2.59% run rate that coincided with ~2% Headline and Core PCE inflation.
The January monthly supercore is on track to run at a 5.07% annualized rate, a 249 basis point annualized overshoot of what would be consistent with 2% Headline and Core PCE. These estimates are subject to some revision as more data gets released (PPI, IPI, GDP, PCE).
The link has been copied!
Your link has expired. Please request a new one.
Your link has expired. Please request a new one.
Your link has expired. Please request a new one.
Great! You've successfully signed up.
Great! You've successfully signed up.
Welcome back! You've successfully signed in.
Success! You now have access to additional content.