Core-Cast is our model and publication series for nowcasting the Fed's Personal Consumption Expenditures (PCE) inflation gauges. We update our estimates from CPI, PPI, Import Price, and GDP data, along with previews and final recaps. If you'd like to become a MacroSuite subscriber to get all of our model updates before PCE is released, you can do so usingthis link. If you have any questions or would like to see samples of our past content, contact us here.
Summary: PCE Nowcasts
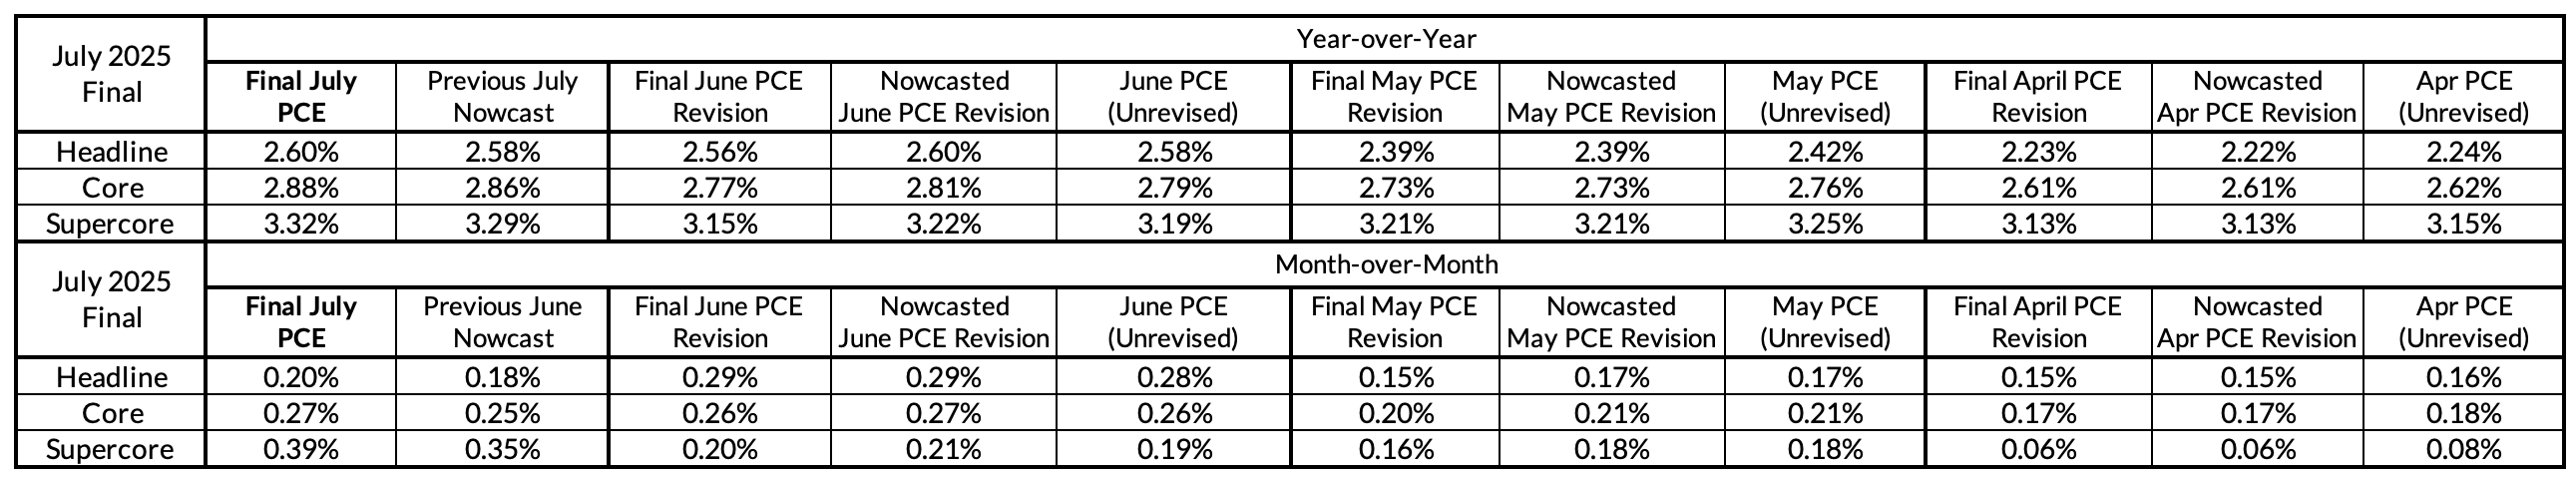
Our nowcasts fared well yet again this month (off by 2bps), though this time the final outcome was right between our pre-GDP and post-GDP estimates. Core PCE is right around 2.9% now on a year-over-year basis and would need to average less than 28bps on a m/m basis until year-end to avoid exceeding the Fed's current projections. That should be doable but given a .27% m/m reading in July, it's simply too soon to say.
Discussion
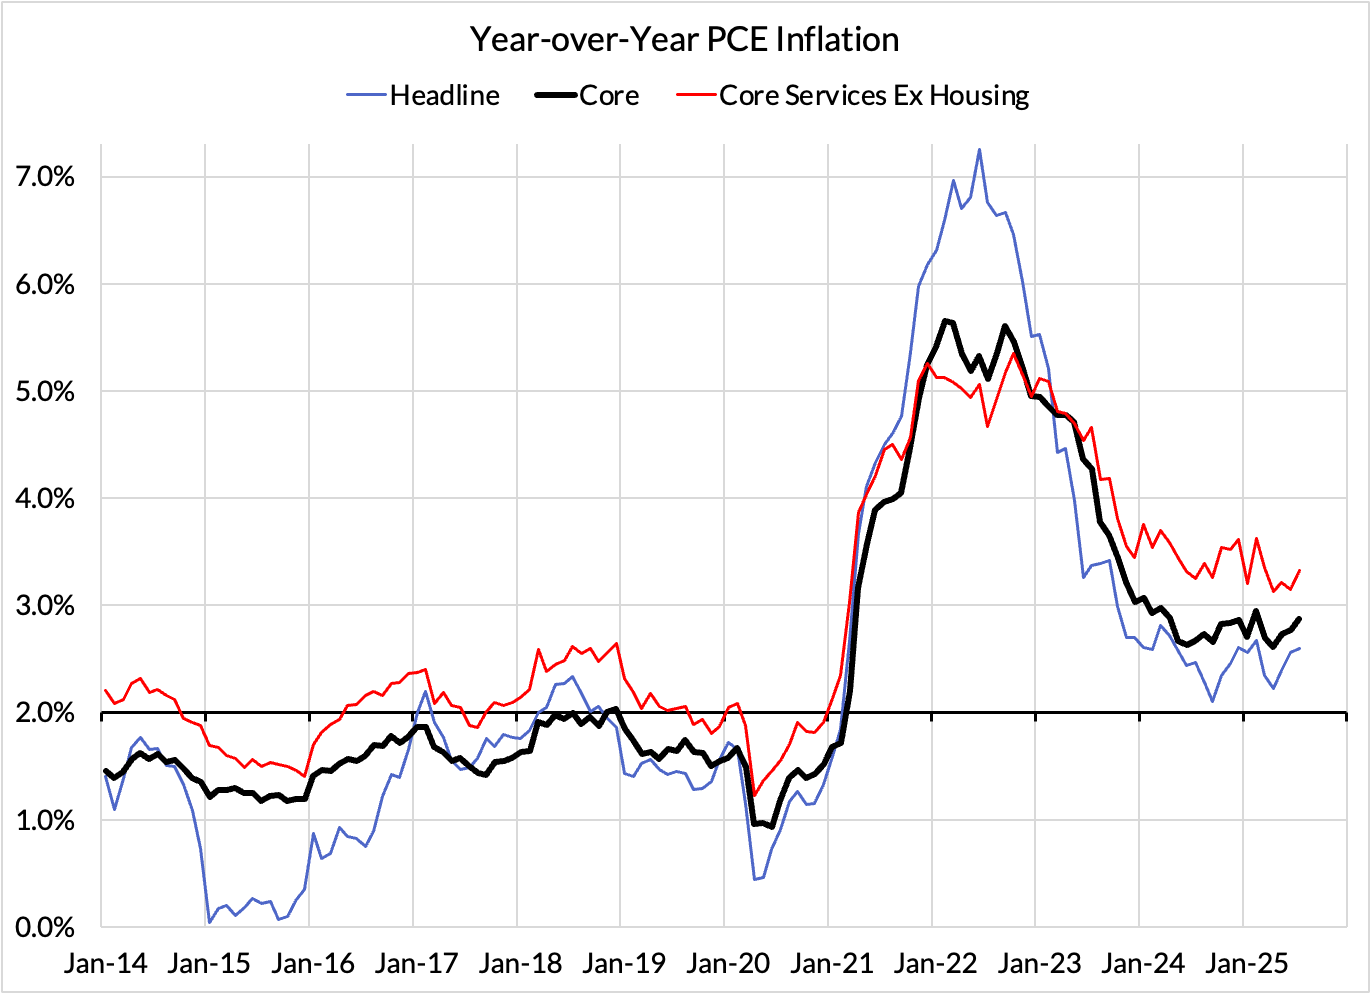
Inflation appears to be headed in the wrong direction. Back when the Fed first began cutting in September 2024, they were seeing a Headline PCE inflation rate of 2.27% y/y and a Core PCE inflation rate of 2.71% y/y. Those gauges are now .3% and .2% higher respectively. This should not be happening given the favorable lags coming into the year from housing, financial services, and input cost components to PCE, which were all running hotter but poised to cool (and have in fact cooled).
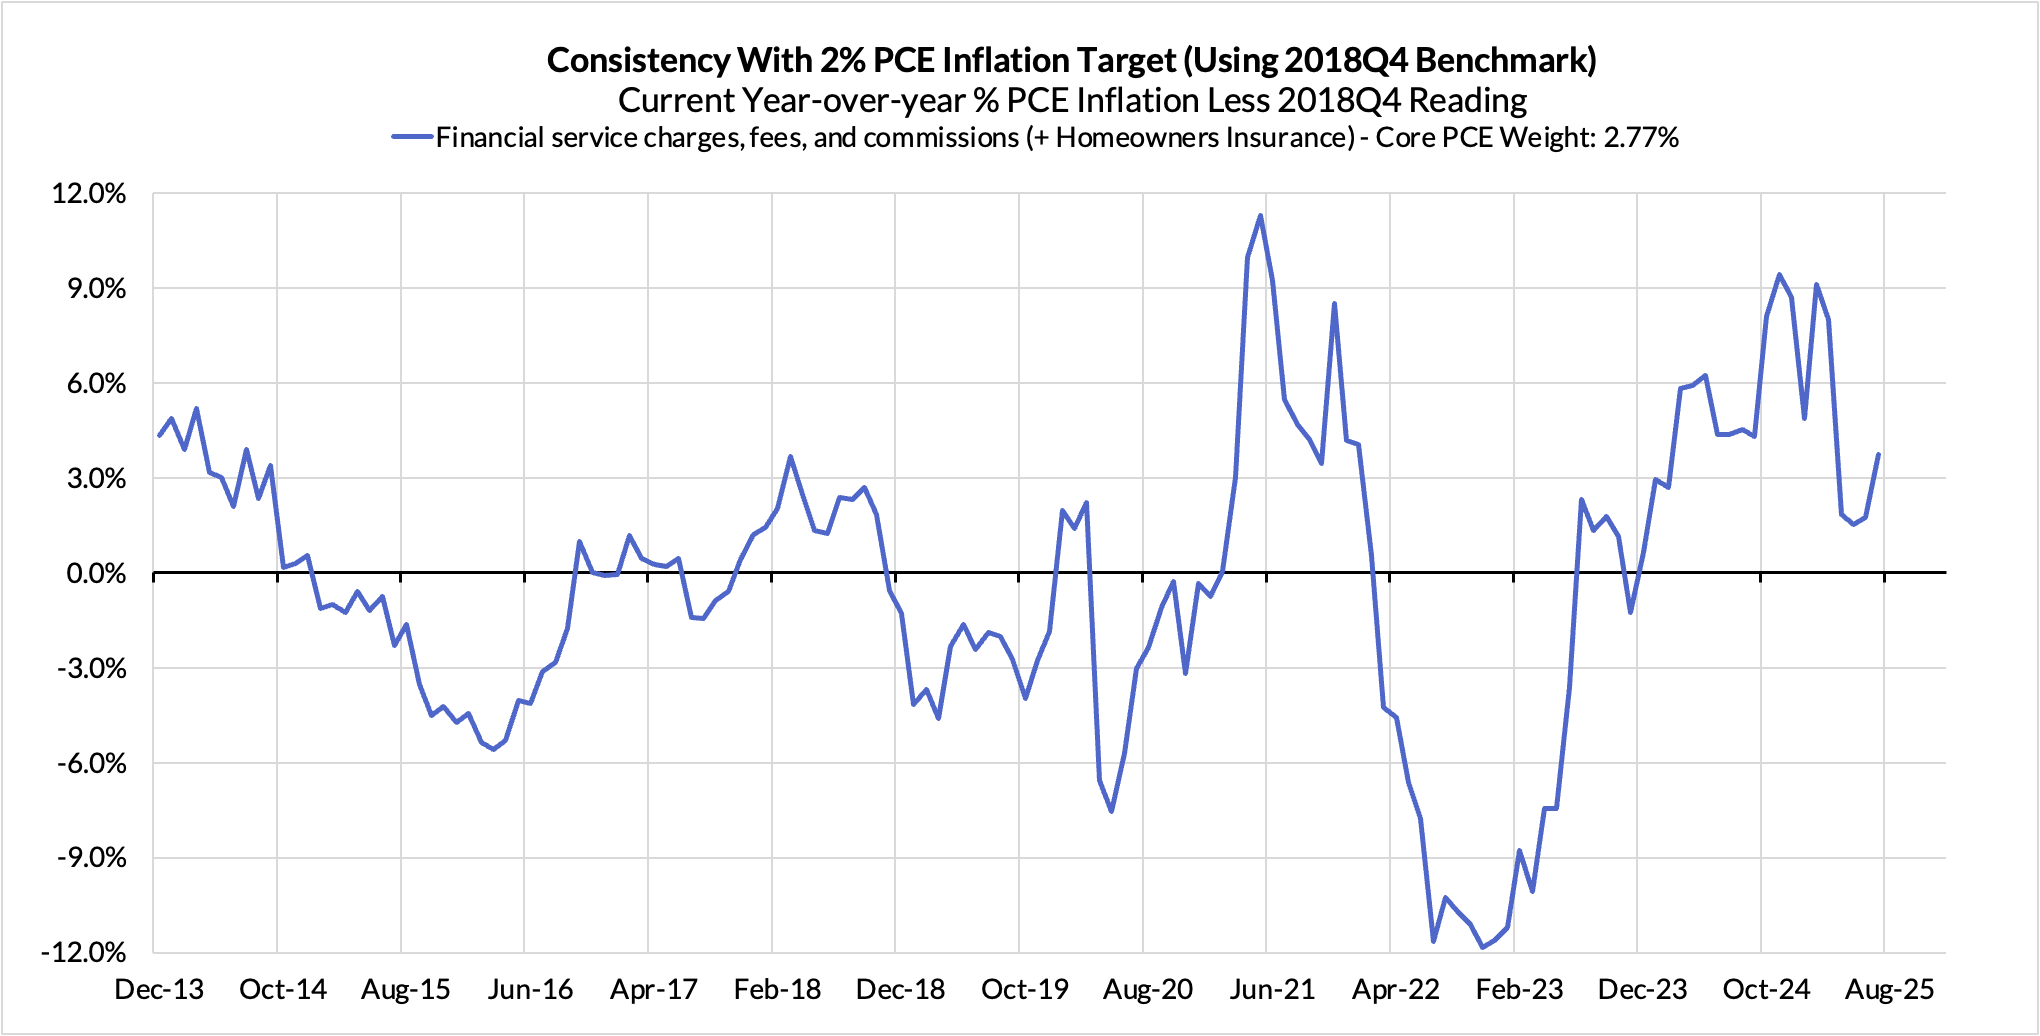
It is true that this past months' increase was buoyed by the financial services components that are sensitive—with a lag—to stock market changes. The reversal of the equity market from the Liberation Day drawdown is unwinding some prior deflation in financial service prices.
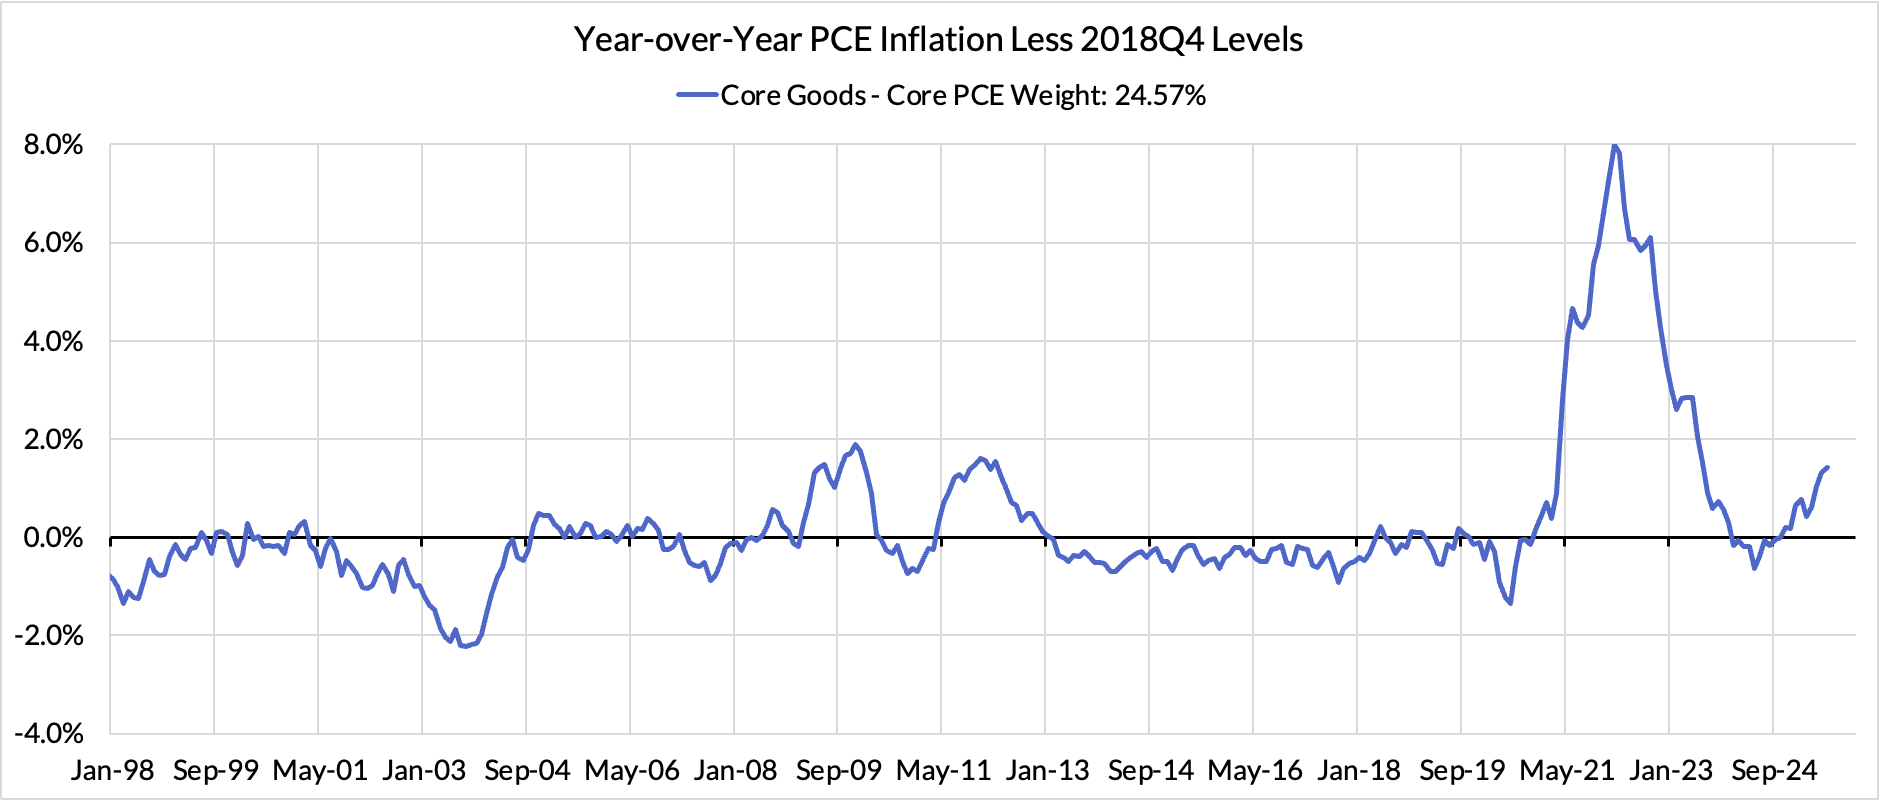
Financial services inflation is still meaningfully lower on a y/y basis vs 12 months ago. The increases in y/y from last year are primarily about rising Core Goods inflation.
The Fed is trapped in a tricky moment where the labor market data is showing a notable slowing after the latest batch of nonfarm payroll revisions, but the inflation data also looks quite perky. The Fed wants to square the circle by attributing the recent rise in inflation to temporary tariff-related price increases that it can look through, but:
The Fed may be less inclined to look through these risks if inflation broadens to more components, even if tariffs are the fundamental driver, and
The labor market data might not capitulate quite as suddenly as the Fed currently projects (the median FOMC member projects a 4.5% unemployment rate in Q4, it is currently 4.2%).
A 25bp cut in September looks fairly likely given Chair Powell's most recent speech and the current data, but we would merely flag that the data profile can quickly catch the Fed offsides. A 50bp cut in September might make sense if the labor market data materially weakens in the next Employment Report. No cut may make sense if the labor market shows more signs of stability and inflation shows further upward pressure in August.
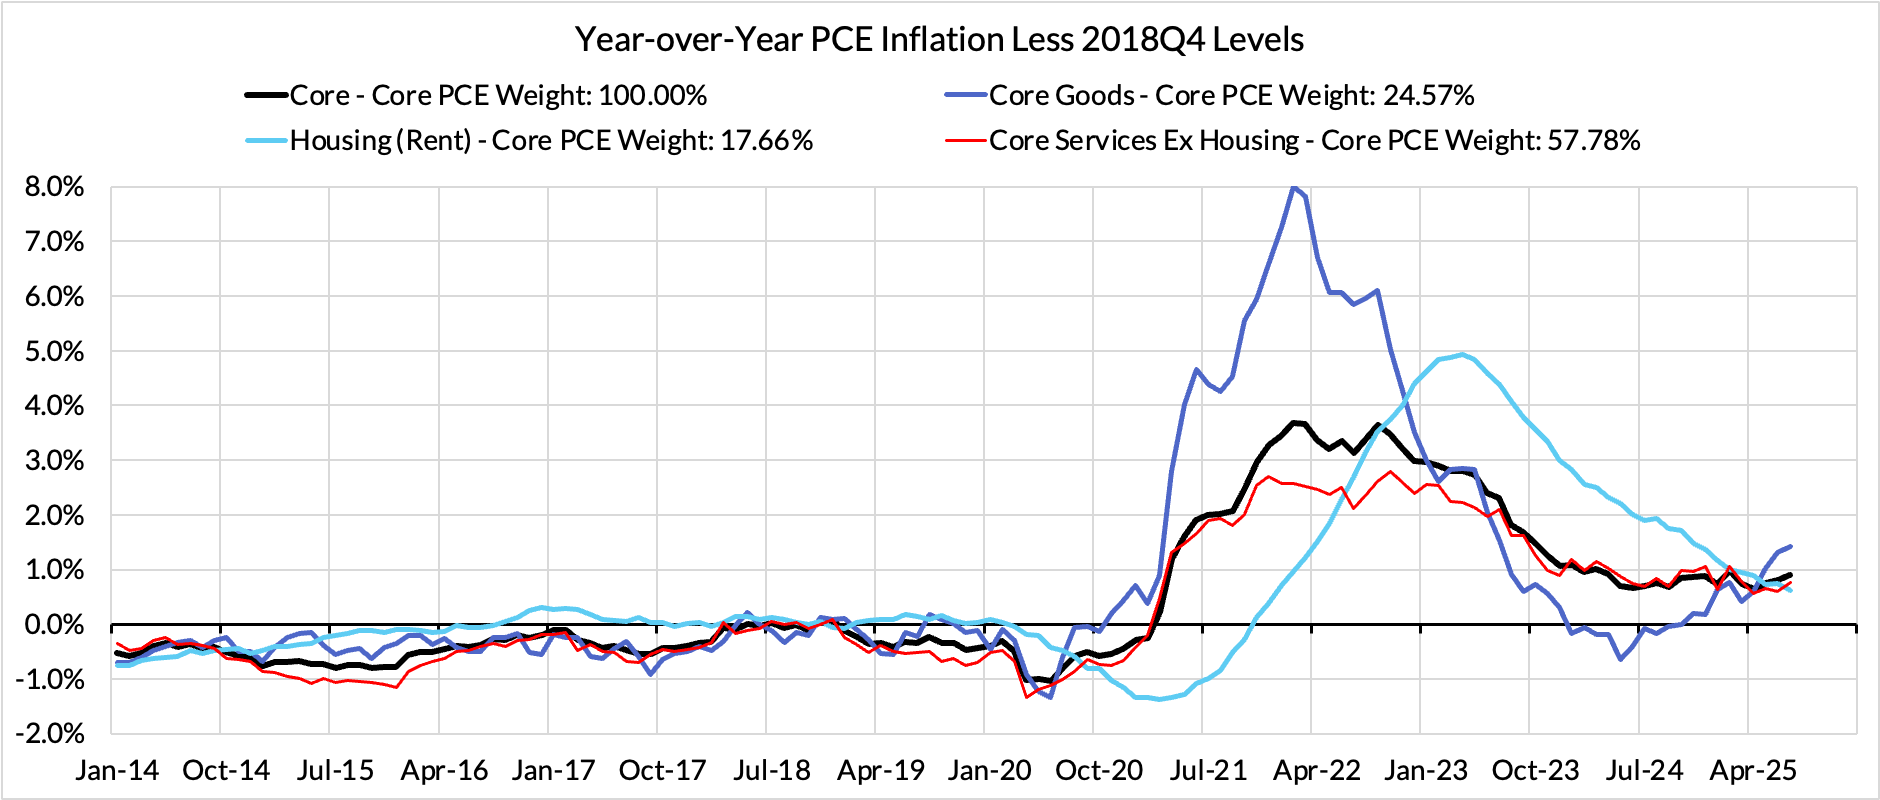
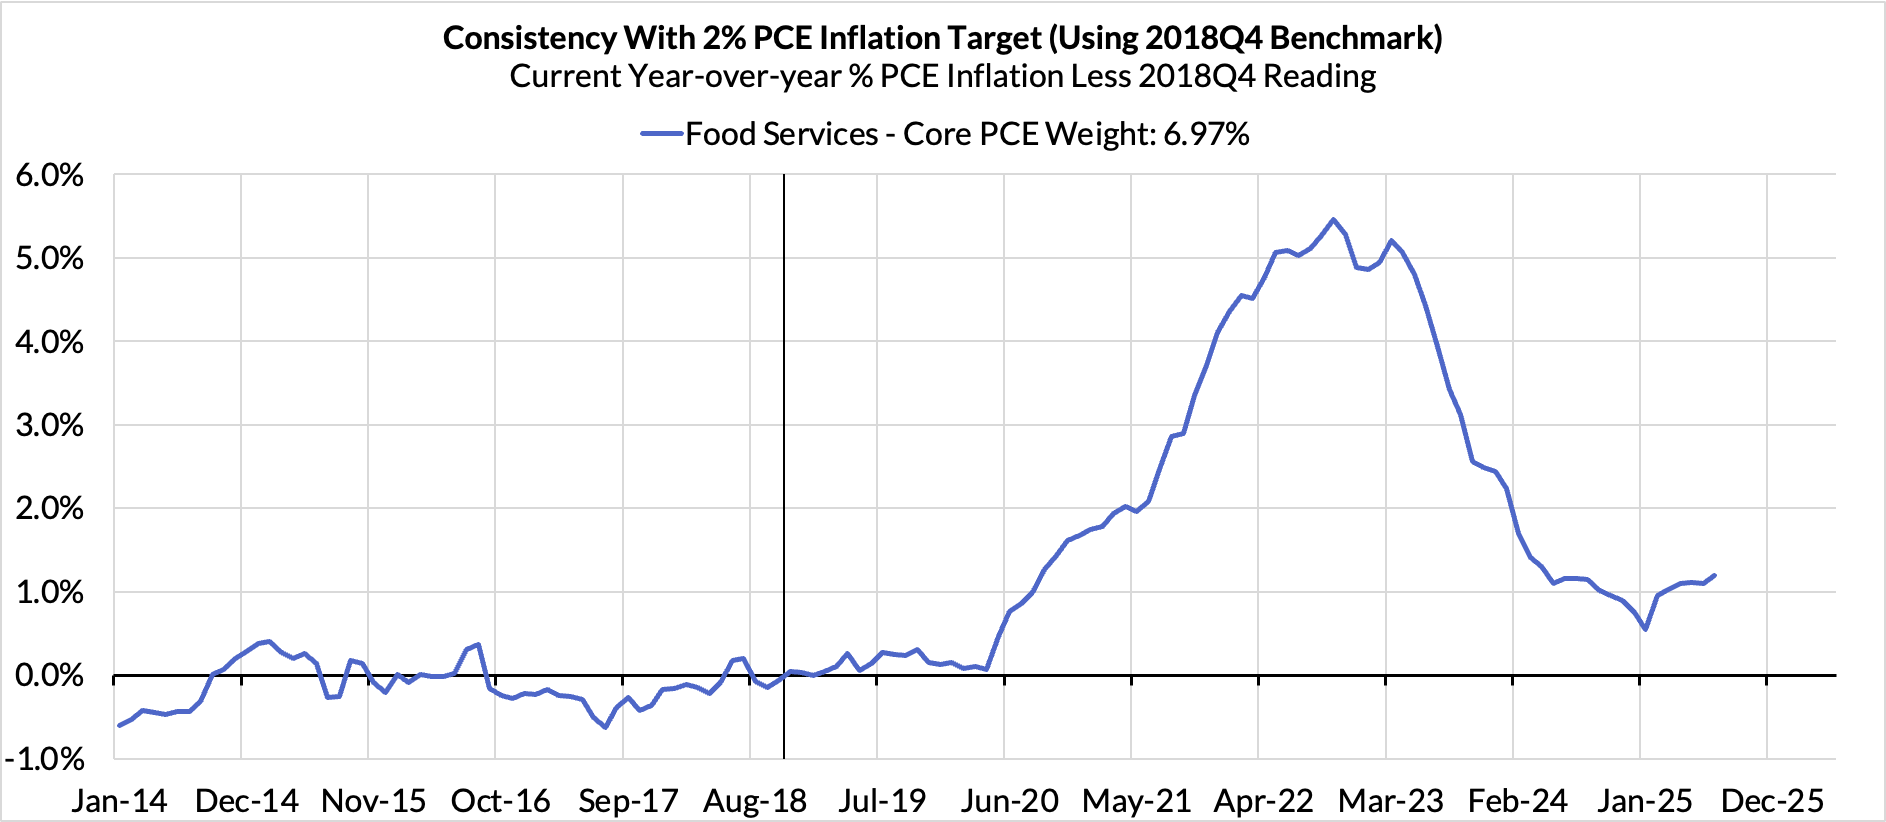
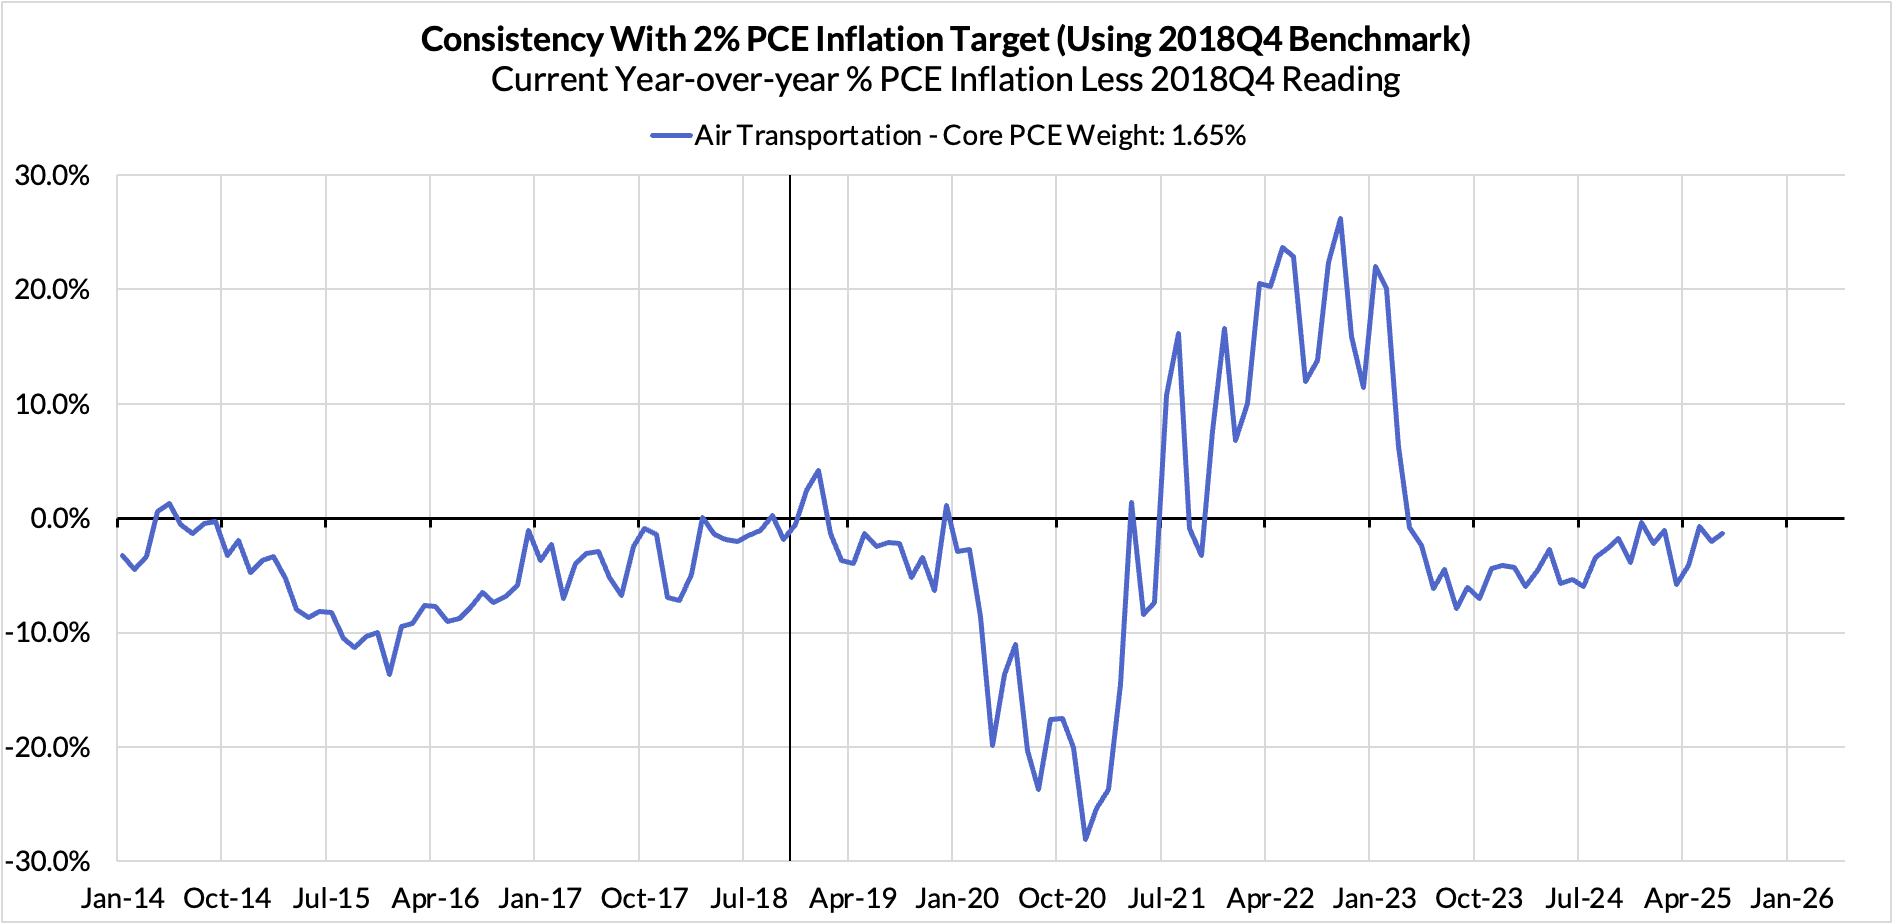
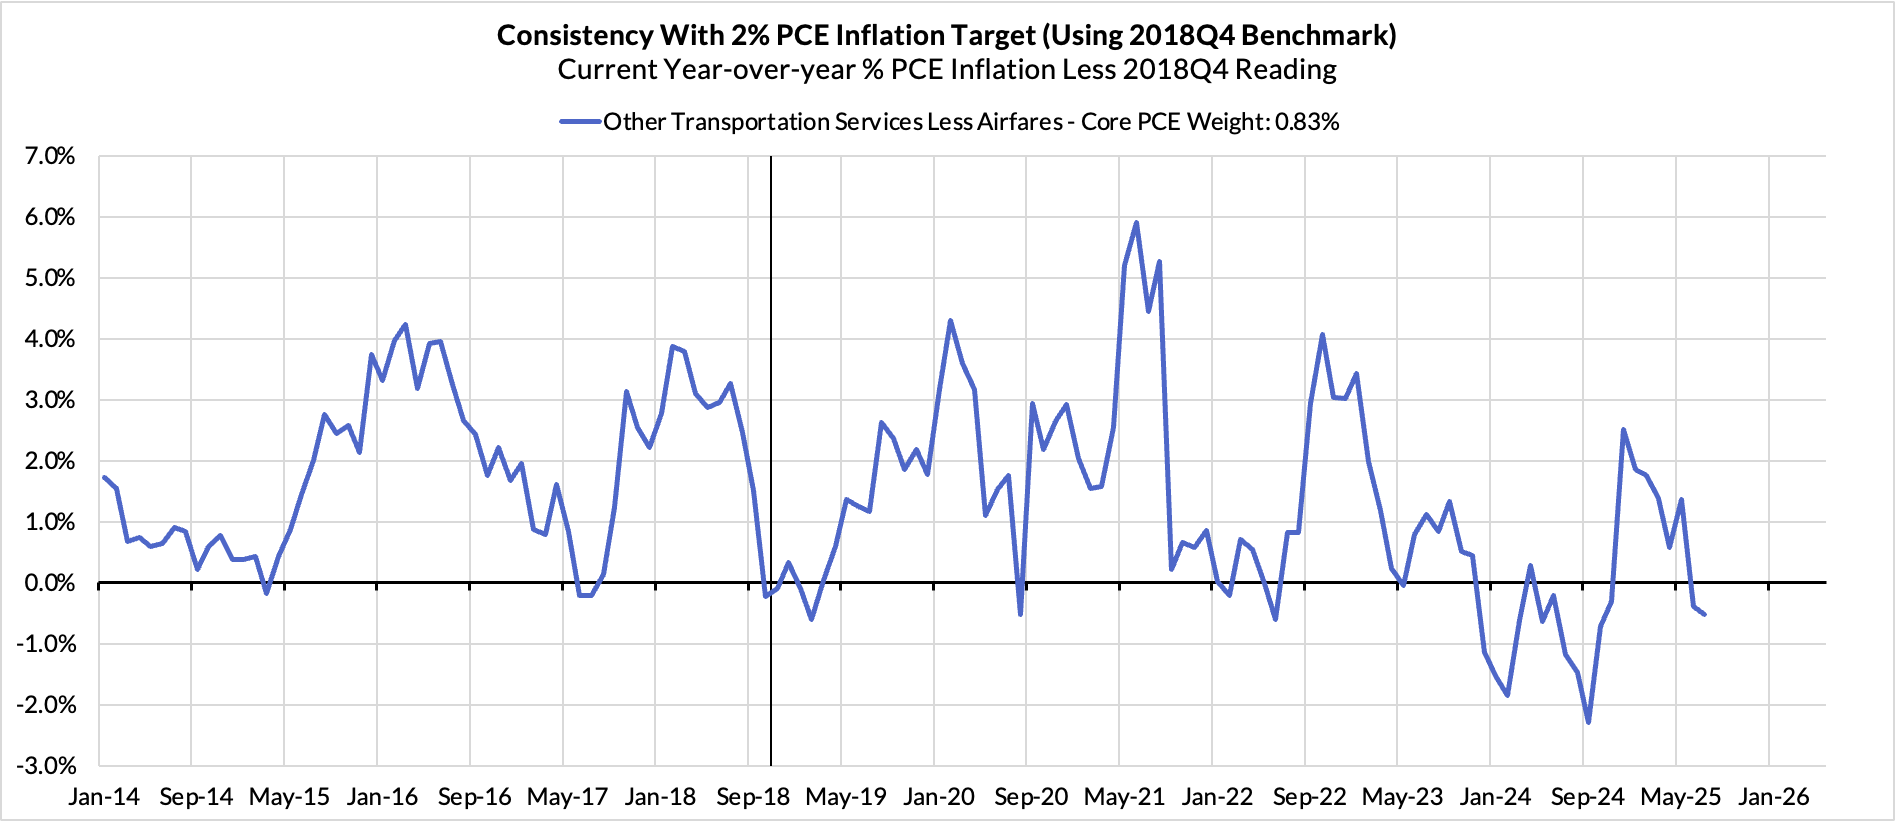
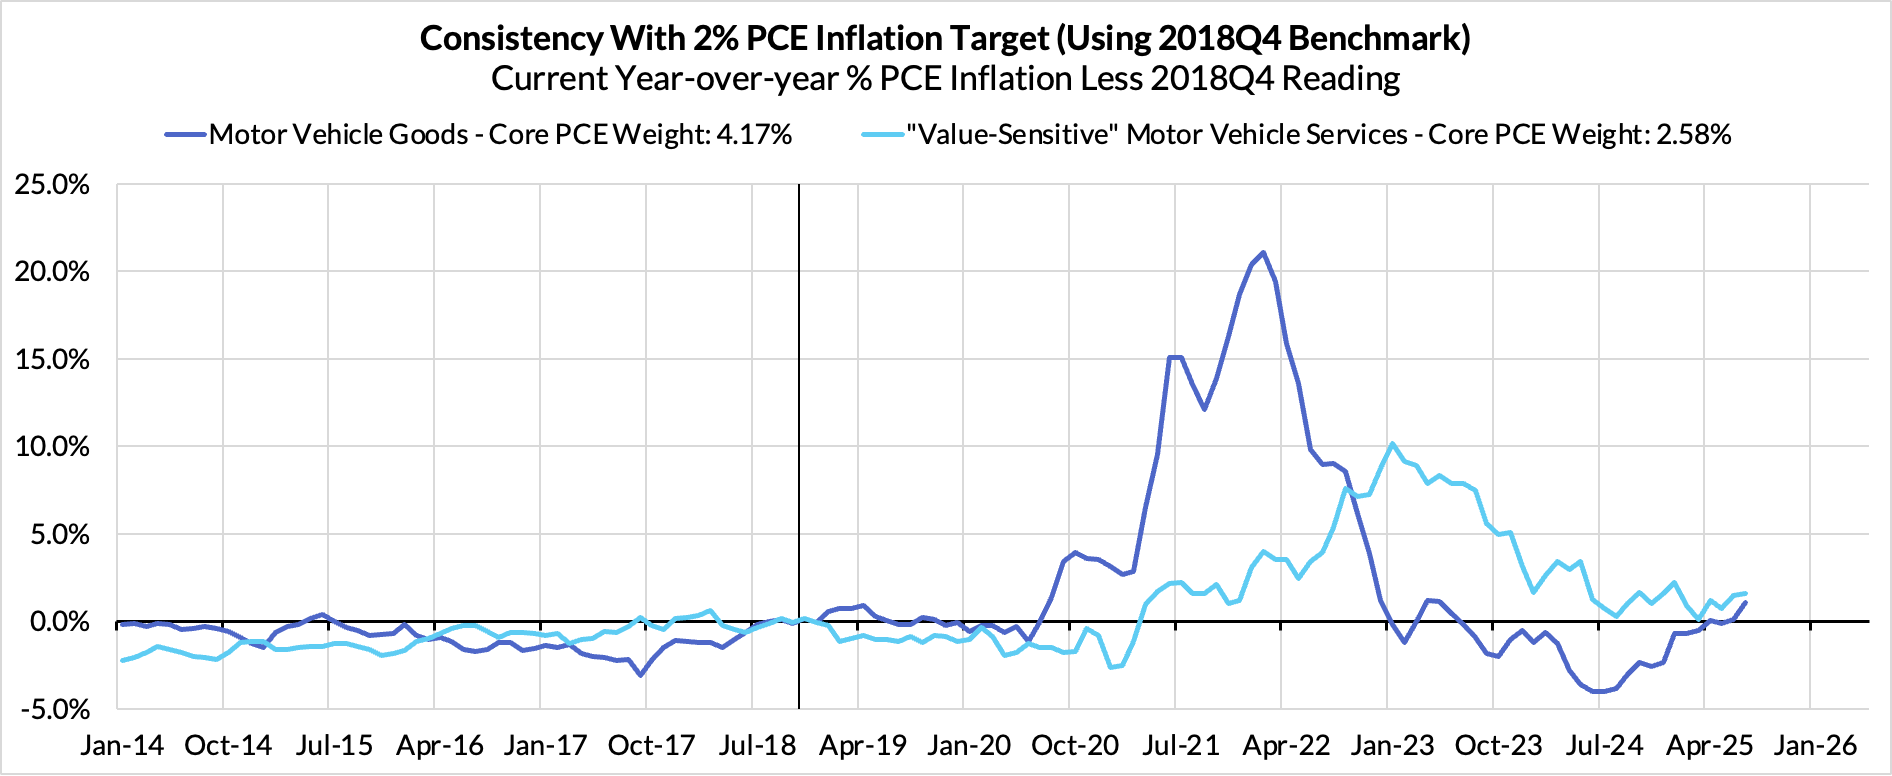
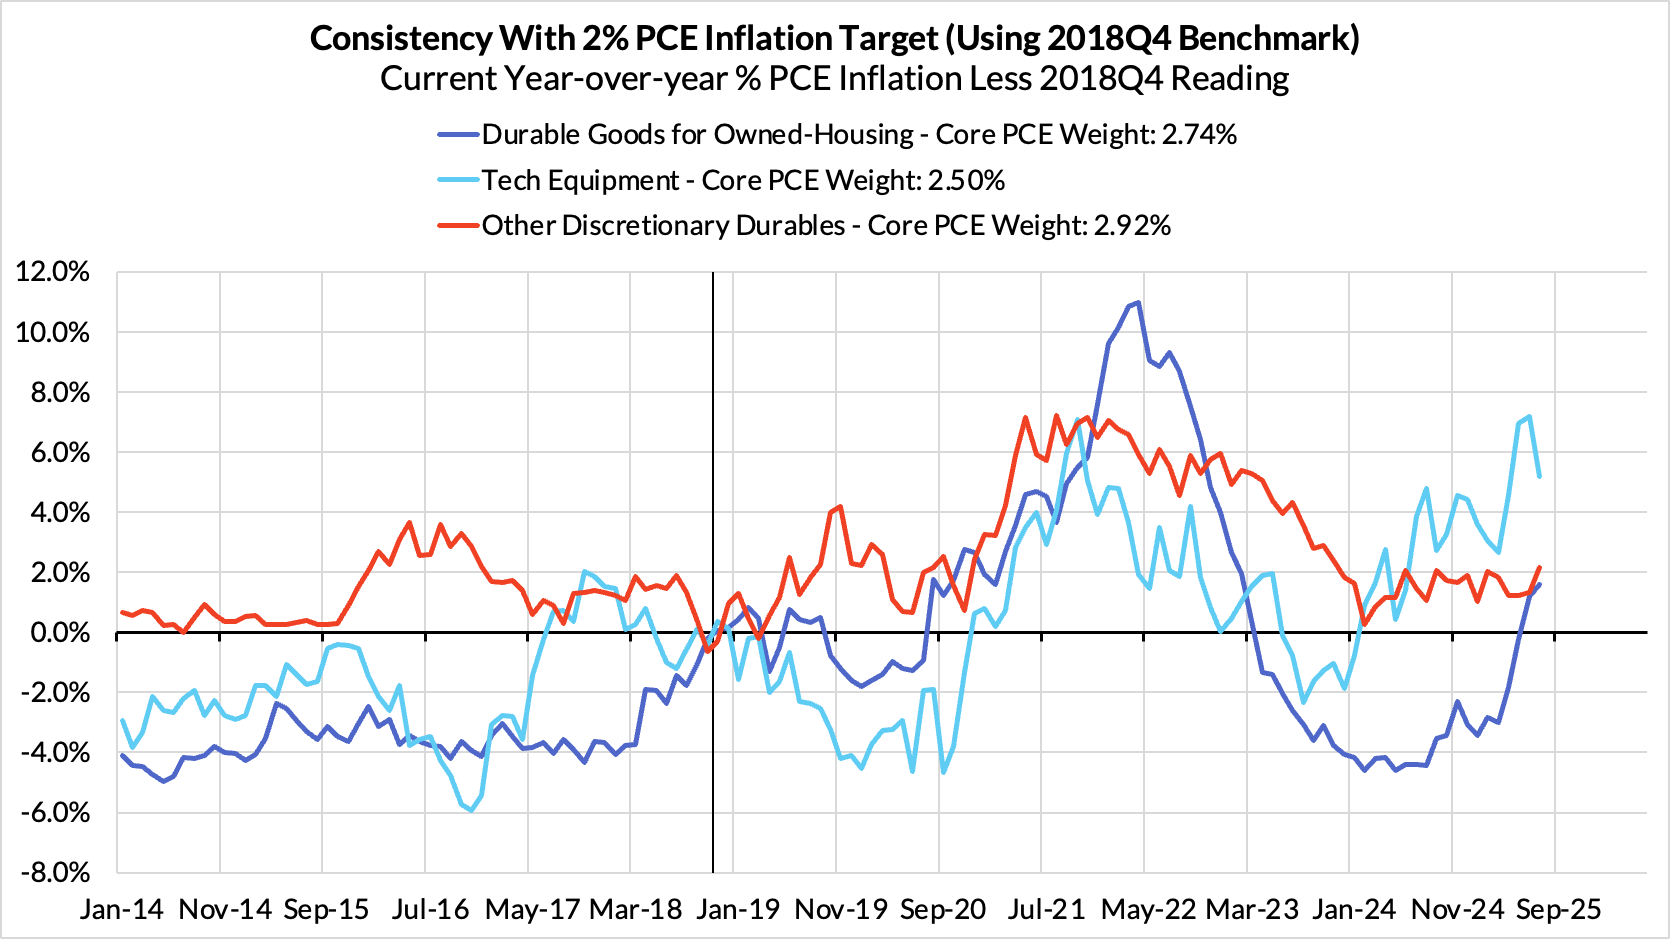
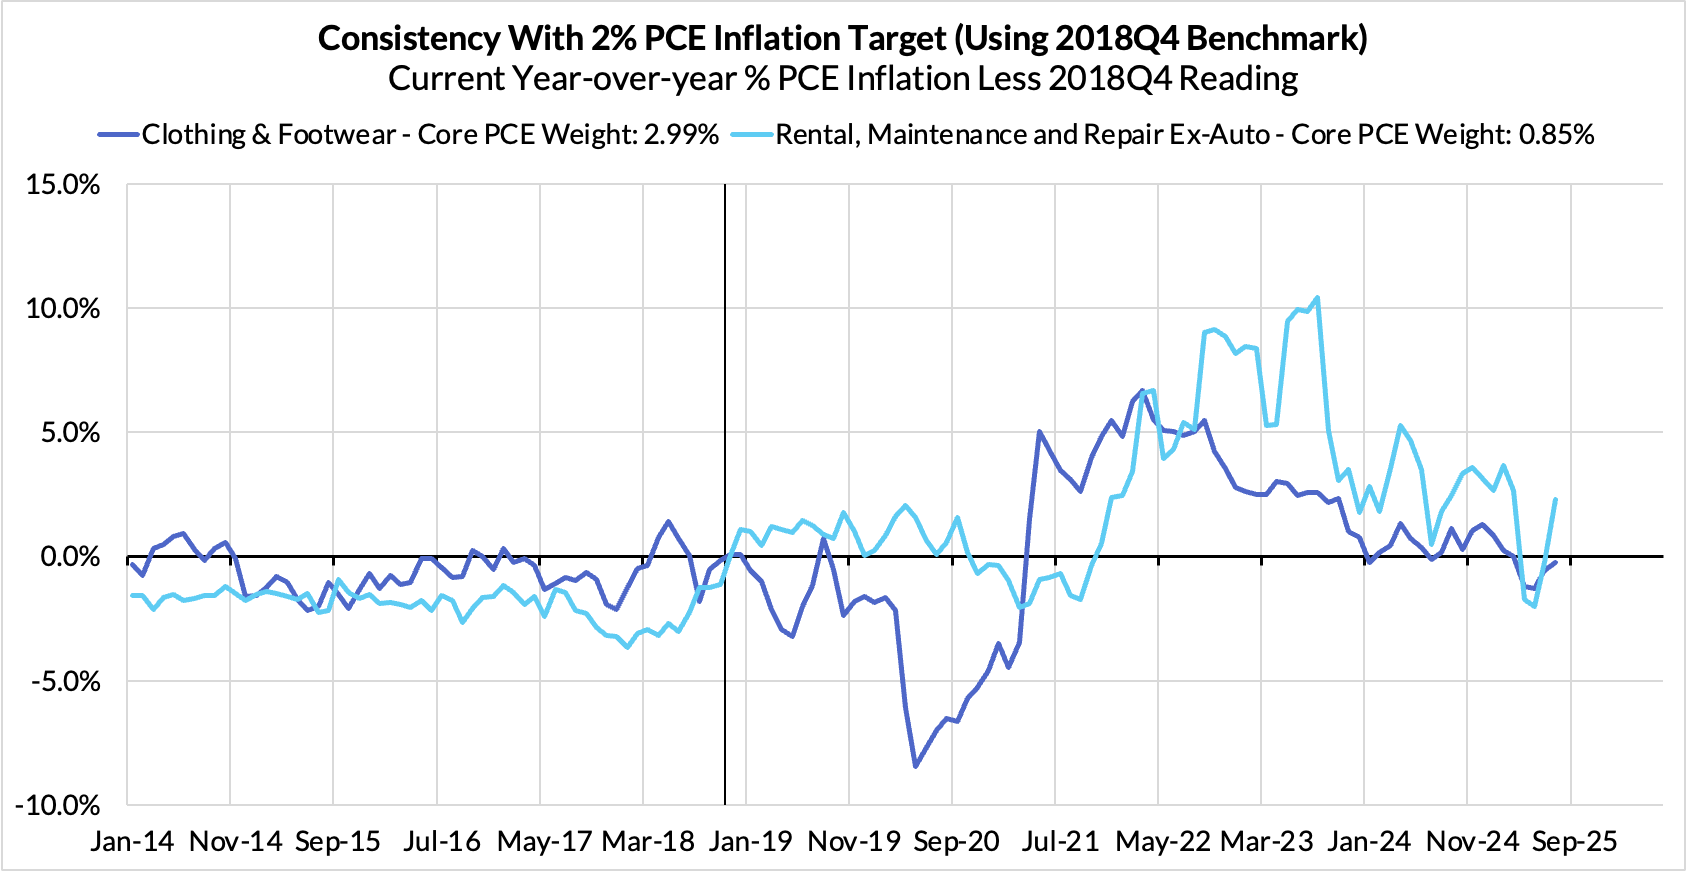
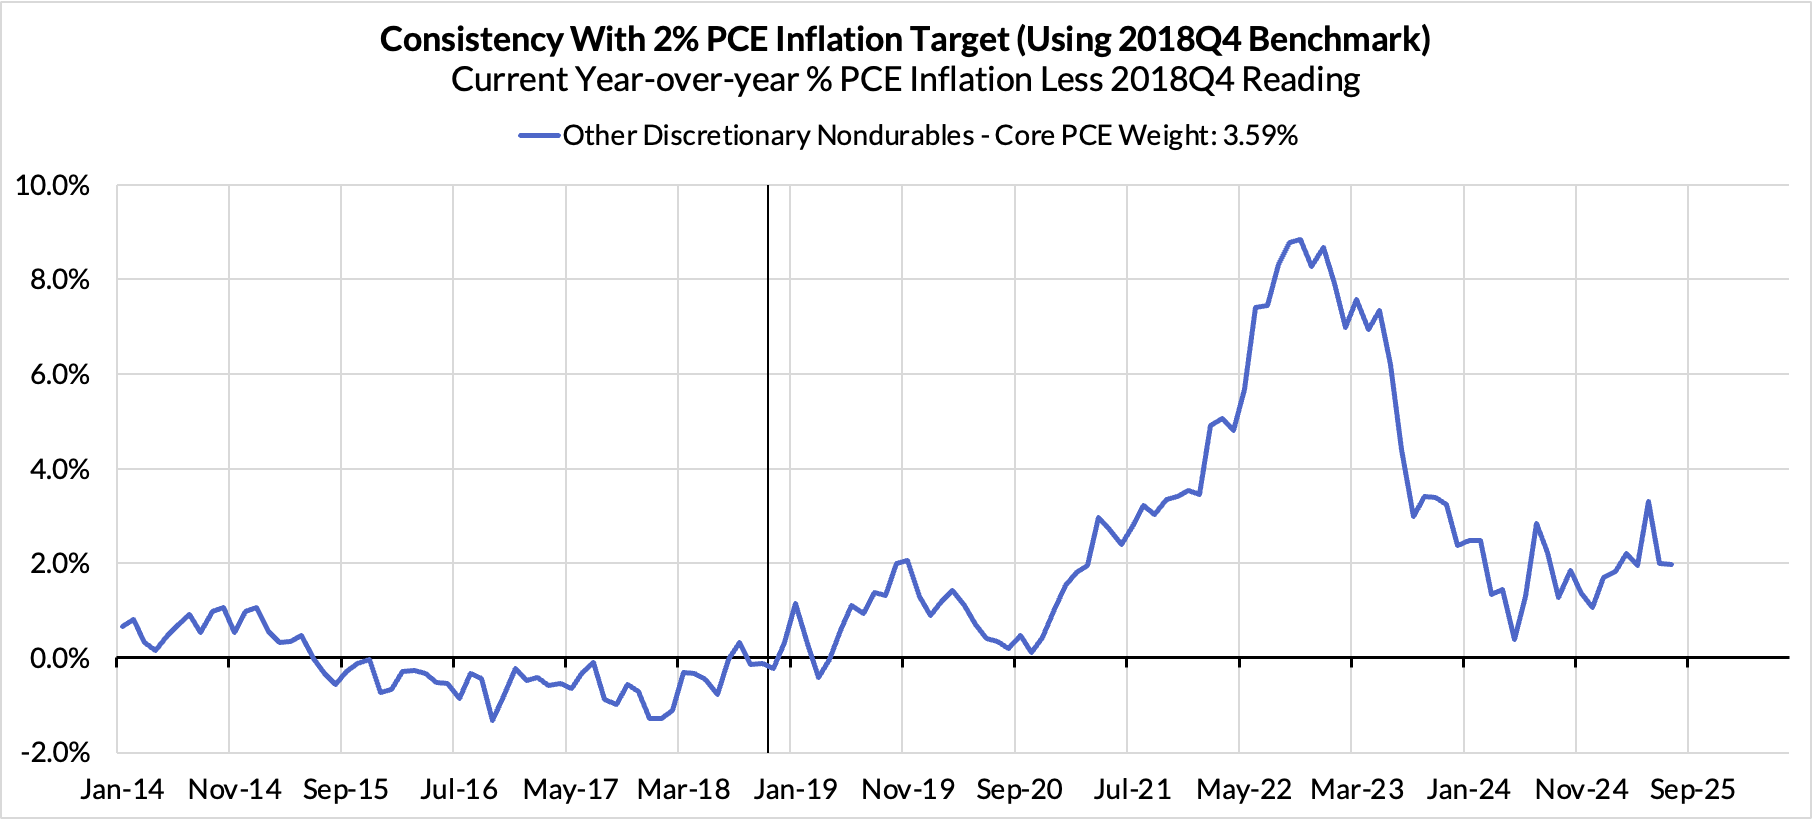
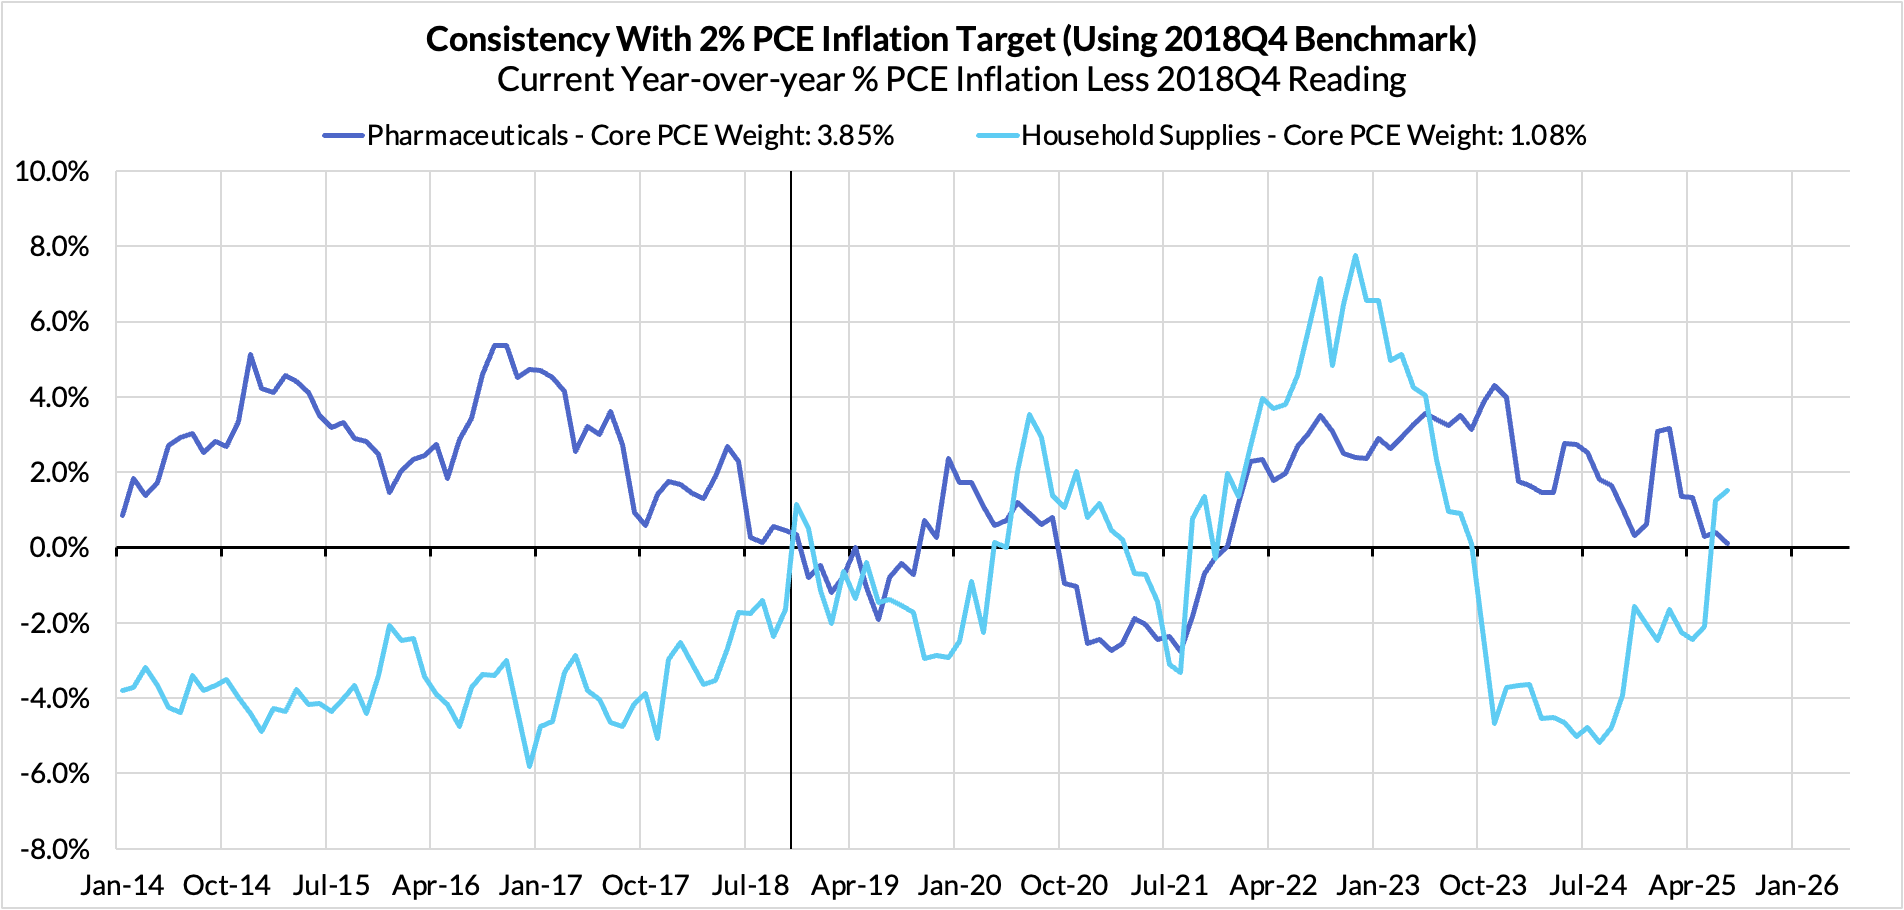
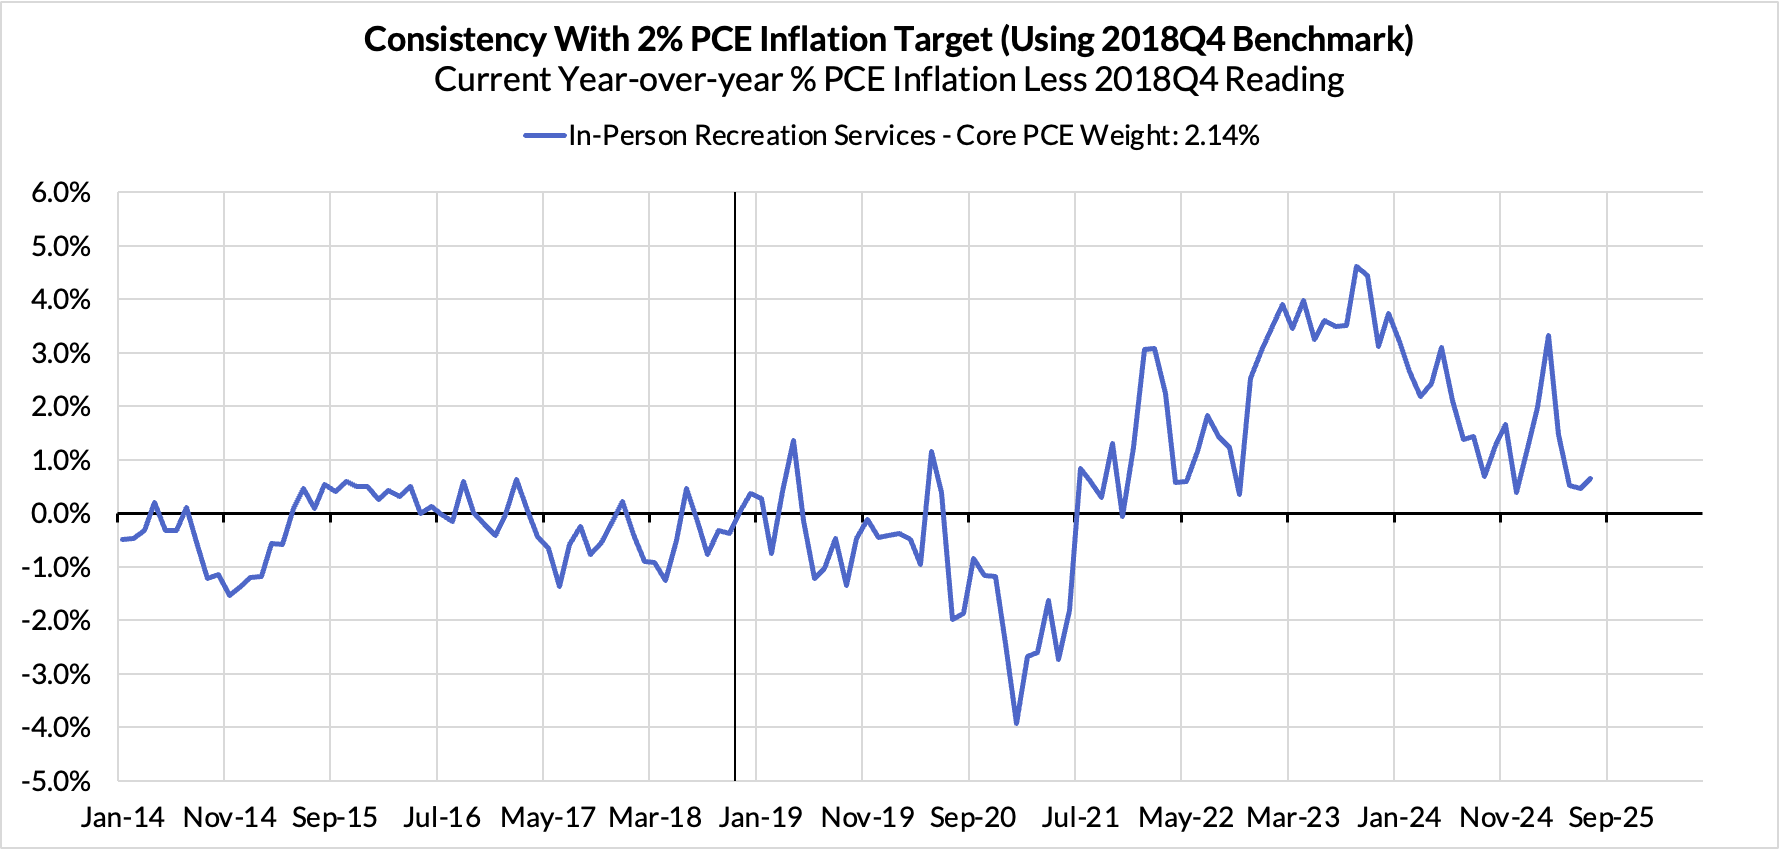
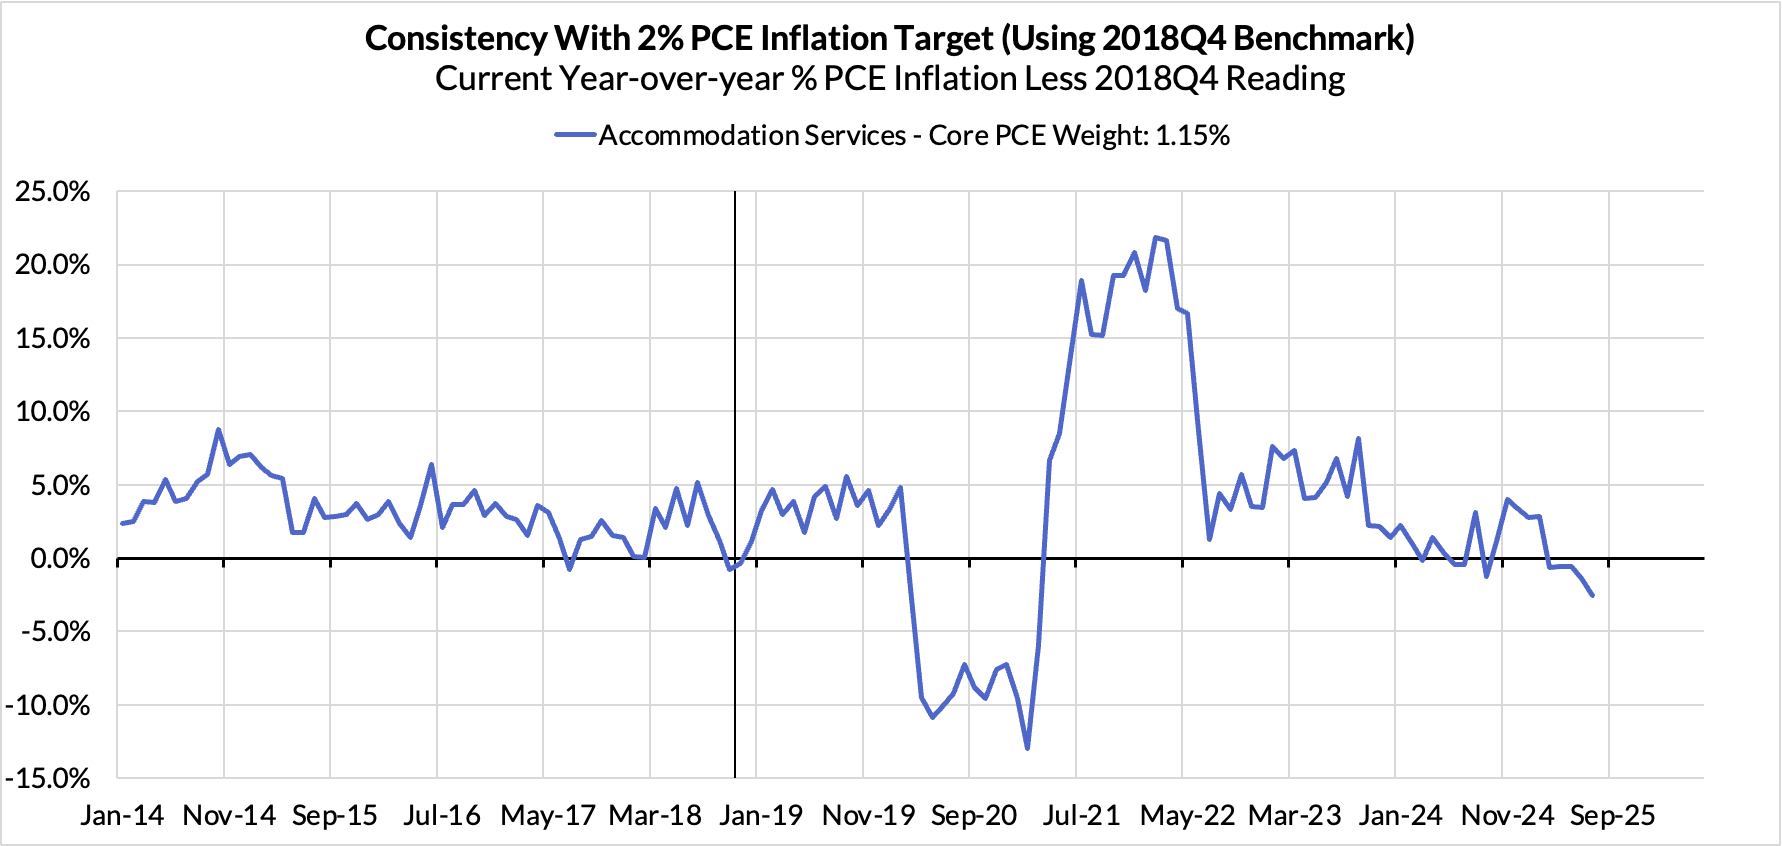
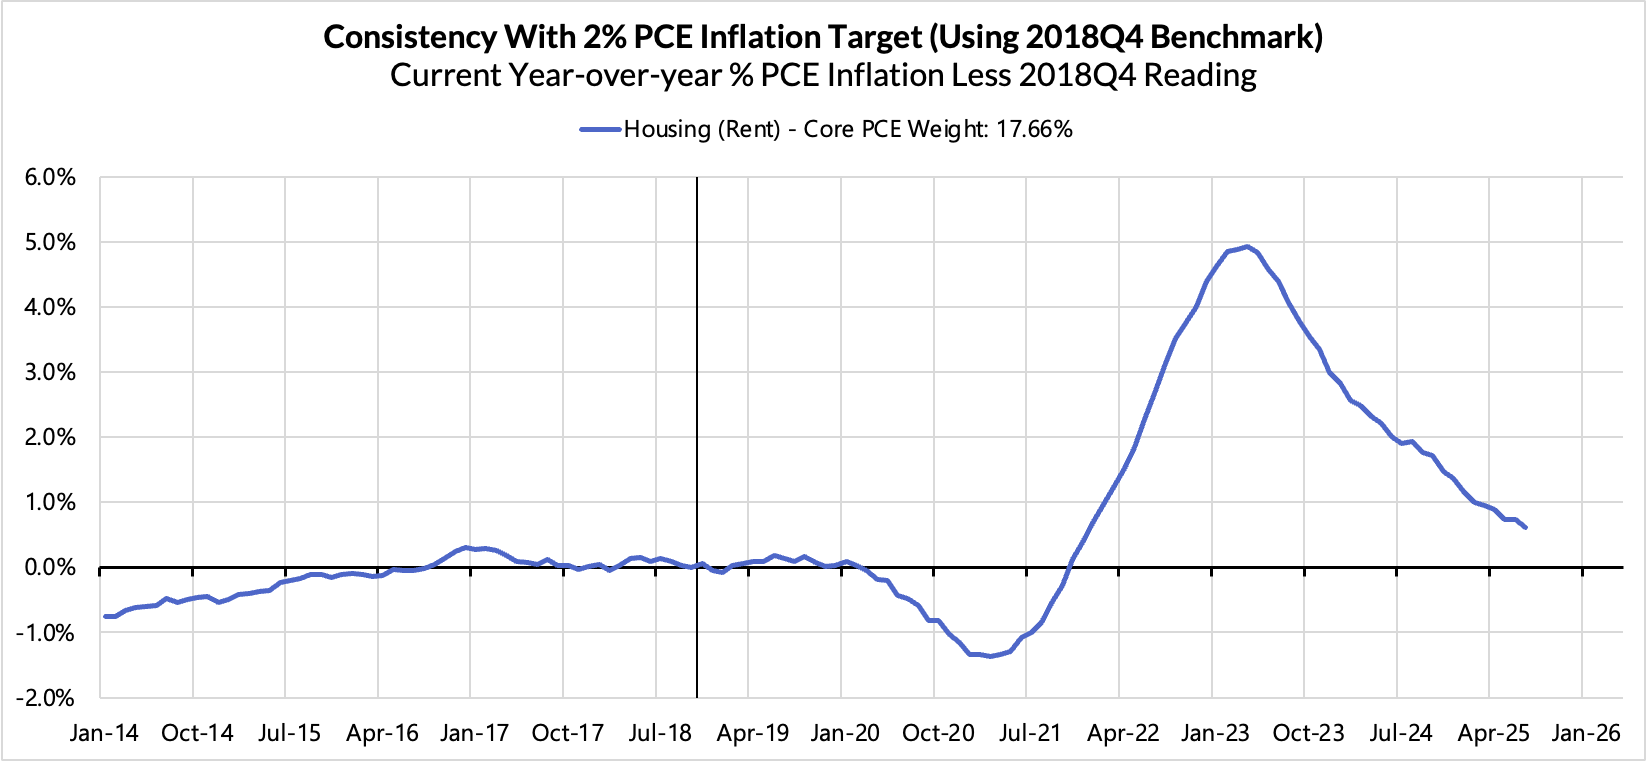
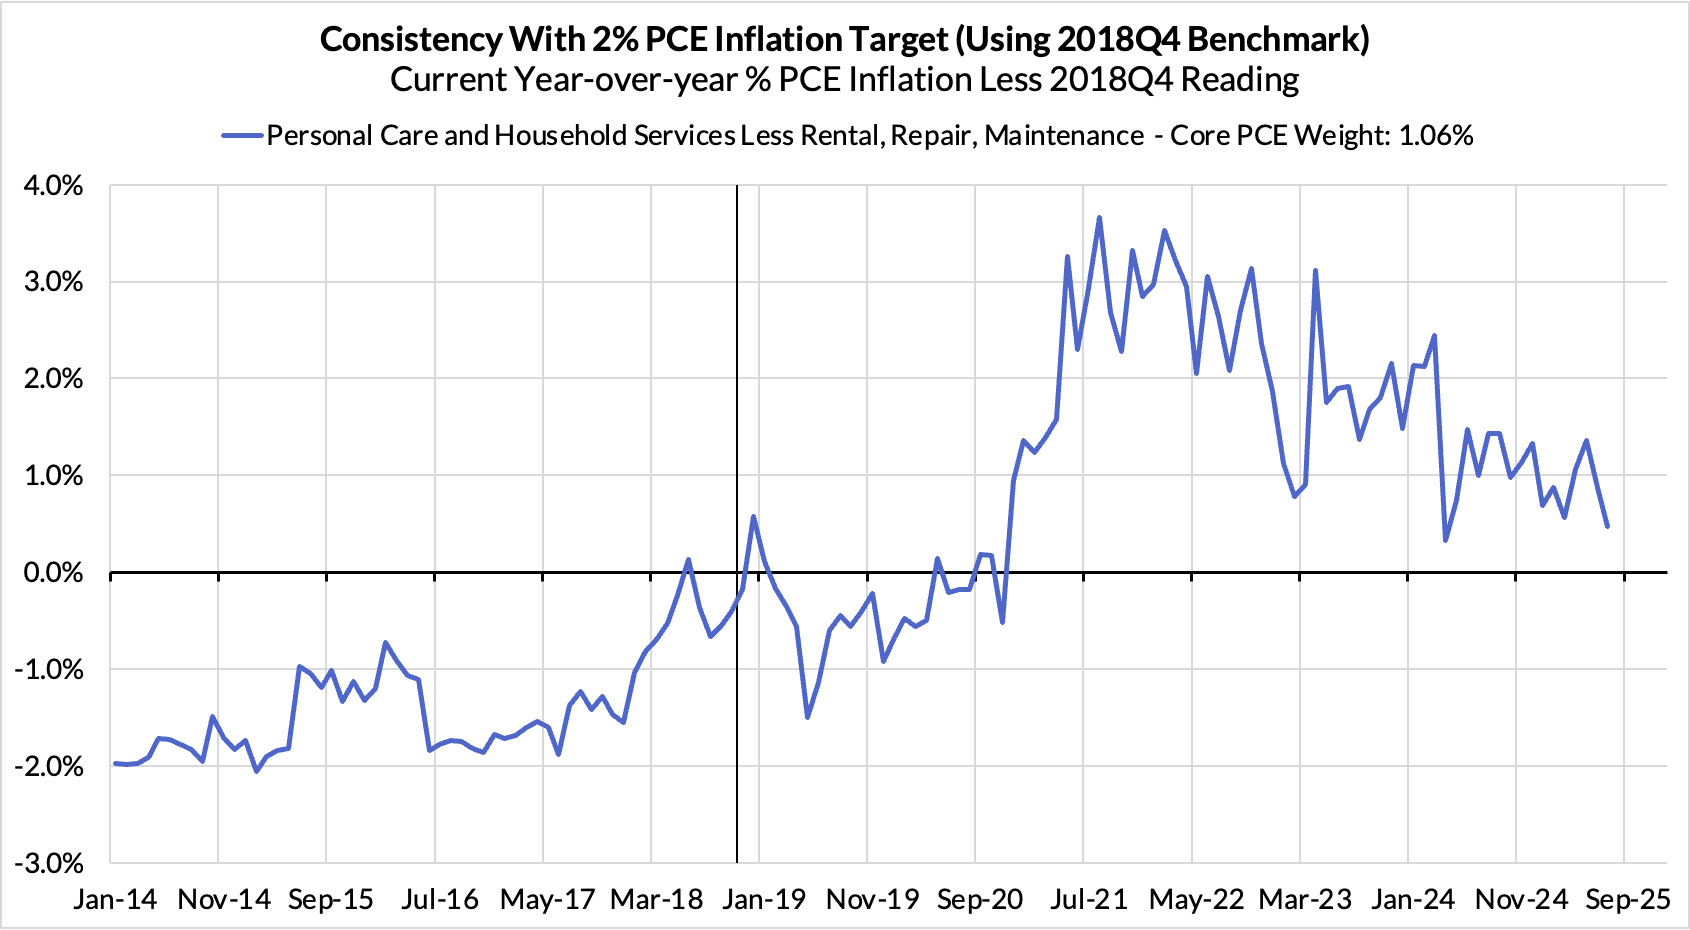
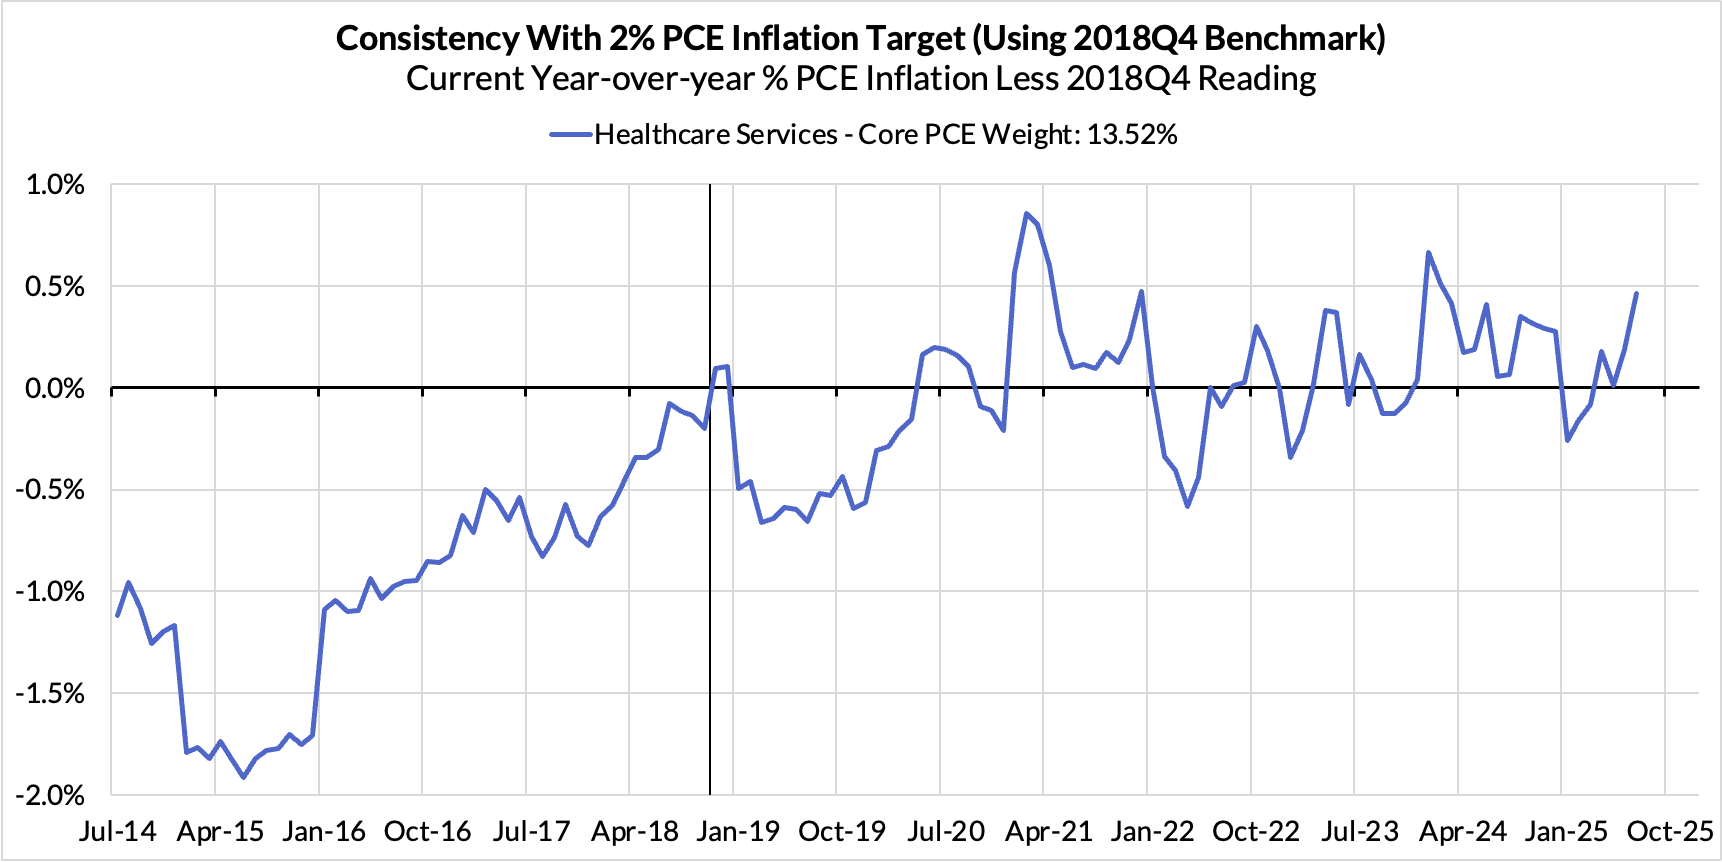
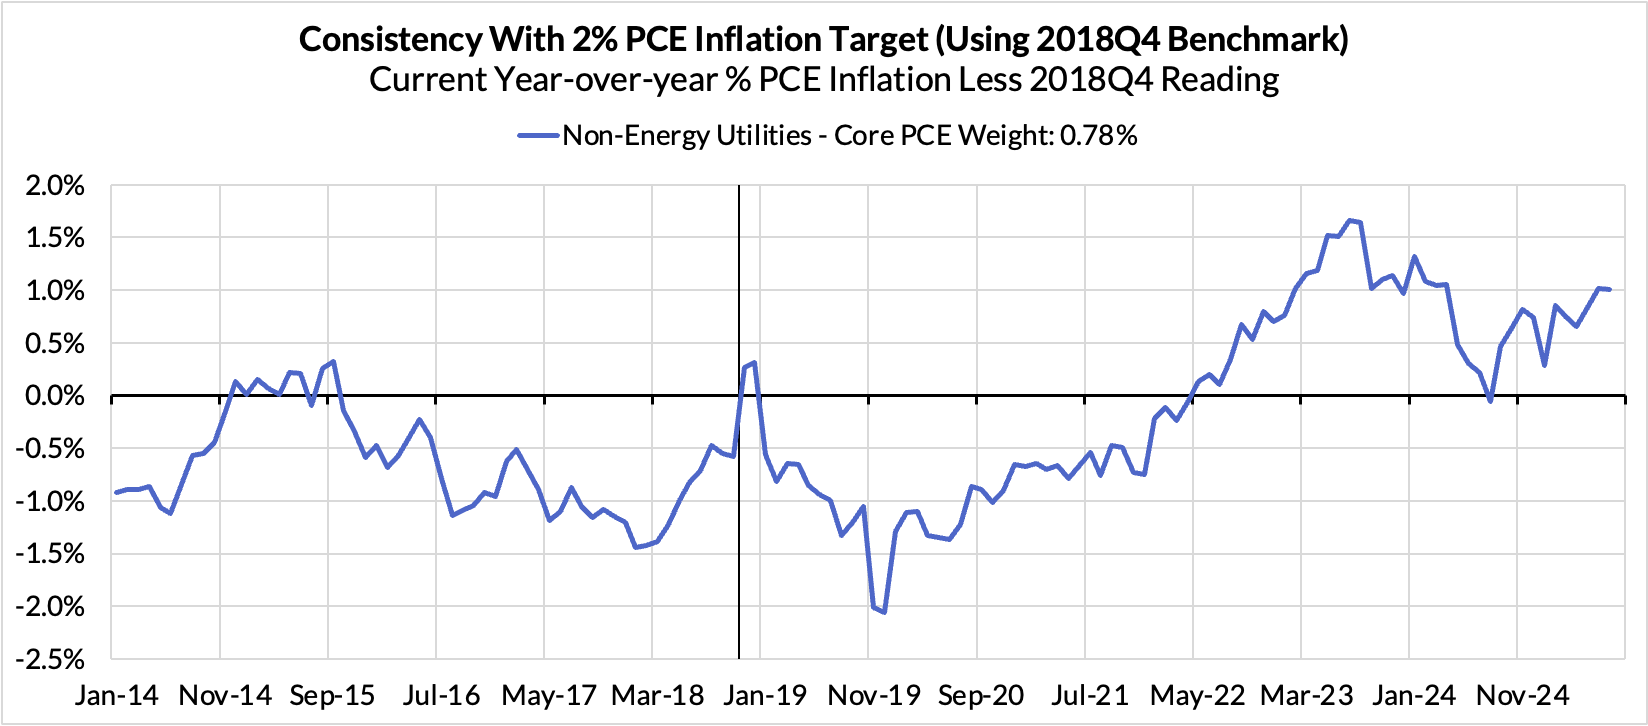
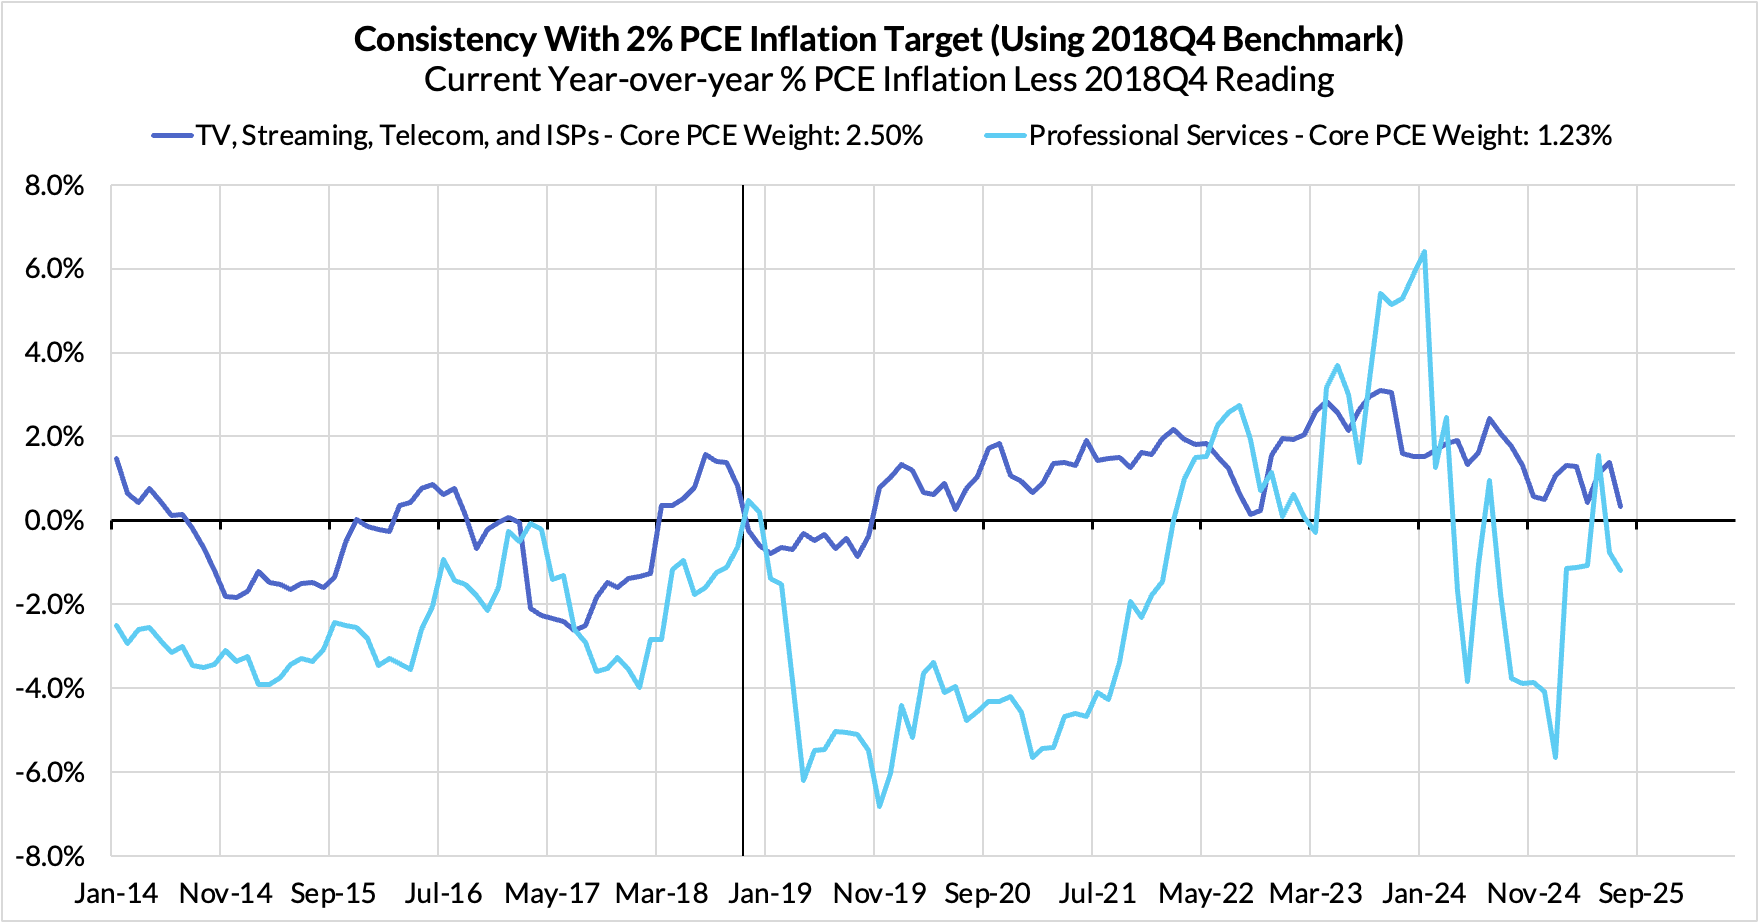
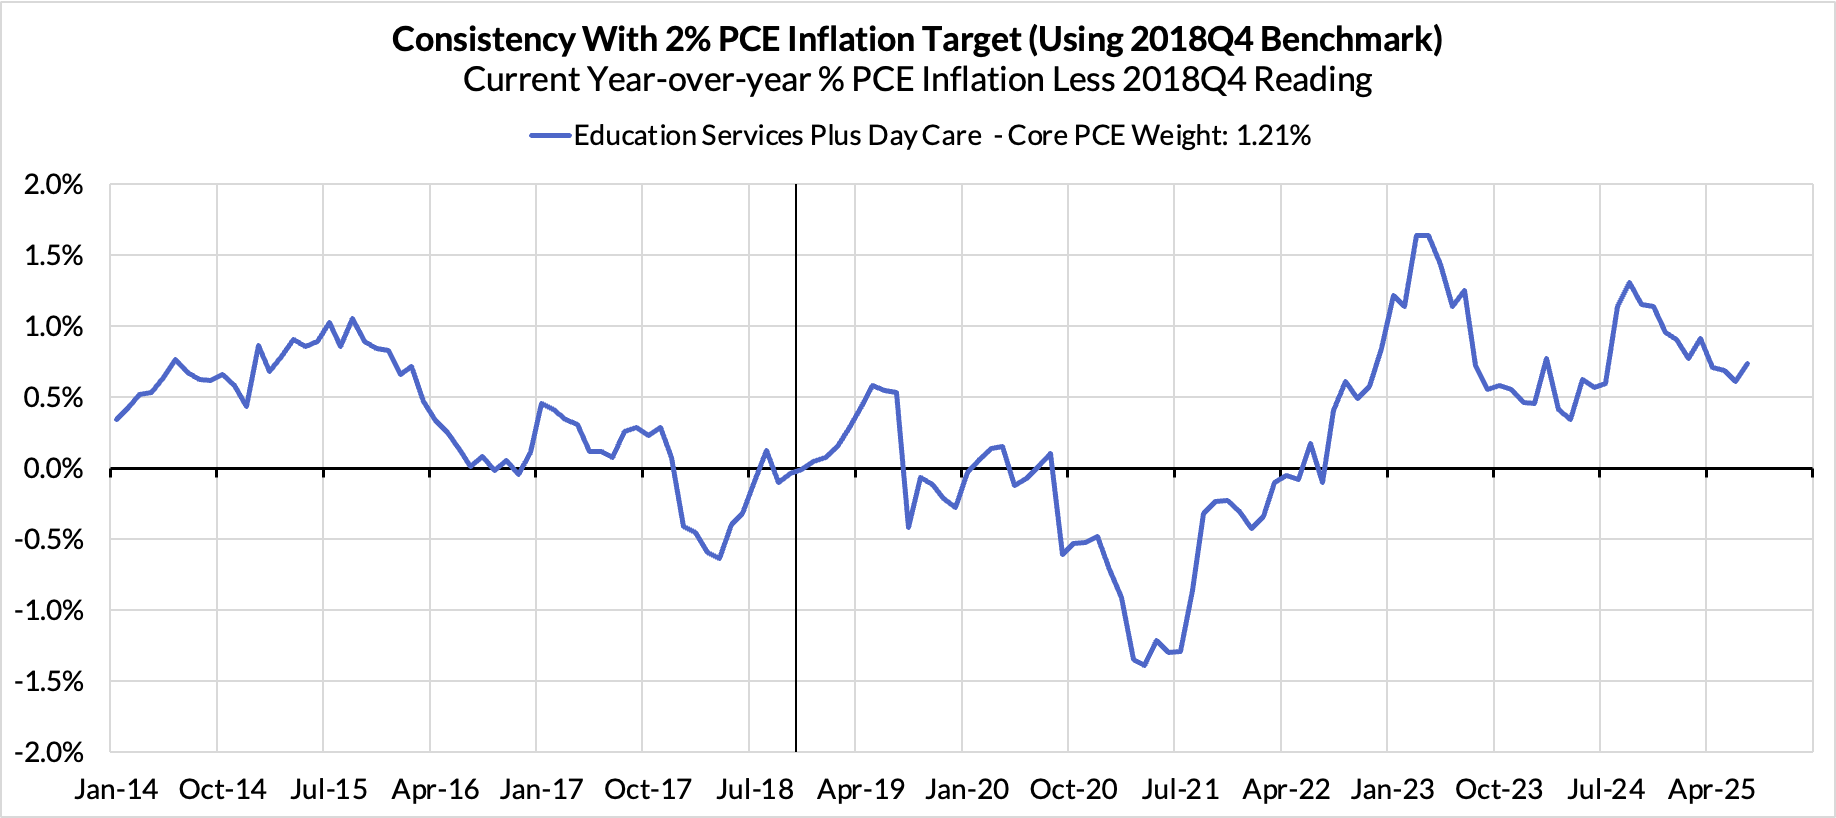
Inflation Overshoots At The Component Level
Appendix: Core PCE Heatmaps
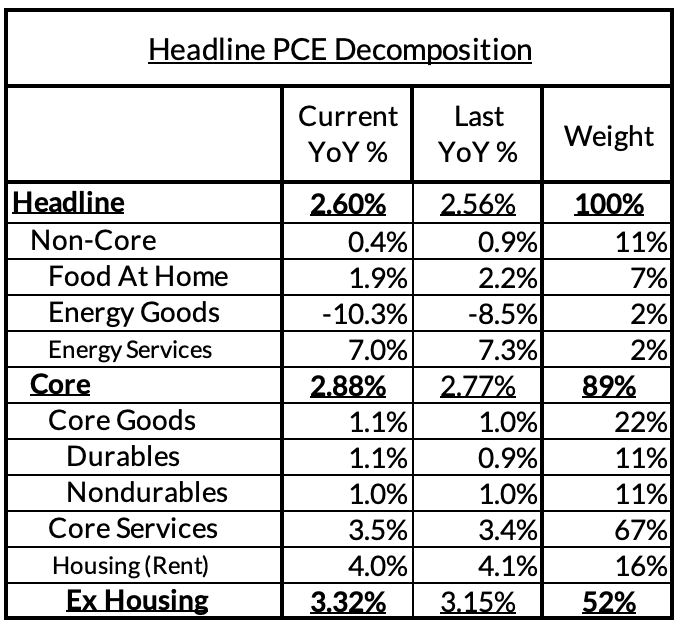
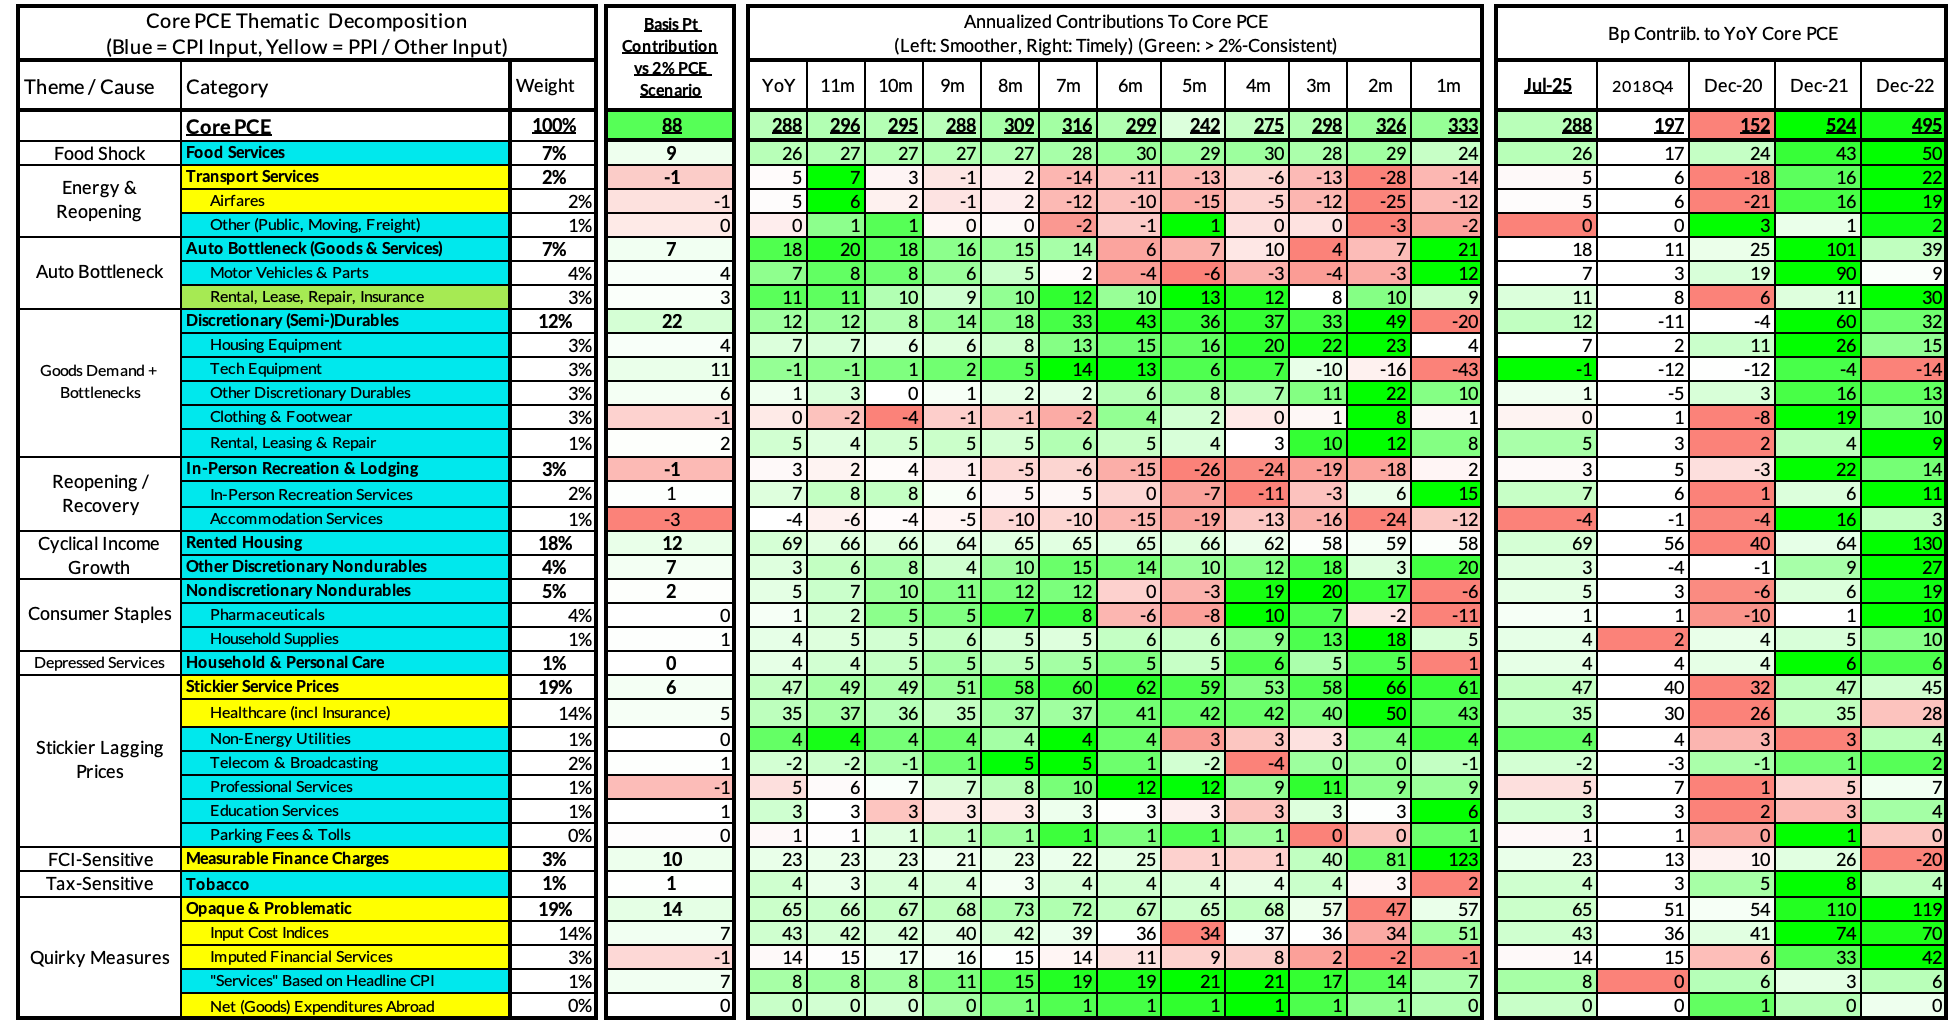
Right now Core PCE (PCE less food products and energy) ran at a 2.88% year-over-year pace as of July, 88 basis points above the Fed's 2% inflation target for PCE.
There contributors to the overshoot:
Catch-up rent CPI inflation in response to the 2021-22 surge in household formation (a byproduct of rapidly recovering job growth) and market rents accounts for just 12 basis points to the 87 basis point Core PCE overshoot.
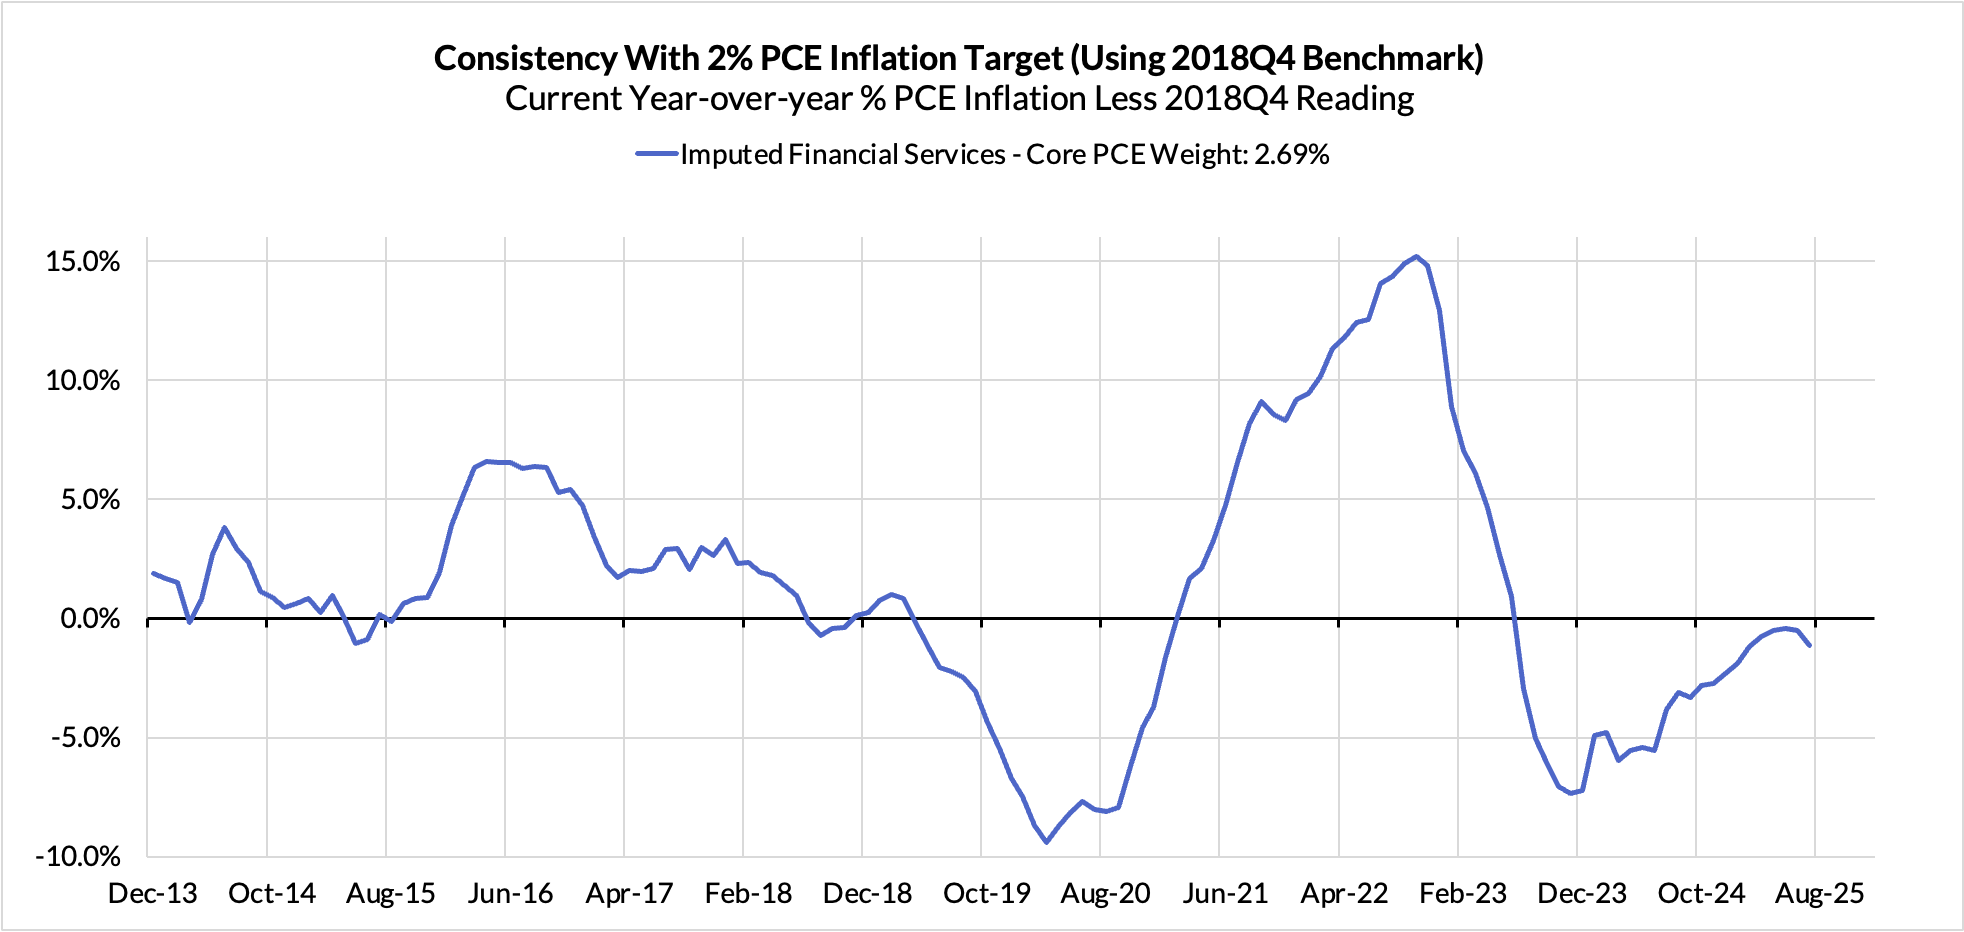
Measurable financial service charges now account for 10 basis points of the overshoot.
Food inputs likely adding 9 basis points to the overshoot
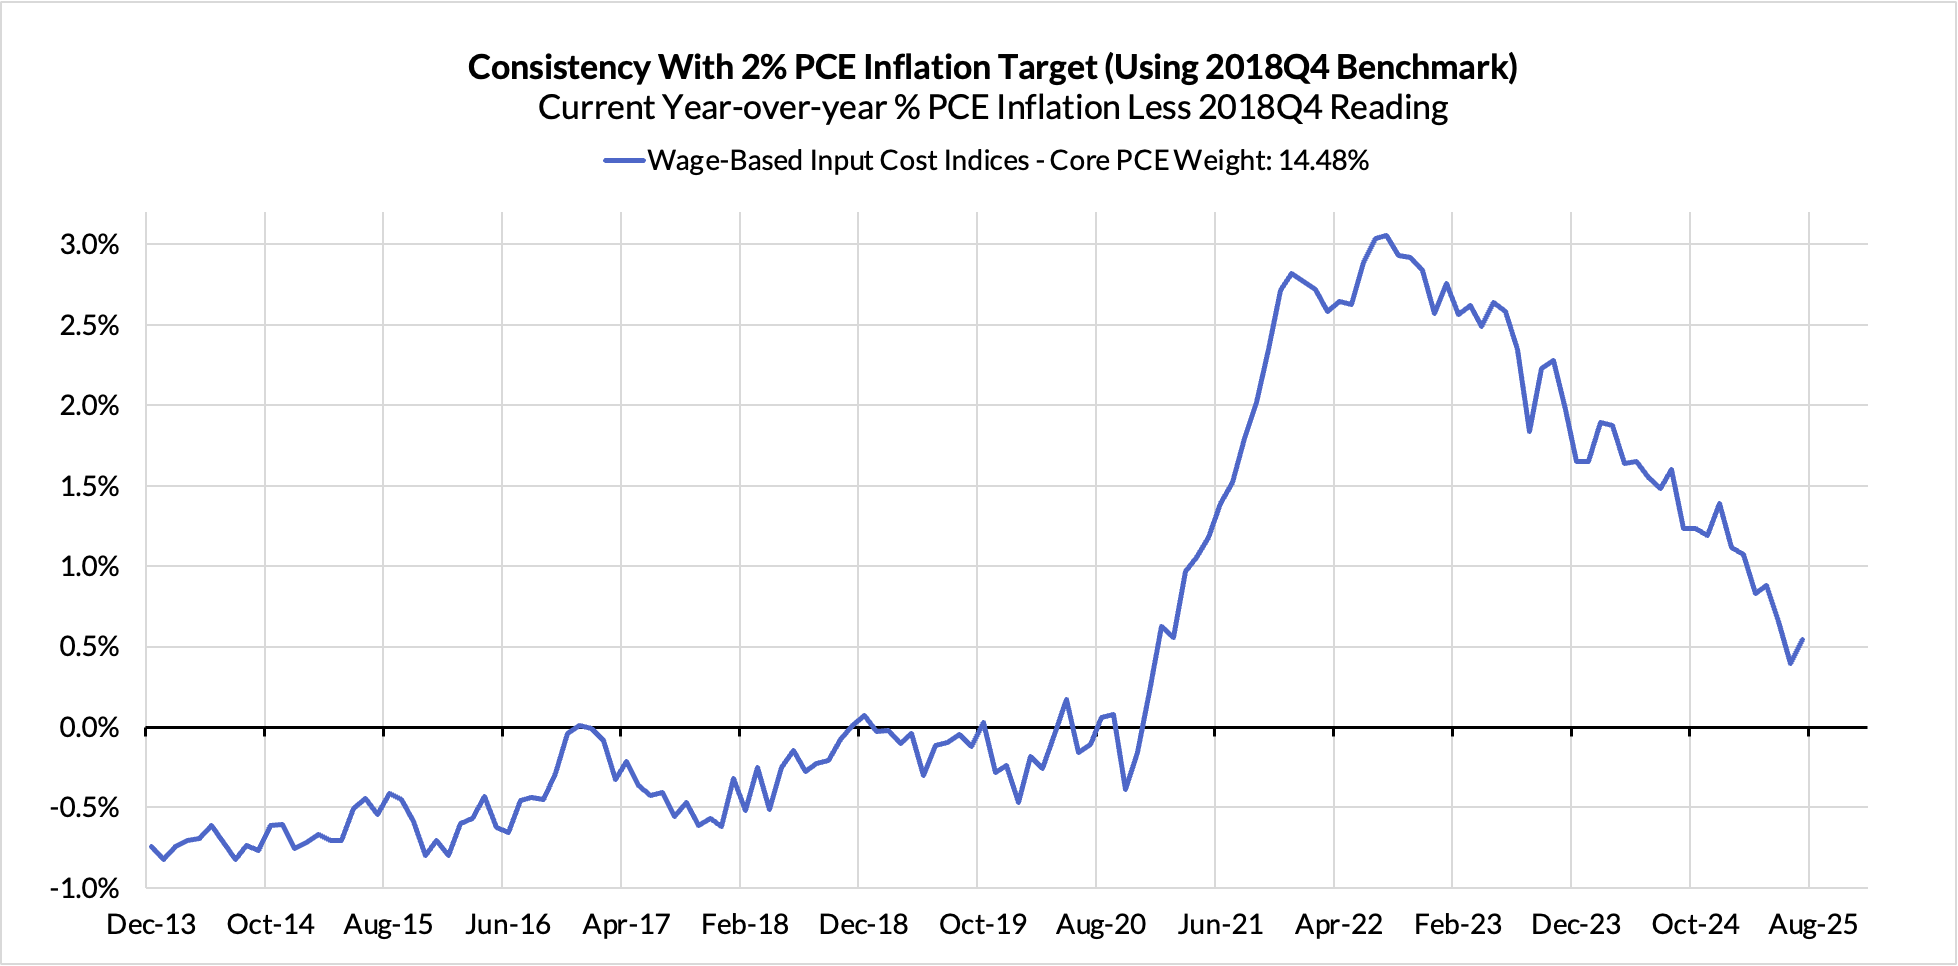
Contributions from input cost indices (wages in specific sectors where market prices don't exist) are now likely adding 7 basis points to the overshoot
Motor vehicle goods and services now accounts for 7 basis points of the overshoot.
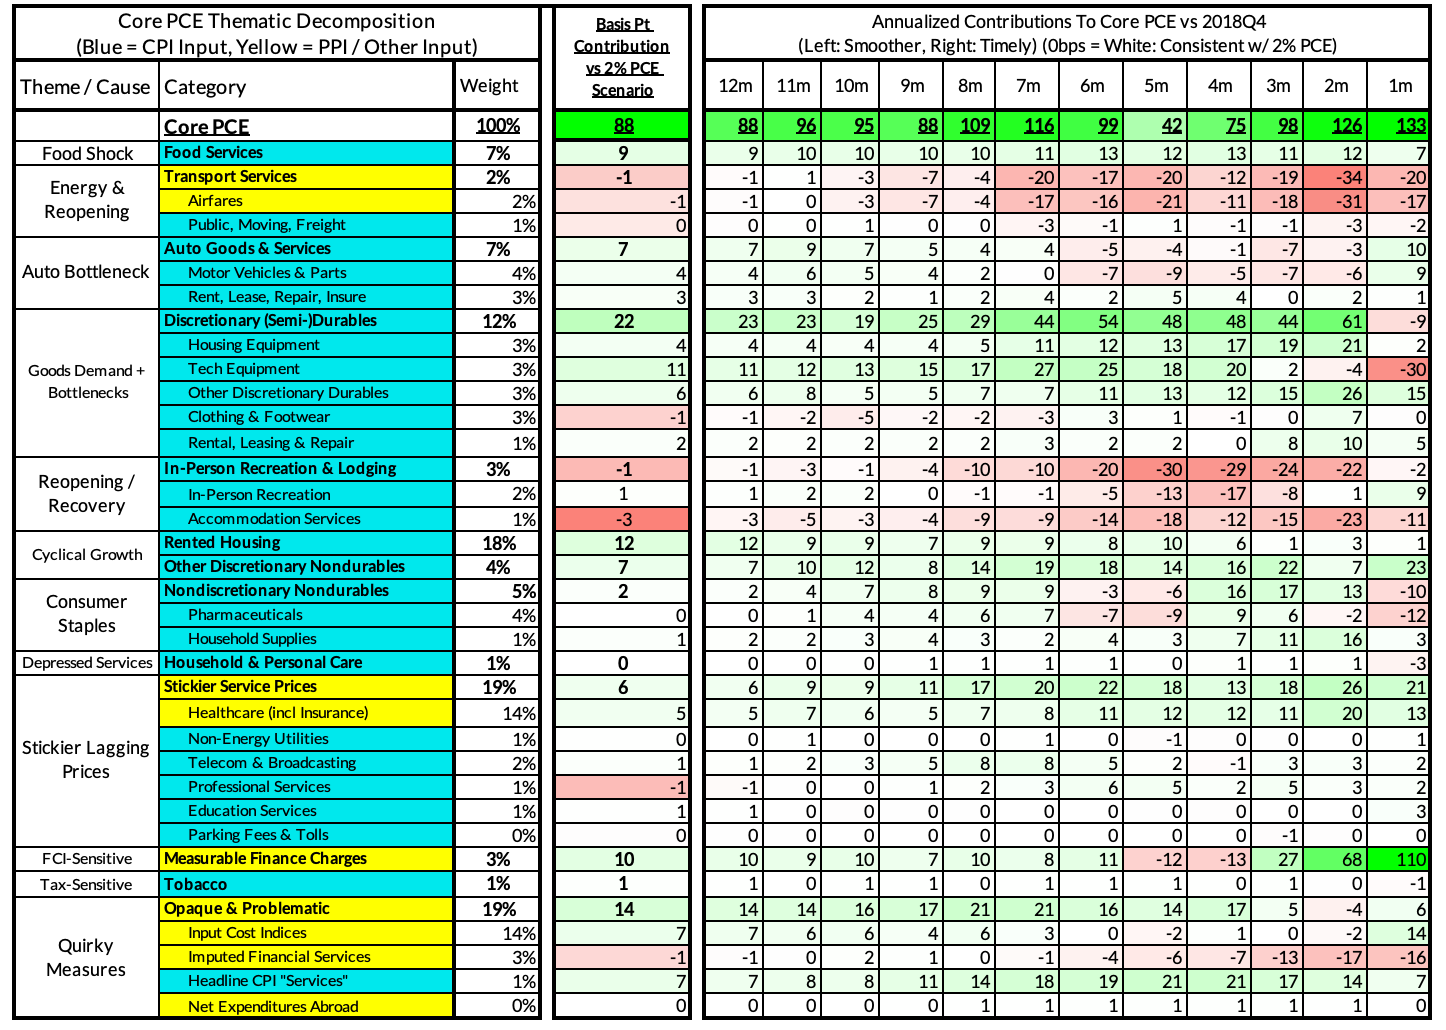
The final heatmap below gives you a sense of the overshoot on shorter annualized run-rates. July monthly annualized Core PCE ran at a 3.33% annualized pace, a 133 basis point overshoot vs 2% target inflation.
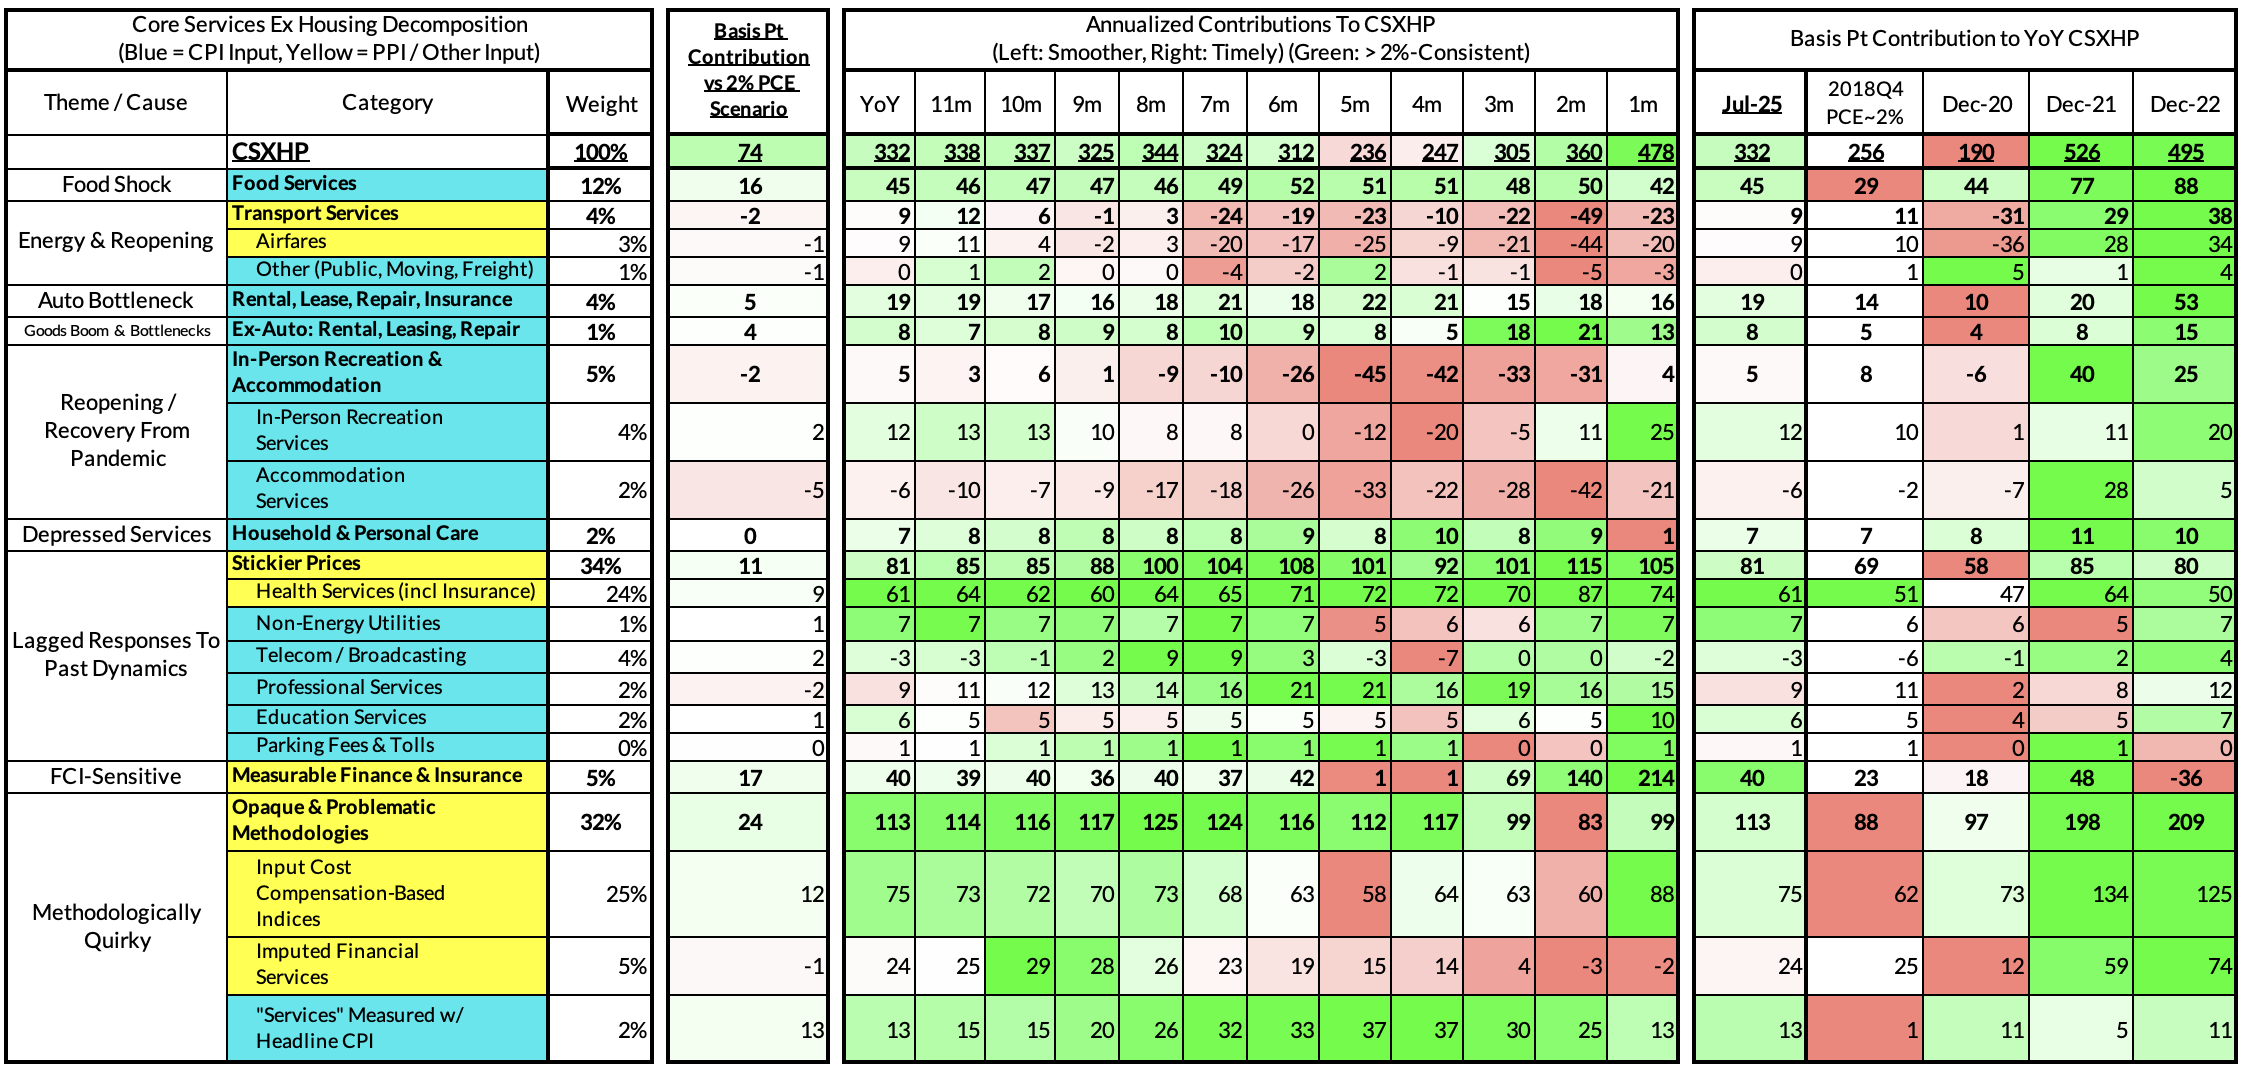
For the Detail-Oriented: Core Services Ex Housing PCE Heatmaps
The July growth rate in "Core Services Ex Housing" ('Supercore') PCE ran at a 3.32% year-over-year pace, a 74 basis point overshoot versus the ~2.59% run rate that coincided with ~2% Headline and Core PCE inflation.
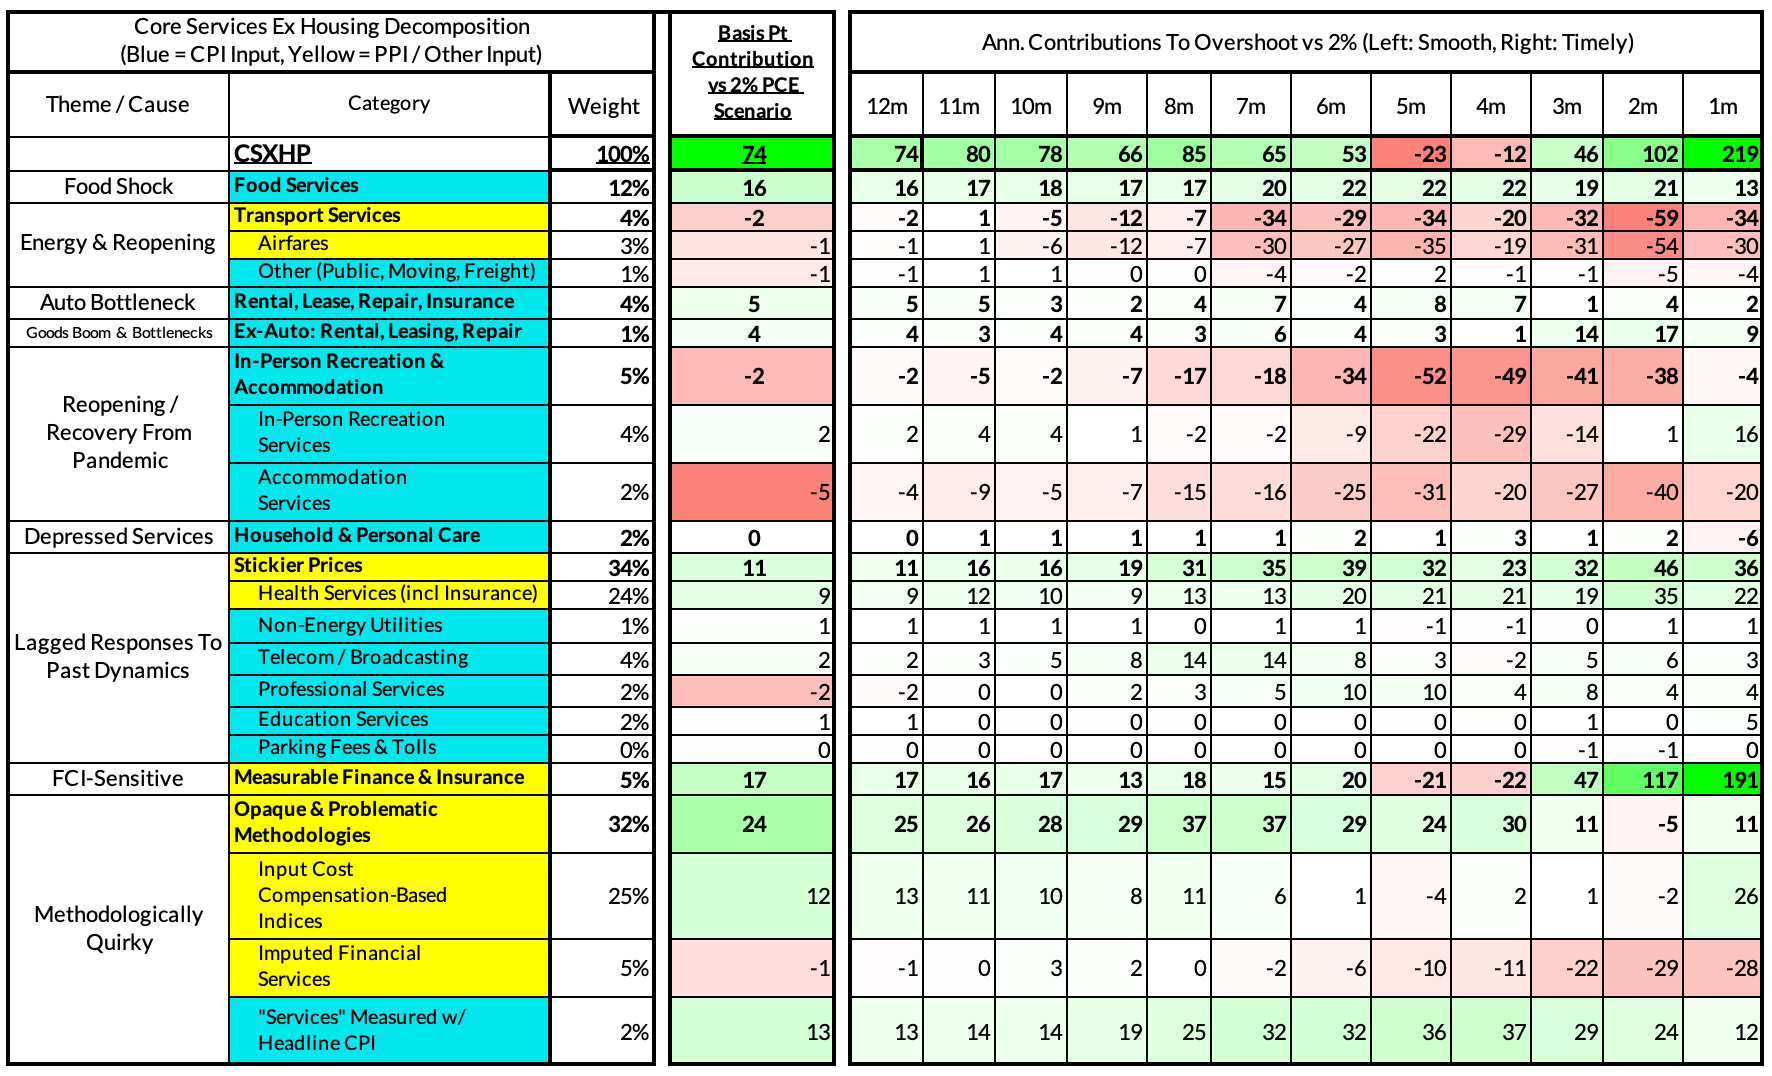
July monthly supercore ran at a 4.78% annualized rate, a 219 basis point annualized overshoot of what would be consistent with 2% Headline and Core PCE.
The link has been copied!
Your link has expired. Please request a new one.
Your link has expired. Please request a new one.
Your link has expired. Please request a new one.
Great! You've successfully signed up.
Great! You've successfully signed up.
Welcome back! You've successfully signed in.
Success! You now have access to additional content.