Kevin Warsh says he wants to "survey a billion prices," yet has embraced a trimmed mean measure (conveniently the most dovish signal) which asymmetrically throws out 55% of the basket and leans on lagging housing components. Symmetric, market-based ex-housing variants show upside inflation risk.
Note: With Warsh likely to be confirmed as Fed Chair soon, MacroSuite subscribers will be receiving more timely analysis and nowcasts of Trimmed Mean PCE inflation. If you're interested in becoming a MacroSuite subscriber, please reach out to macrosuite@employamerica.org
At his confirmation hearing before the Senate Banking Committee last week, Kevin Warsh stated his newfound preference in using “trimmed mean” measures of inflation to gauge underlying inflationary pressures. The timing of this pivot is awfully convenient considering (1) his previous statements criticizing data dependence, (2) him citing upside inflation numbers due to commodity shocks in the midst of a snowballing financial crisis in the late 2000s, and (3) trimmed mean inflation currently being one of the most dovish indicators of inflation.
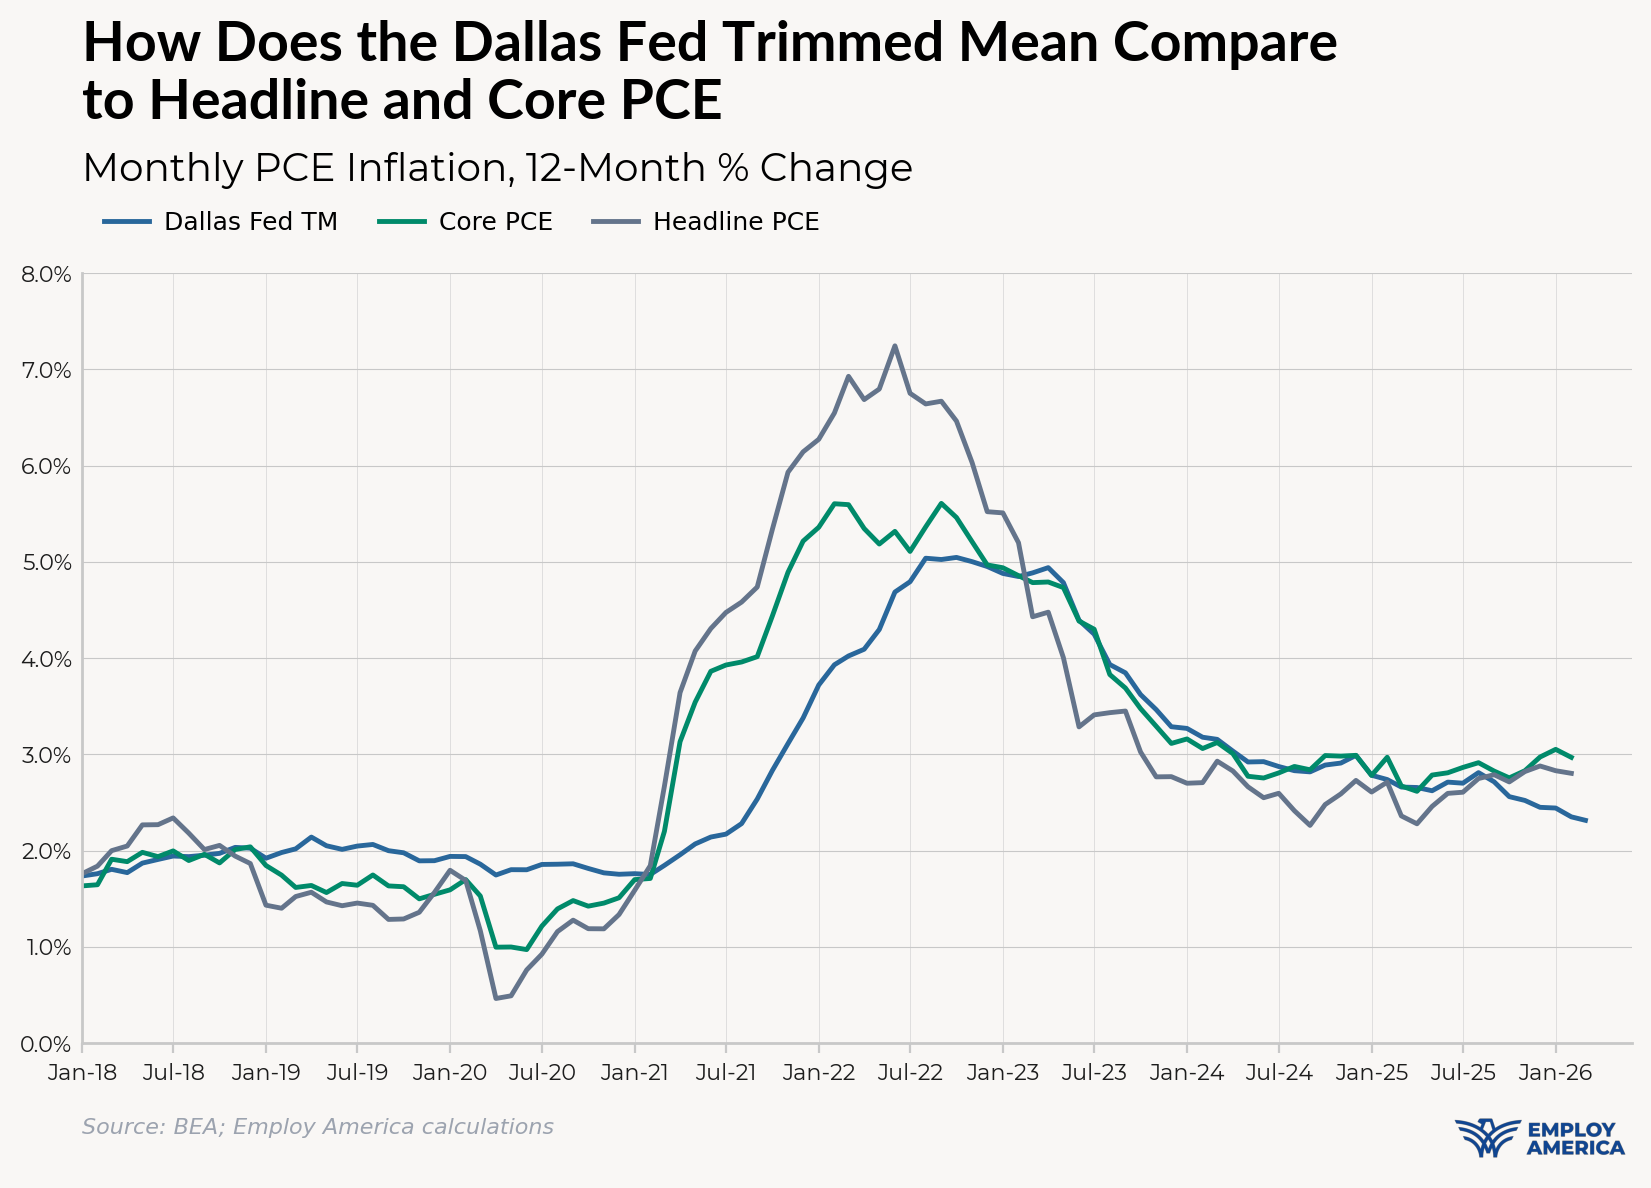
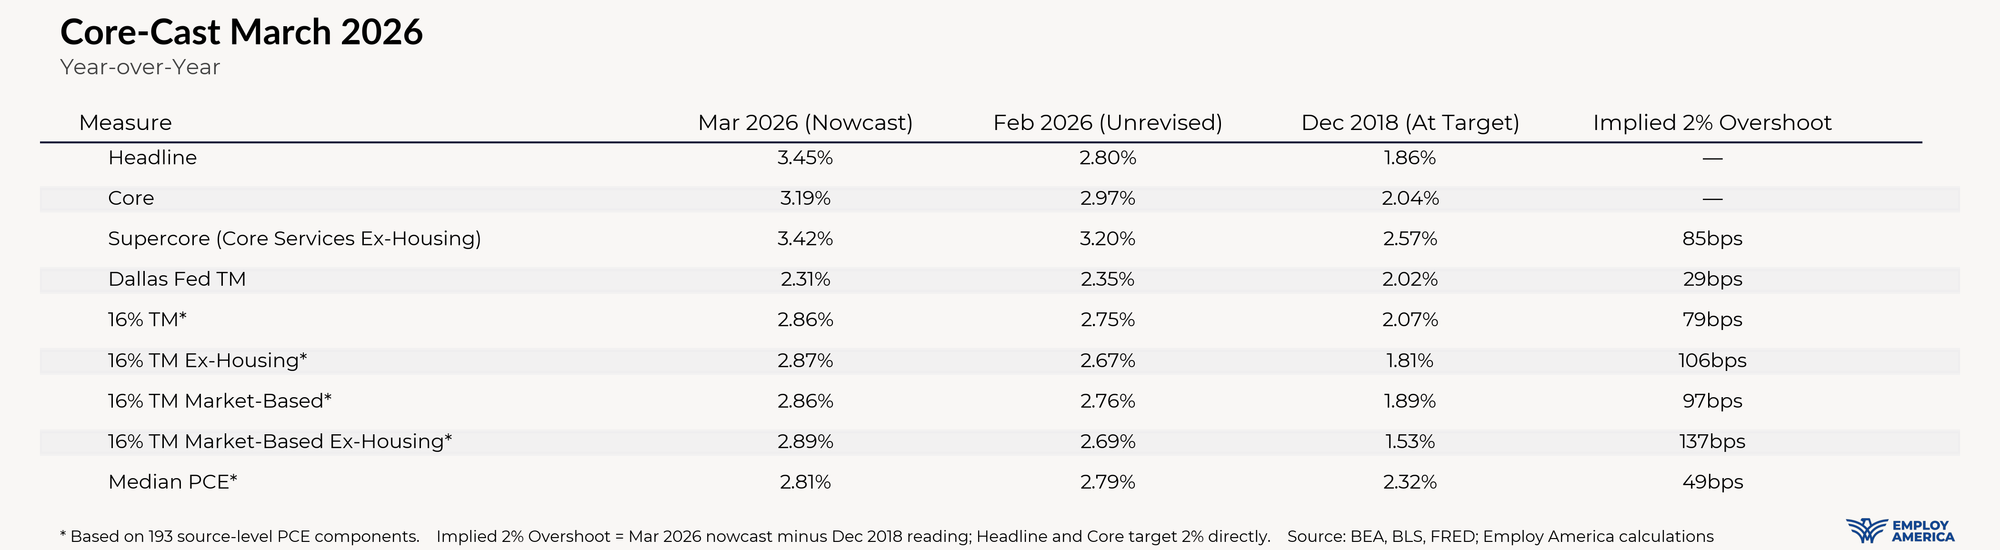
Warsh was presumably alluding to the Dallas Fed’s Trimmed Mean PCE measure, which paints a much rosier picture on PCE inflation than traditional core or headline measures. While headline and core PCE inflation are increasing and running at about 3% in recent months, trimmed mean PCE inflation came in at just 2.3% in February.
However, if one takes a careful look at how the Dallas Fed Trimmed Mean PCE measure is constructed, it becomes clear that there are issues that make it inappropriate to use this measure to evaluate inflationary dynamics today. The Dallas Fed’s Trimmed Mean PCE inflation measure takes 177 PCE components and orders them from least- to most- inflationary. It then aggressively trims more than half of the components (24% of the bottom and 31% of the top by PCE expenditure weight) and takes the mean inflation rate of the remaining components. The Dallas Fed measure lacks granularity in some areas[1]. The measure aggregates in places that don’t need it (e.g. they treat communication services as one component, rather than its six constituent components) while leaving separate lines for certain components that share a price index (e.g. new domestic autos and new foreign autos), creating inconsistencies within their measure.
Trimmed mean measures can be useful, but interpreting them correctly requires prudent methodological choices and robustness checks. If the Fed blindly trusts these measures as indicative of the underlying inflation trajectory, they risk misreading the current situation.
Pitfalls of the Dallas Fed Trimmed Mean PCE
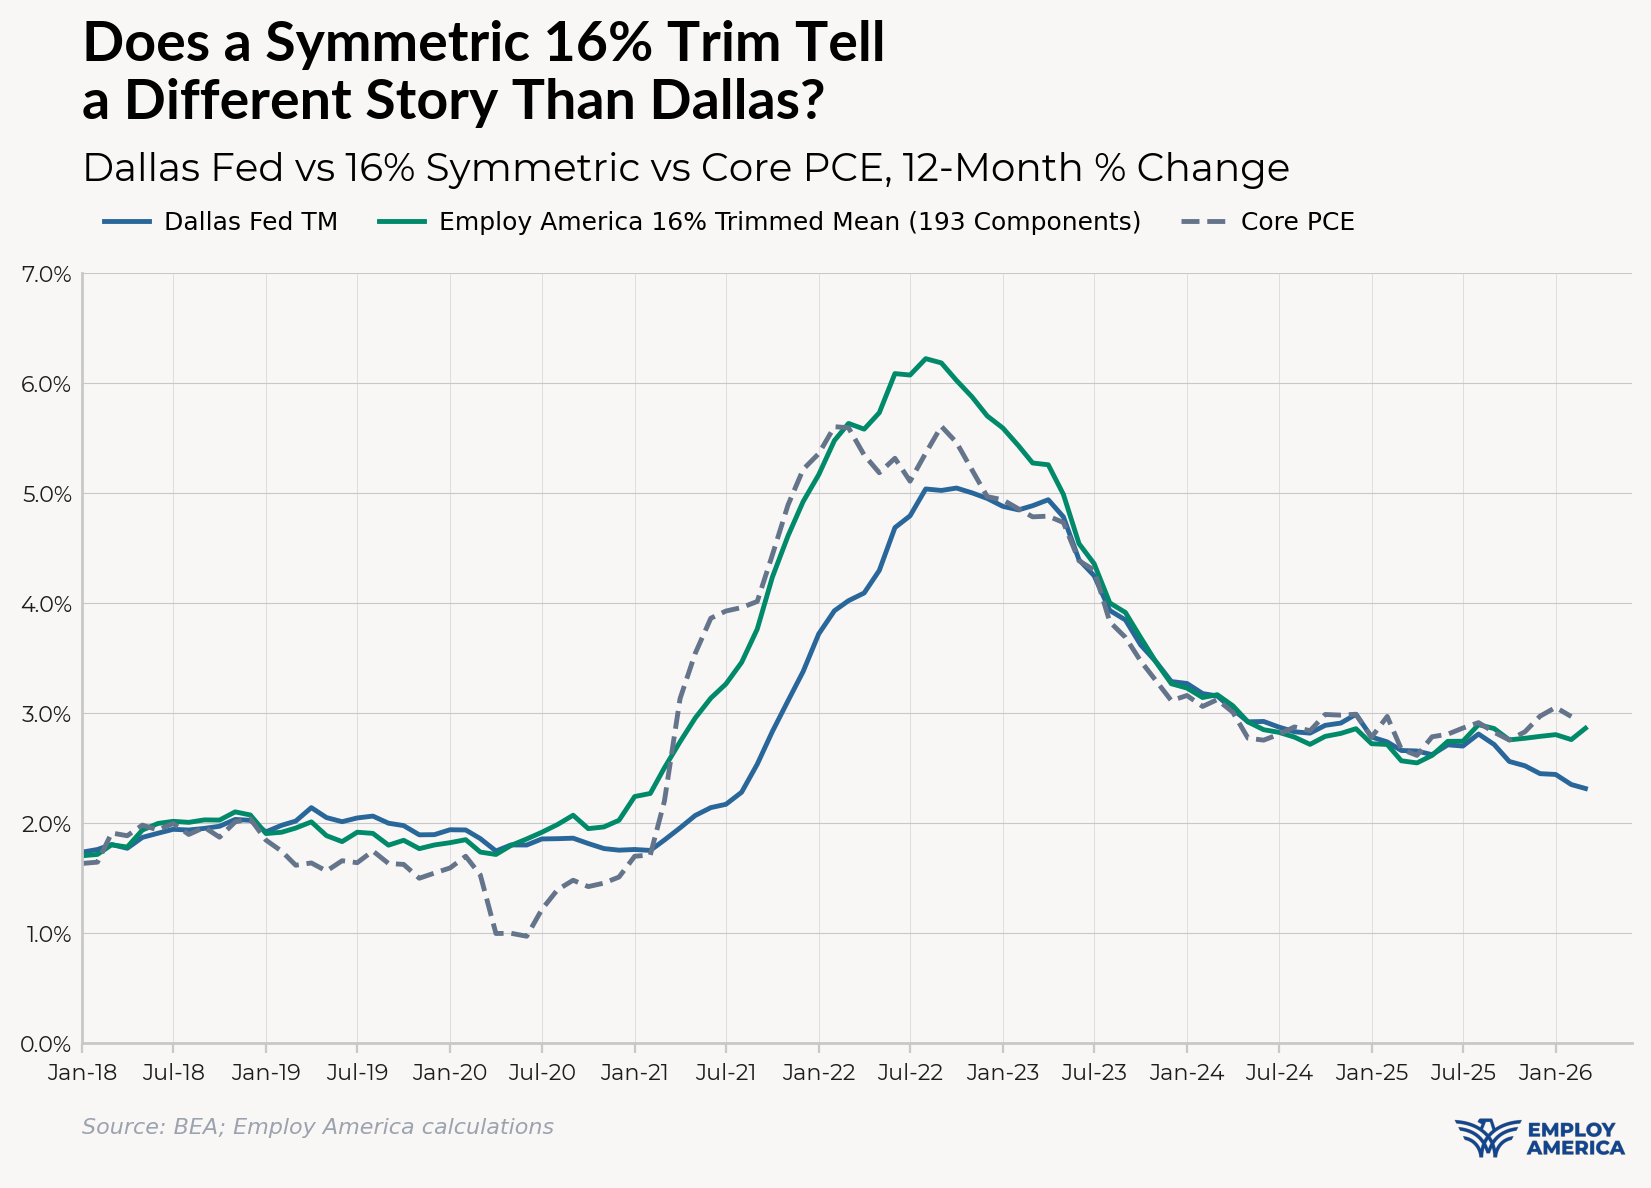
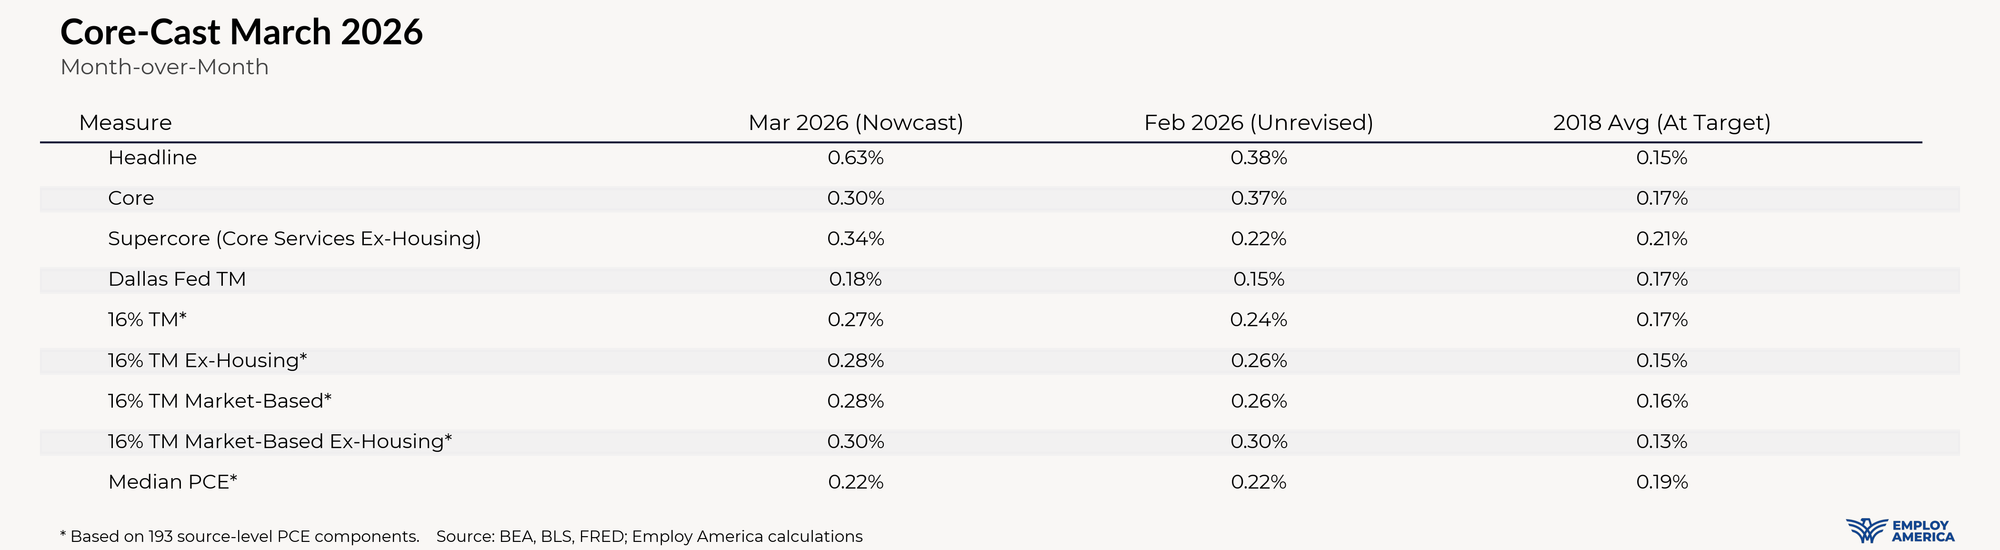
To address the issues stated above, we constructed trimmed mean measures from 193 PCE components that reflect source-level estimates from the Consumer Price Index, the Producer Price Index, and BEA-level indices. and applied the Dallas Fed’s methodology as well as symmetric trims of 16% (which is what the Cleveland Fed uses for their Trimmed Mean CPI), 32%, 48%, and 64%, and compared them to the Dallas Fed Trimmed Mean and Median PCE readings.
Symmetry Matters
Comparing a 16% symmetric to the asymmetric Dallas Fed shows a stark divergence in both timing and magnitude. The rationale for Dallas’ asymmetric trim is an assumption that the right tail is inherently more noisy than the left tail. While this trim may have worked during the consistent undershooting of inflation pre-pandemic and when the economy was decades of consistent goods deflation, it has not proven as robust over time.
Trim Magnitude Matters
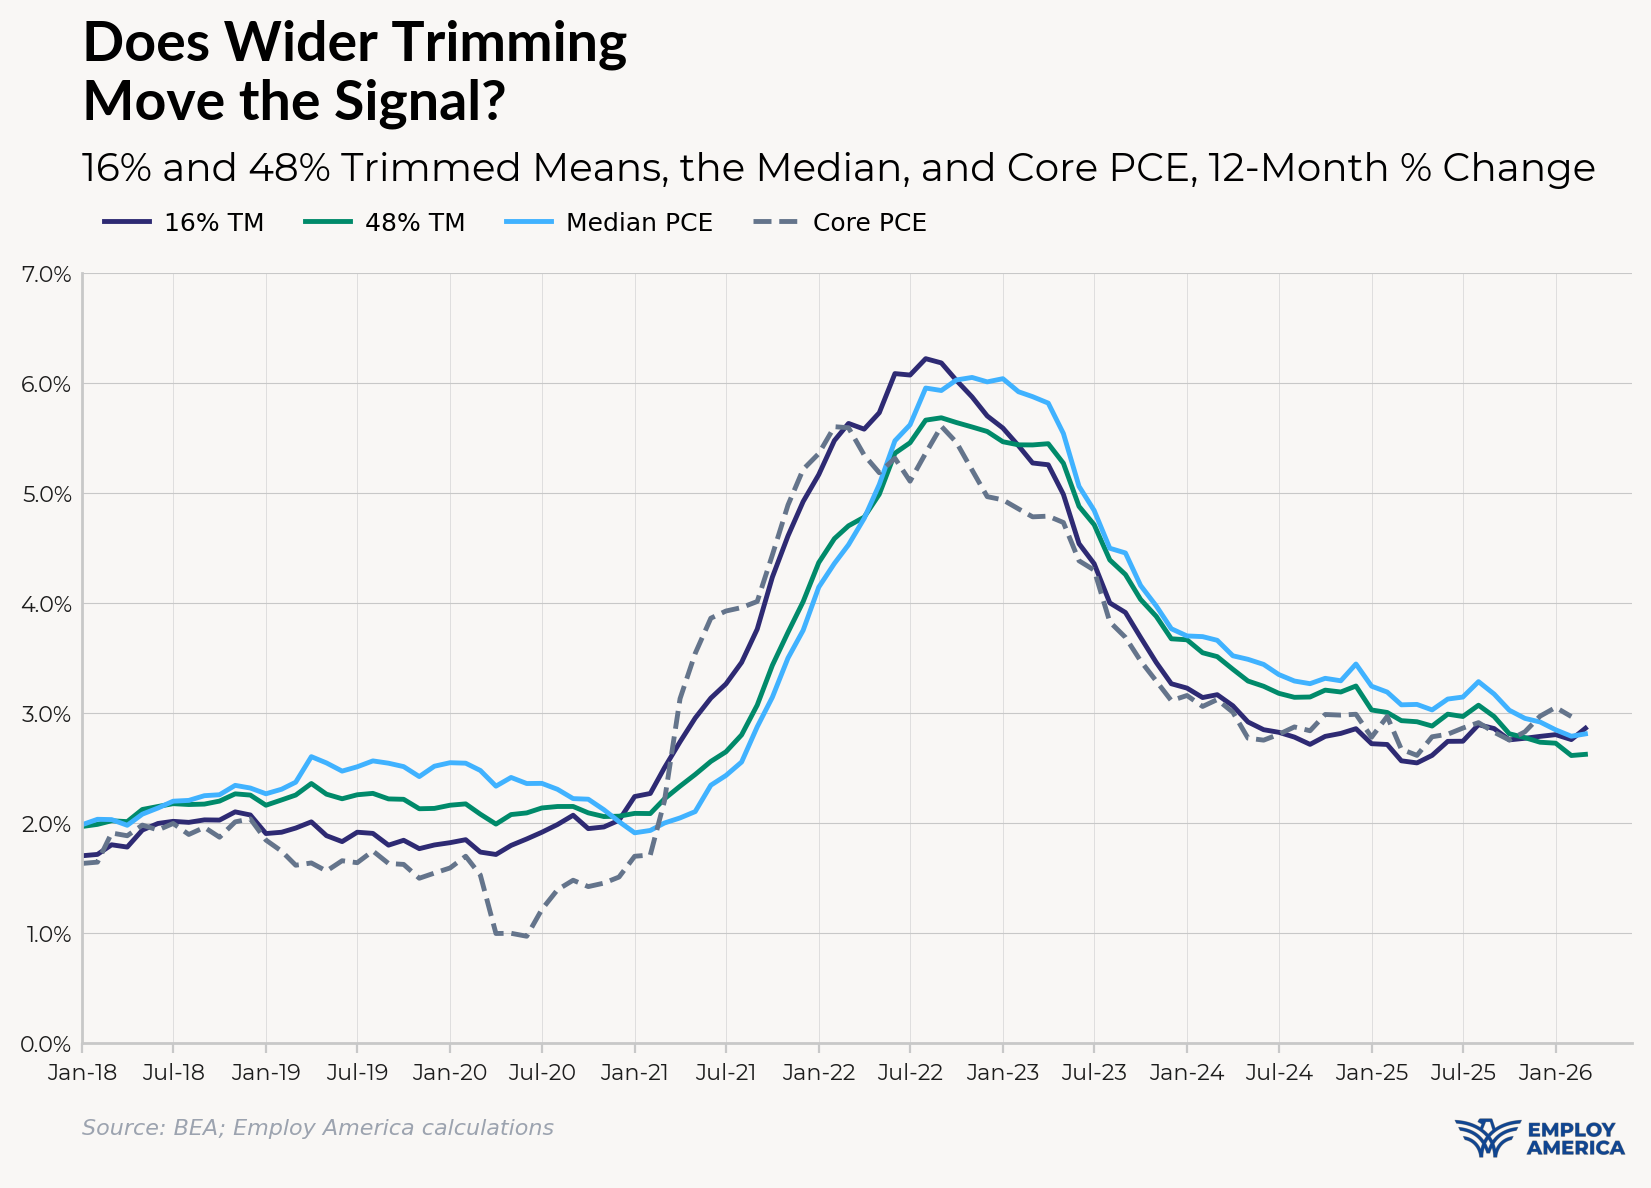
Cutting off 55% of the weight of the basket makes the Dallas Fed's measure closer to a median than a true trimmed mean. By throwing out more than half of the measure, the signal becomes hostage to which handful of components happen to land in the narrow kept window in any given month, rather than reflecting where the broader basket is heading. Conversely, narrowing the trim introduces too much noise. The 16% trim used by the Cleveland Fed is the most defensible anchor to extract the most robust signal, as the charts below demonstrate.
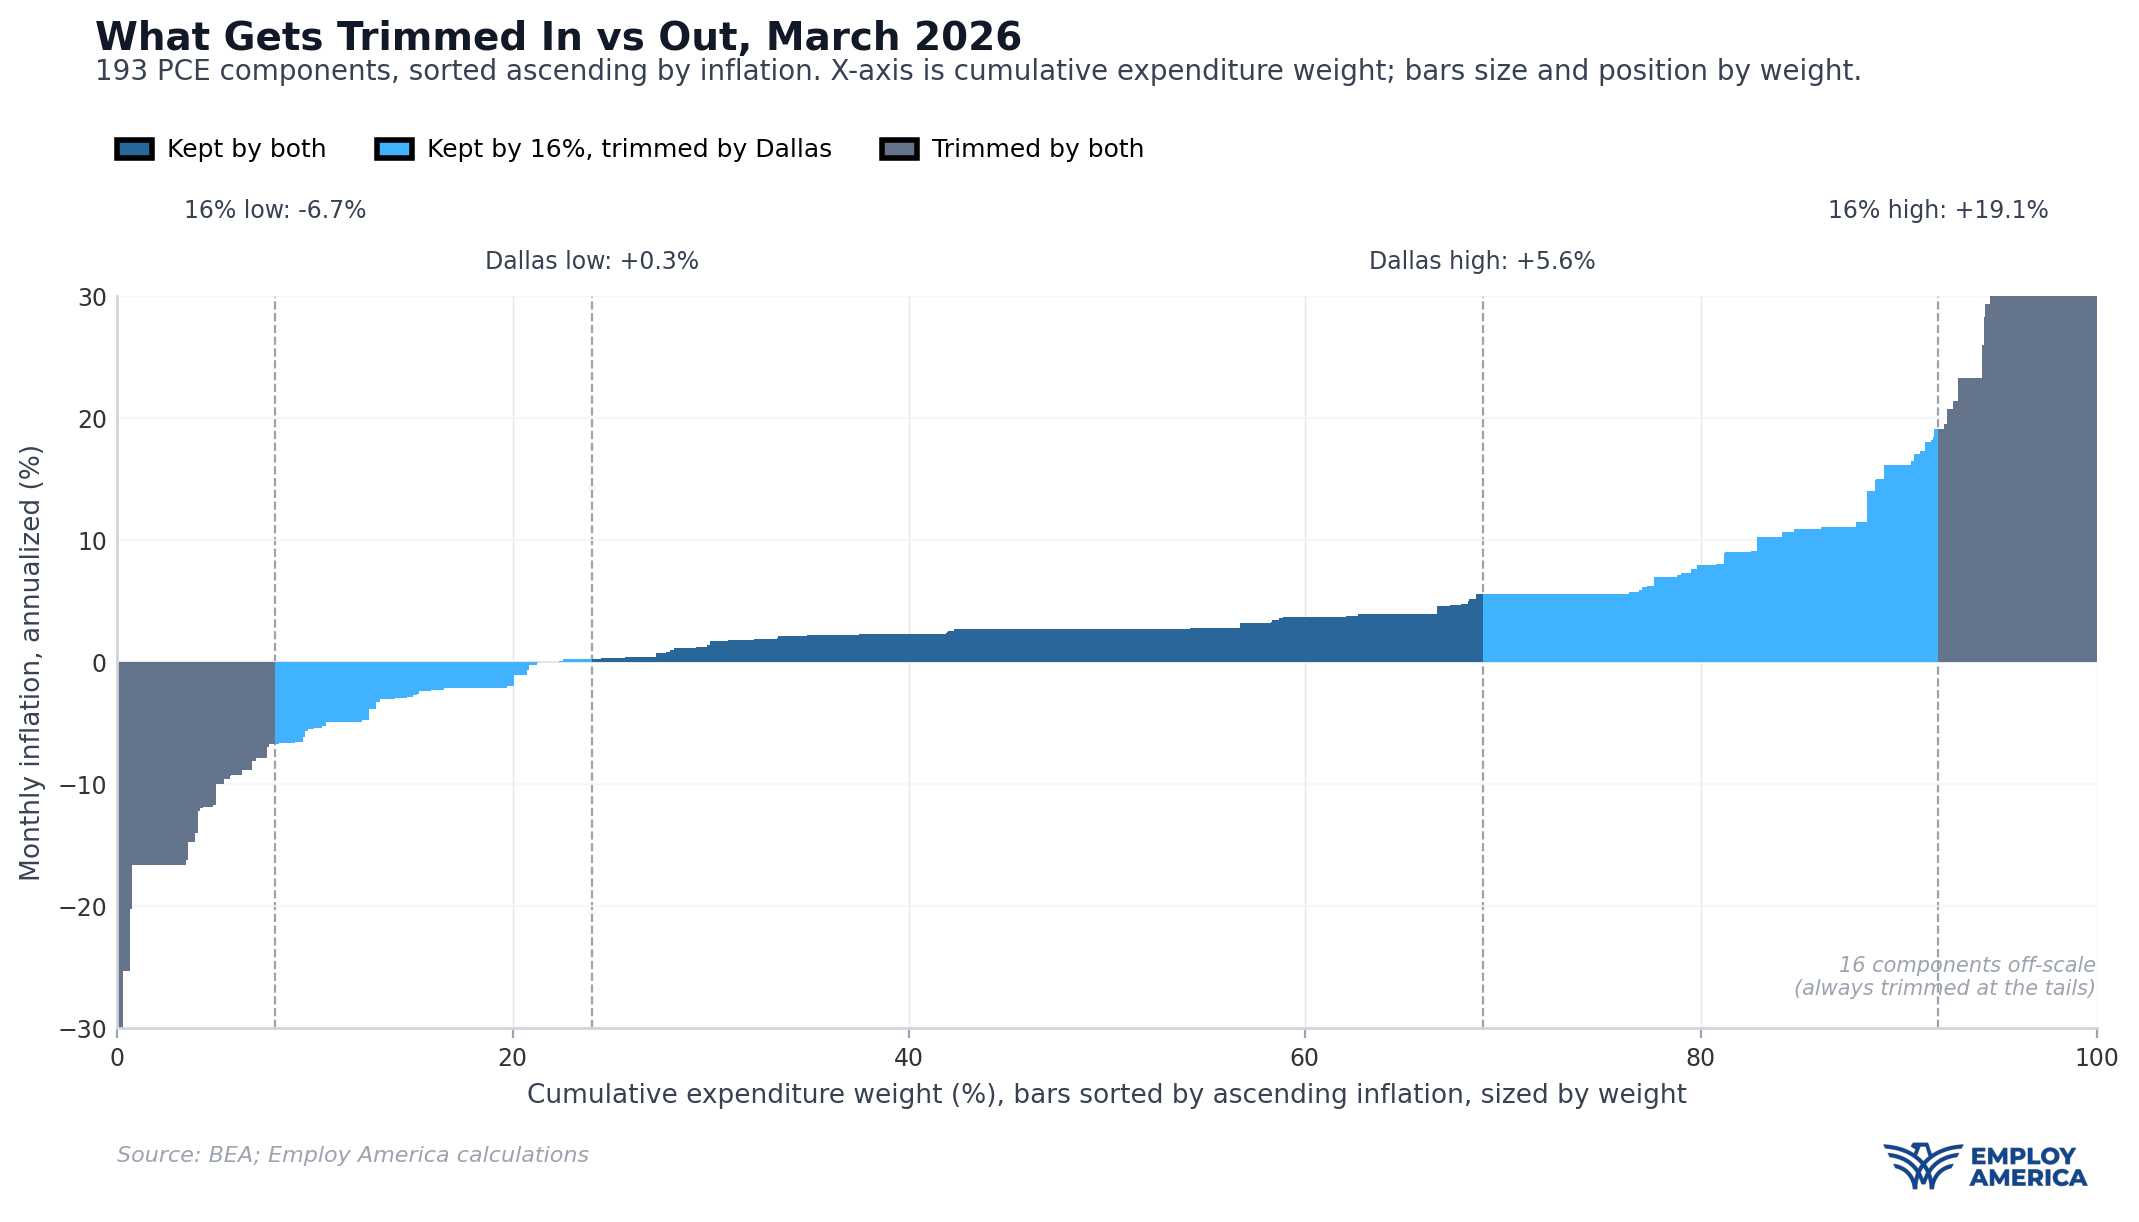
The chart below demonstrates the skew problem in the Asymmetric Dallas Trimmed Mean measure.
Problematic Components
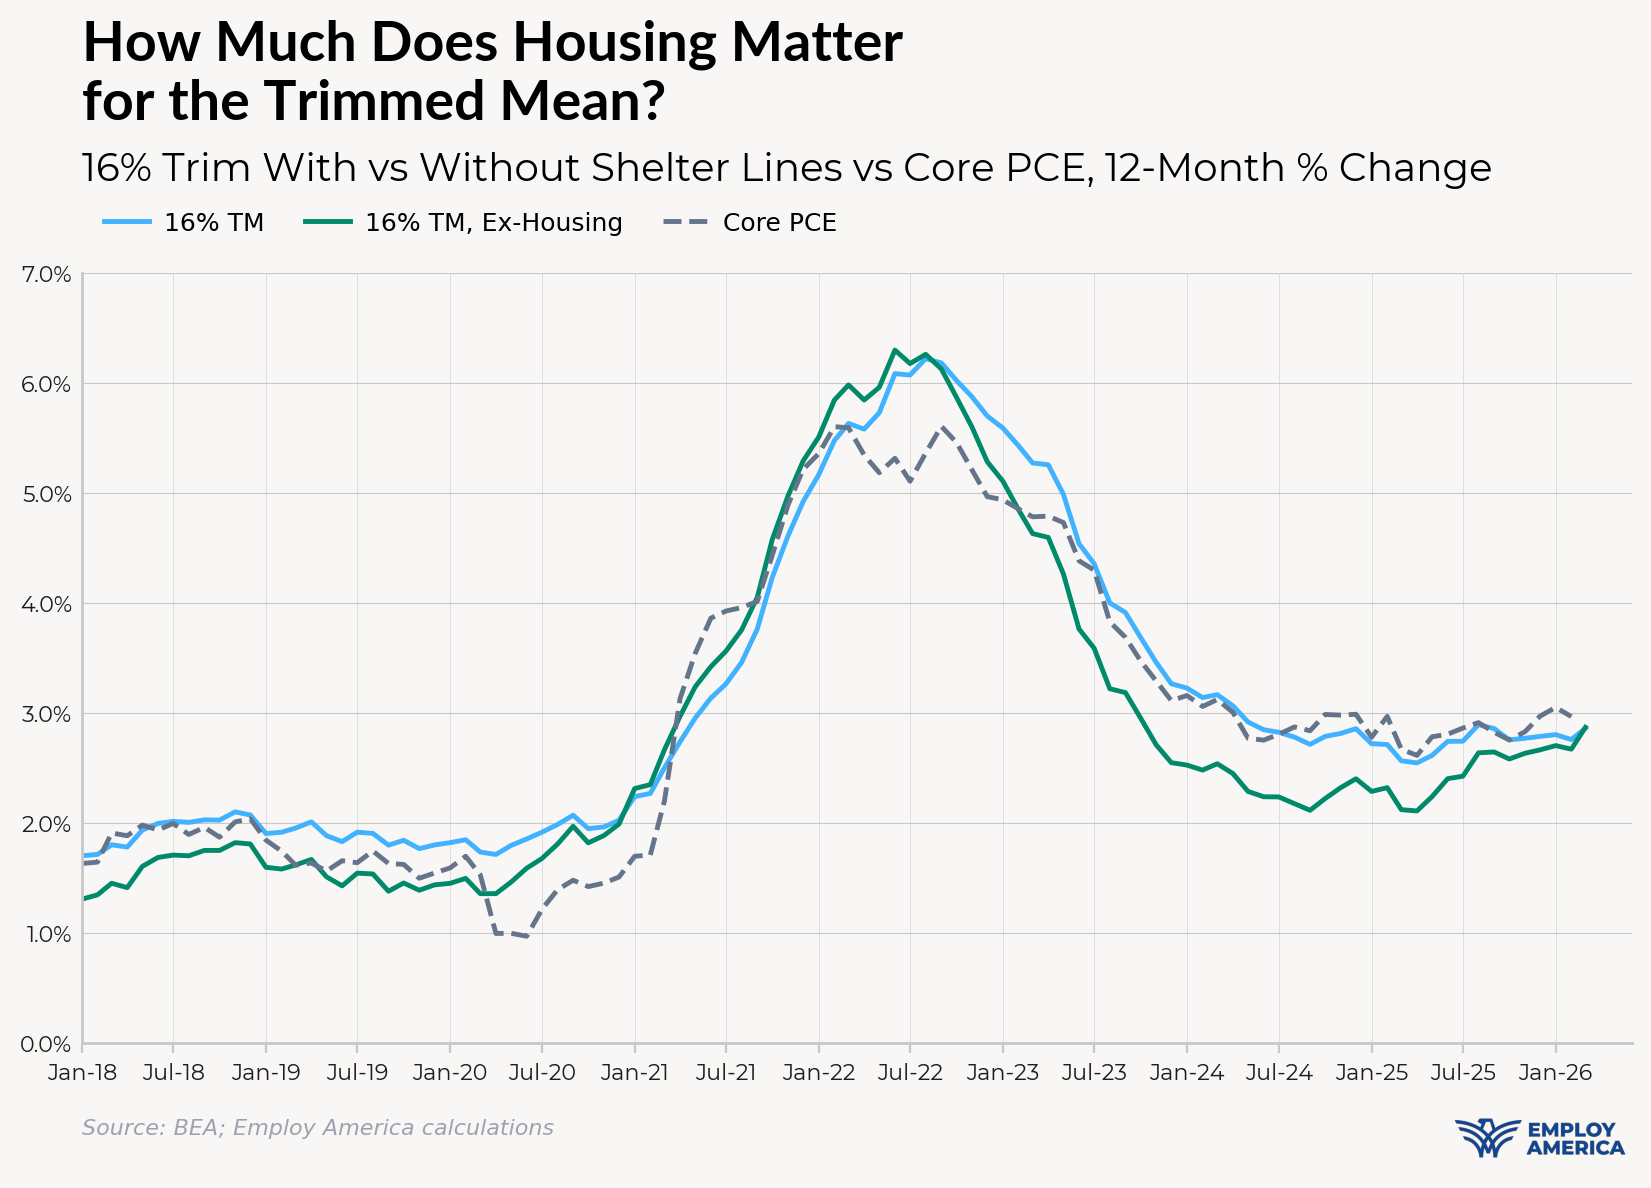
Housing
Kevin Warsh professed an aspiration to “survey a billion prices” to ensure that no single price or dynamic can dominate the evaluation of true underlying inflation process. That is a worthwhile aspiration, but if taken seriously, it also means avoiding putting excessive weight and leverage on two interrelated components from the CPI housing survey.
Housing components have been particularly problematic measures throughout the post-pandemic run of inflation for a few reasons. (1) They are primarily just two highly related components of PCE – rent of primary residence CPI and owners’ equivalent rent (OER) CPI – with highly concentrated weights exceeding 15.5% of headline PCE inflation, (2) they are based on rent data that lags market rent data by approximately 18 months, and (3) owner’s equivalent rent is an imputed measure of what home owners would pay if they were to rent their own homes, not what households actually pay to service their home. These issues are known to the Fed, which is why the measure of Core Services Ex-Housing (supercore) has become an oft-cited measure to gauge the direction of underlying inflation.
For the sake of robustness, assessments of underlying inflation need to avoid being overly sensitive to any single component or methodology choice. To account for these issues, we have constructed “Ex-Housing” versions of our symmetric 16% Trimmed Mean PCE series that exclude these two CPI-based components when making the trimmed mean calculation.
The chart above demonstrates a few key divergences that highlight the value of this robustness check.
Prior to the pandemic, the Ex-Housing 16% trimmed mean underperformed its housing-inclusive variant and the Dallas Fed trimmed mean. At a time when Headline and Core PCE were close to 2% in late 2018 and early 2019, Ex-Housing trimmed mean inflation ran about 0.3% lower. “Target-Consistent” Ex-Housing 16% trimmed mean PCE is probably closer to 1.7%.
Even by late 2020, the Ex-Housing 16% trimmed mean showed clear acceleration by almost a full percentage point, providing one of the earliest signals of upside inflation risk. Contrast that with the Dallas Fed Trimmed Mean, which was mildly decelerating and proved to be one of the most lagging inflation indicators during the post-pandemic inflationary episode.
Both the housing-inclusive and Ex-Housing 16% trimmed means began falling in August 2022, roughly half a year before the Dallas Fed variant began signaling disinflation, but the Ex-Housing variant actually showed faster disinflation that persisted through October 2024.
We are witnessing a similar divergence now to what we saw in 2020: the Ex-Housing 16% trimmed mean continues to accelerate, now up to 3%, the housing-inclusive 16% trimmed mean has held steady but at a more elevated rate, and the Dallas Fed trimmed mean is disinflating.
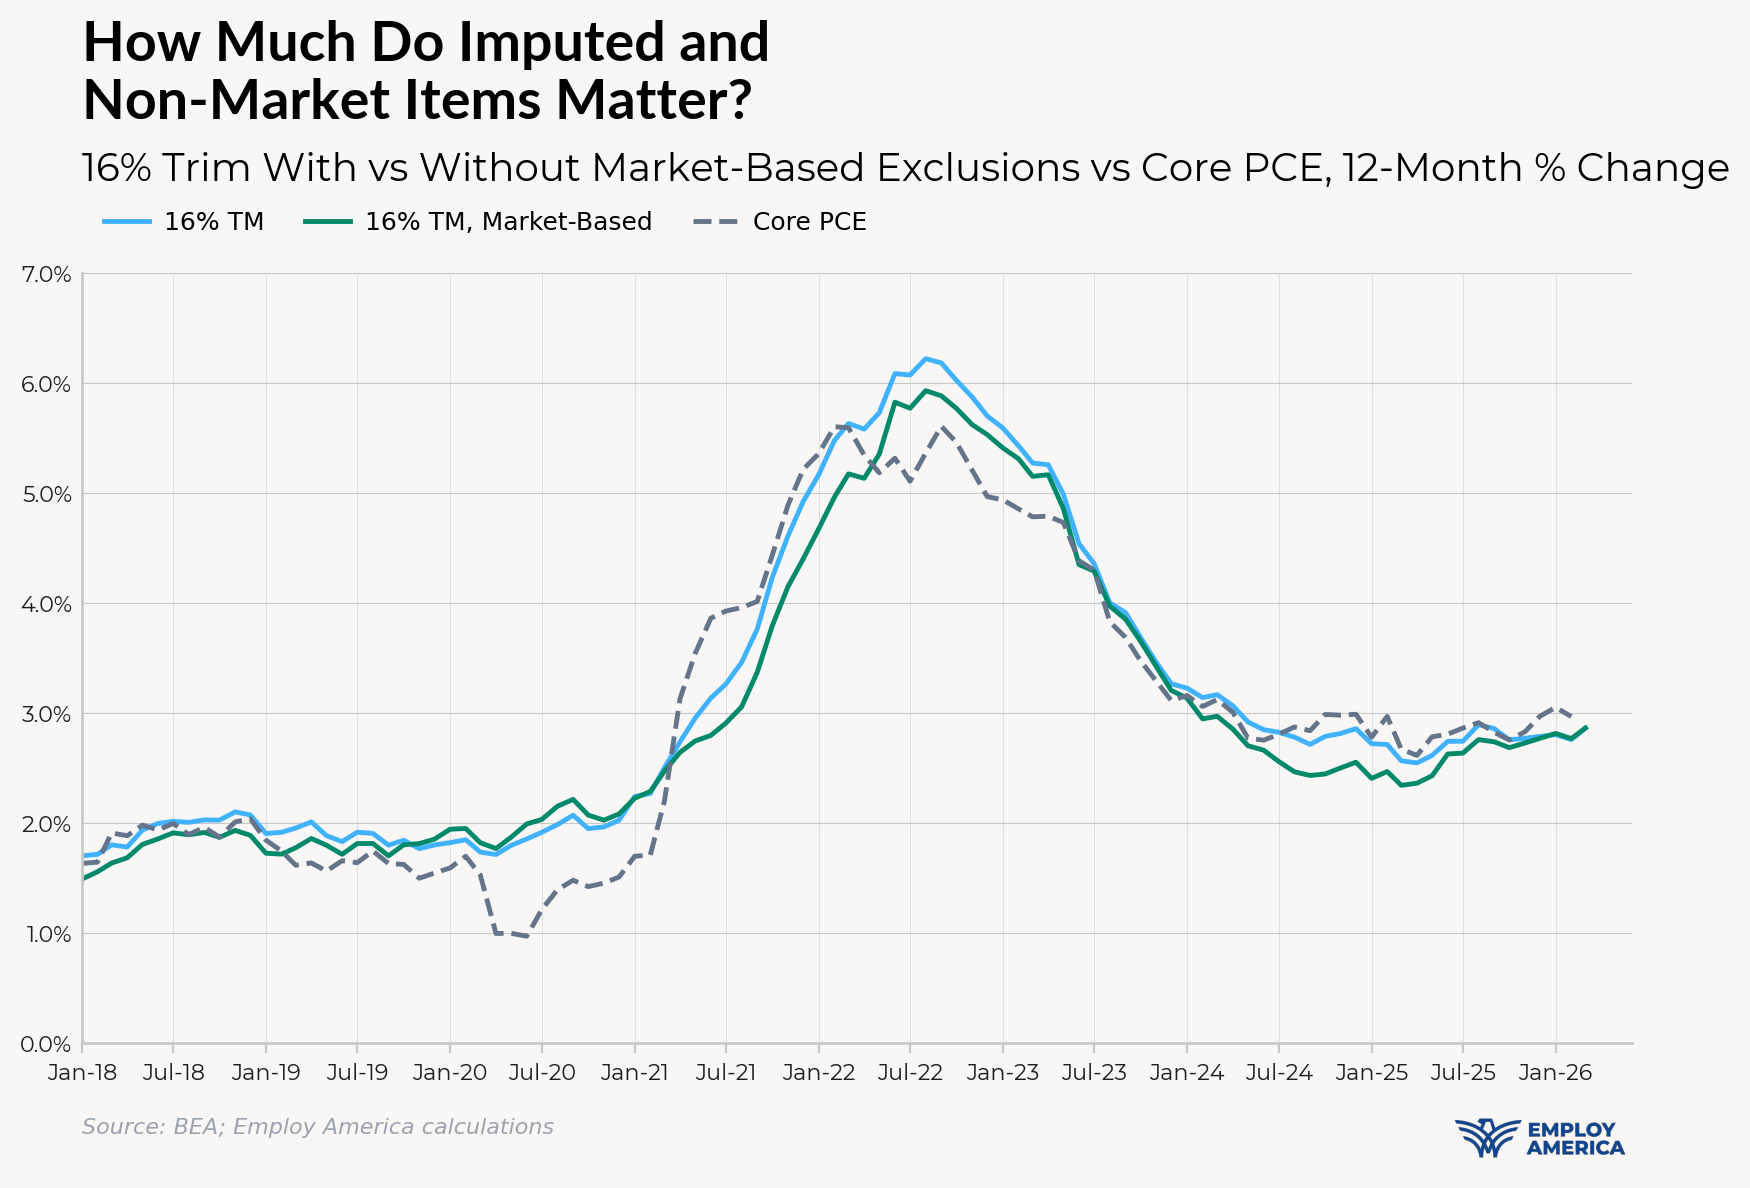
Other Problematic Methodologies
A little over 14% of PCE is measured by similarly quirky imputed costs, or else of opaque wage-based deflators. Like housing, these measures lag market-based price pressures and are not anchored in market-level price observations. These measures are officially classified as not being “Market-Based,” and, like housing, these measures can cause trimmed mean gauges to lag.
As the chart above shows, both a comprehensive 16% trimmed mean and one of just Market-Based components are directionally similar and signal elevated inflationary pressures currently. A trimmed mean of just market-based components actually shows more persistent disinflation through late 2024 and early 2025, but it also shows more material acceleration since that time and all the way through to the latest data for March 2026.
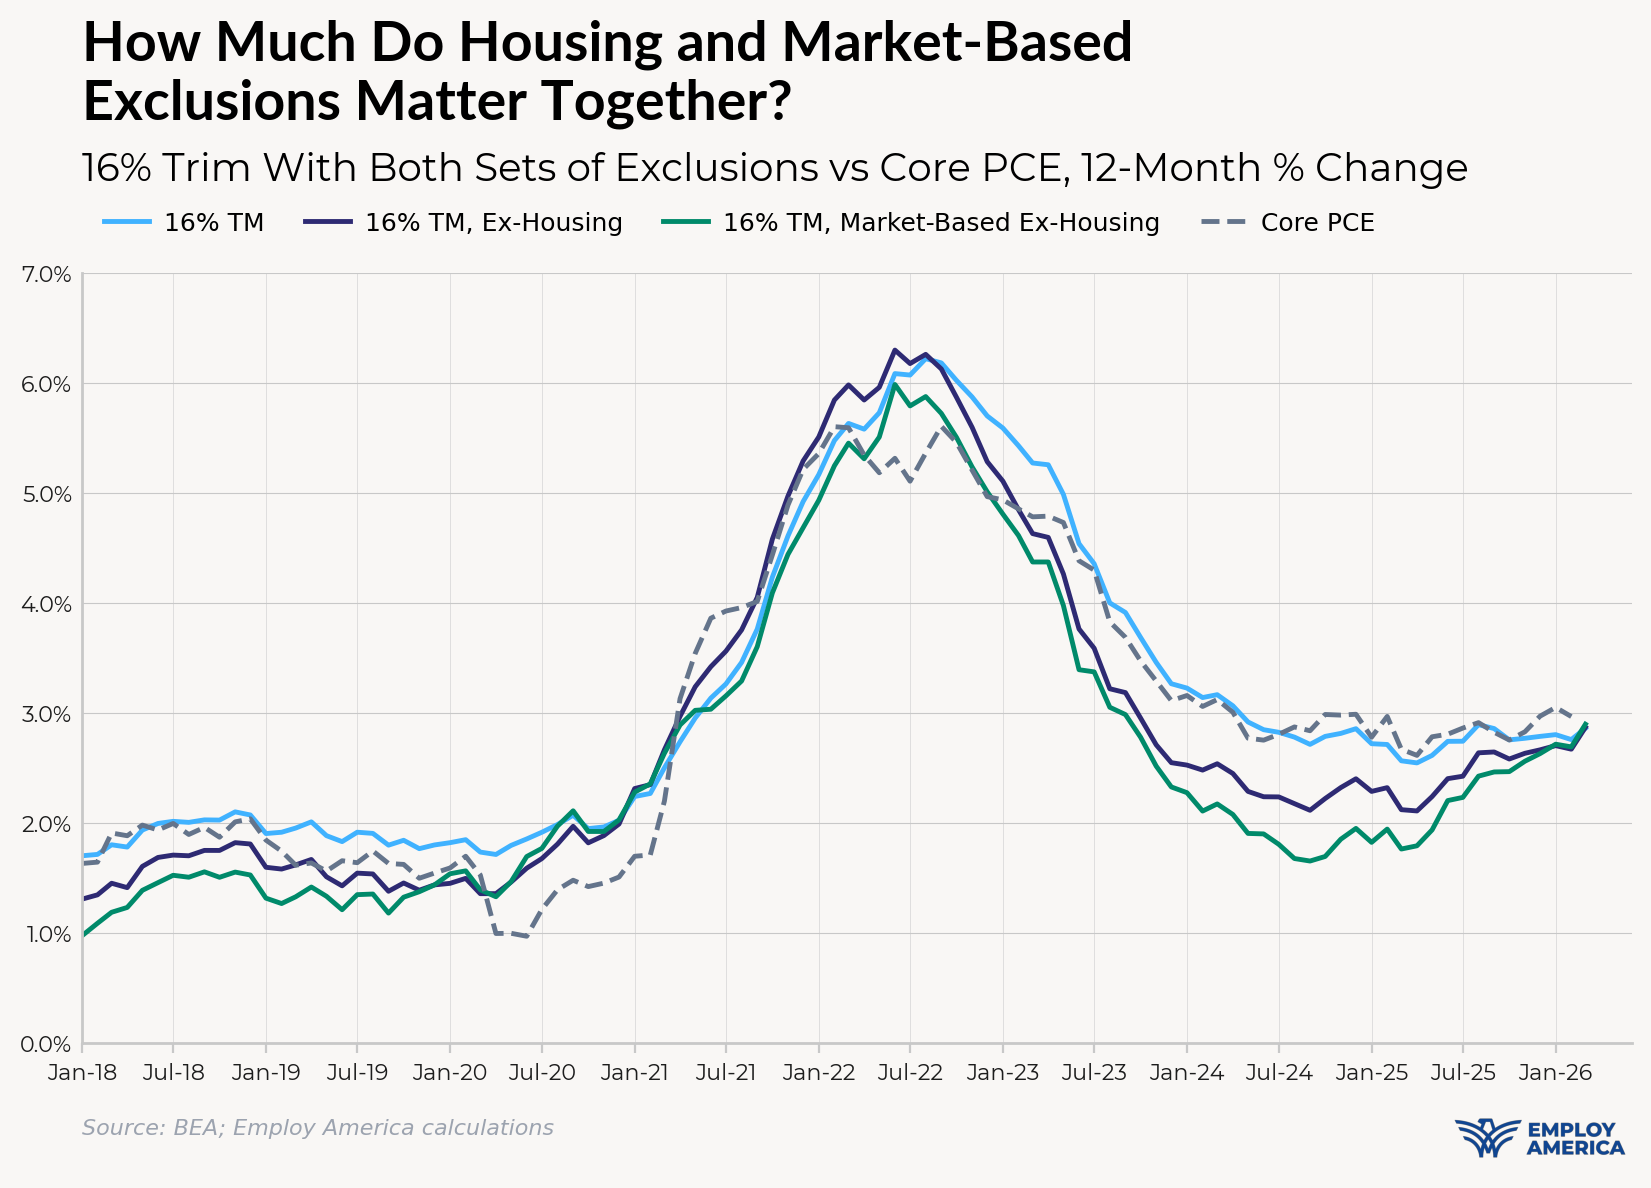
Market-Based Ex-Housing
A trimmed mean of Market-Based Ex-Housing source components can give us a clean picture of the actual inflationary pressures observable in market-based transactions.
The Market-Based Ex-Housing 16% Symmetric Trimmed Mean shows the most timeliness of the trimmed mean measures we have surveyed, picking up inflationary upside risk in late 2020, disinflating in the early summer of 2022, but also showing more material acceleration in 2025. Meanwhile, the Dallas Fed Trimmed Mean has been signaling disinflation. All gauges come with tradeoffs, and in this case, there is a definite tradeoff between timeliness and stability. A timely inflation gauge risks being too noisy, while a stable inflation gauge is likely to be slower to respond to major shifts in inflation.
Conclusion
We aren’t supportive of the Fed switching the gauges it uses to evaluate its ability to hit the inflation target mid-cycle; that looks too much like goalpost-shifting. Nevertheless, we do see value in the FOMC looking at symmetric trimmed mean PCE measures alongside other inflation indicators.
To the extent additional indicators are elevated responsibly, we are in full support. But responsible usage means avoiding some of the pitfalls that the Dallas Fed Trimmed Mean specifically falls victim to.
The Fed should avoid asymmetric engineering of trimmed mean cutoffs just to match a realized or expected distribution of price changes. Whatever cutoffs the Fed thinks prudent to apply, the intuitive and robust approach over time requires symmetry and agnosticism.
Avoiding excessive censoring of price changes is important for ensuring trimmed means capture the full set of timely information that stems from the shifting distributional skew of price changes. The purpose of trimmed mean is to strip out true outliers and one-offs. Trimmed means should still be able to capture key shifts that may be occurring at the 20th or 80th percentile of the distribution.
Robust evaluation of trimmed means requires being mindful of which methodologies get elevated. Housing is an especially high-weight component, as are the non-Market-Based ones. These components inherently create lags in trimmed mean gauges because these price estimates are not rooted in market-level price observations. As a result, timeliness is sacrificed and gauges risk excessive sensitivity to methodological quirks.
If we are to take the trimmed mean approach seriously, symmetrically, and robustly across multiple specifications, it does not appear to be giving a signal all that different from the Fed’s main real-time inflation gauge, “Core PCE,” which has always excluded price changes to food and energy. There has been a sneaky acceleration visible since at least early 2025, though much of it might be attributable to “one-off” tariff-induced increases (we won’t use the other dreaded “T” word). Of course, there is a risk that other inflationary dynamics are also at play and that is part of why Trimmed Means are useful. The AI boom may be inducing bottlenecks that raise prices of consumer goods, and key service prices may be among the most sensitive to the commodity-price shocks related to the Strait of Hormuz closure in March.
Whatever inflation gauge a Fed Chair or other FOMC member chooses to elevate, it should be rooted in a desire to better understand the inner-workings of the macroeconomy. No gauge is perfect, and good-faith dialogue always benefits from new ideas and fresh perspectives on macroeconomic data. We hope that the emphasis on the Dallas Fed Trimmed Mean gauge is not borne of a political convenience to cherry-pick “the most dovish inflation summary gauge available.”
[1]: There are a very narrow group of PCE sub-aggregates and components that involve a complicated "netting" of expenditures that make their price index estimation not directly feasible. These components involve non-market-based price data, and have been excluded from our trimmed mean estimations for the time being (they are also excluded from the Dallas Fed's methodology). If they were partially and incompletely incorporated, they would still have only a negligible impact on the estimates we have published. We are nevertheless considering alternative work-arounds to achieve a comprehensive estimation of trimmed mean.
The link has been copied!
Your link has expired. Please request a new one.
Your link has expired. Please request a new one.
Your link has expired. Please request a new one.
Great! You've successfully signed up.
Great! You've successfully signed up.
Welcome back! You've successfully signed in.
Success! You now have access to additional content.