It Wasn't A Recession - How Age Divergence & A Participation Boom Drove A 1% Rise In The Unemployment Rate

Summary: The unemployment rate has risen 1% from its post-pandemic trough three years ago, but this rise likely overstates the degree of labor market and business cycle deterioration relative to what such a rise in the unemployment rate typically implied. Most prime working age cohorts actually saw rising employment and labor force participation rates over this same period, both of which are highly atypical if the labor market was deteriorating in a recessionary manner. There is still identifiable labor market weakness that accounts for some increase in the unemployment rate, but it is concentrated among younger people (ages 16-29).
We entered 2026 with a macroeconomic puzzle: How is the US economy holding up so well, when the unemployment rate has been trending upward so persistently? You can barely find the risk of recession priced into any major asset class. Stocks are at highs, credit spreads are tight, and Treasury yields do not signal a flight to safety. As a matter of historical probability, a persistent rise in the unemployment rate should be a tell-tale sign that the labor market is entering a recession.
The unemployment rate has risen 1% from the third quarter of 2022 to the fourth quarter of 2025. Knowing only that fact, one would assume a recession was far more likely to have materialized than not. However, under most reasonable assessments across other business cycle indicators, the US economy has continued to expand.
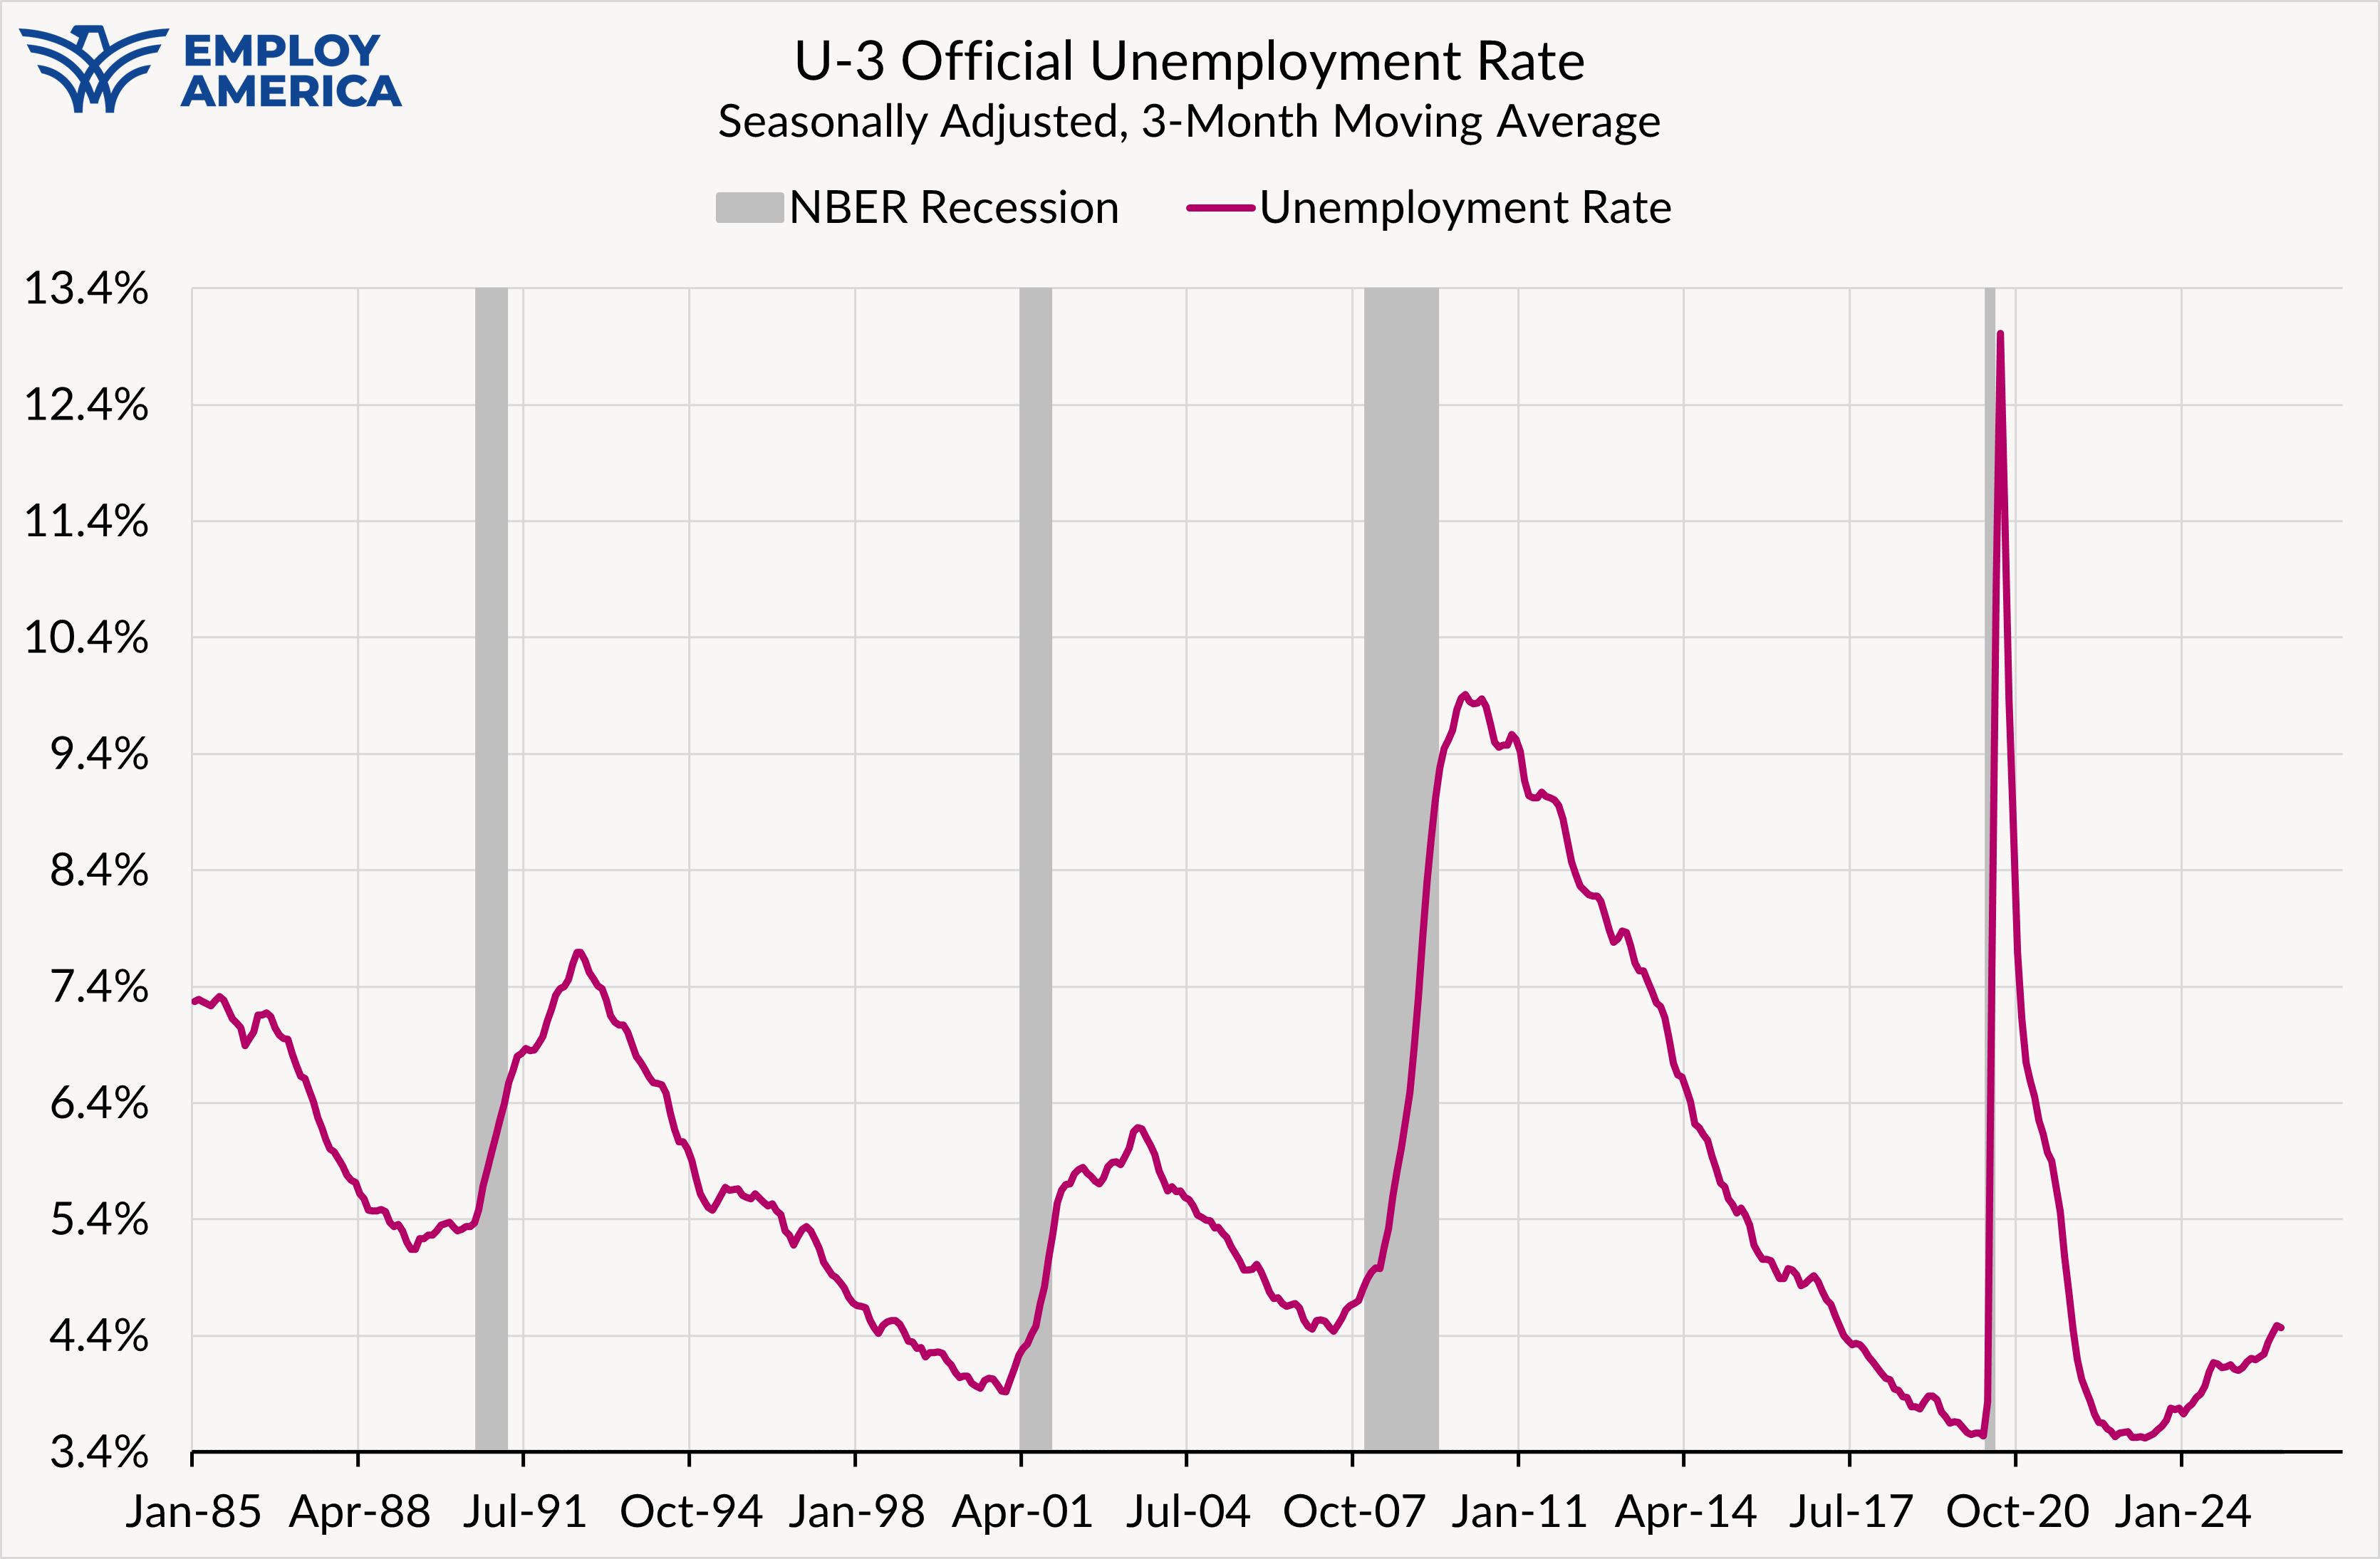
In 2022Q3, the unemployment rate hit its quarterly trough of 3.5%. For 2025Q4, the unemployment rate was 4.5%. A 1% rise is almost always a significant increase, one that historically happens during recessions.
Each time the unemployment rate has risen over 1% from its local quarterly trough, a business cycle contraction had materialized coincidentally. Leaving aside the uniqueness of the pandemic, the pattern remains prominent.
Something is different about the current moment. The unemployment rate is not representing broader economic facts in the way it used to. It pays to look under the hood.
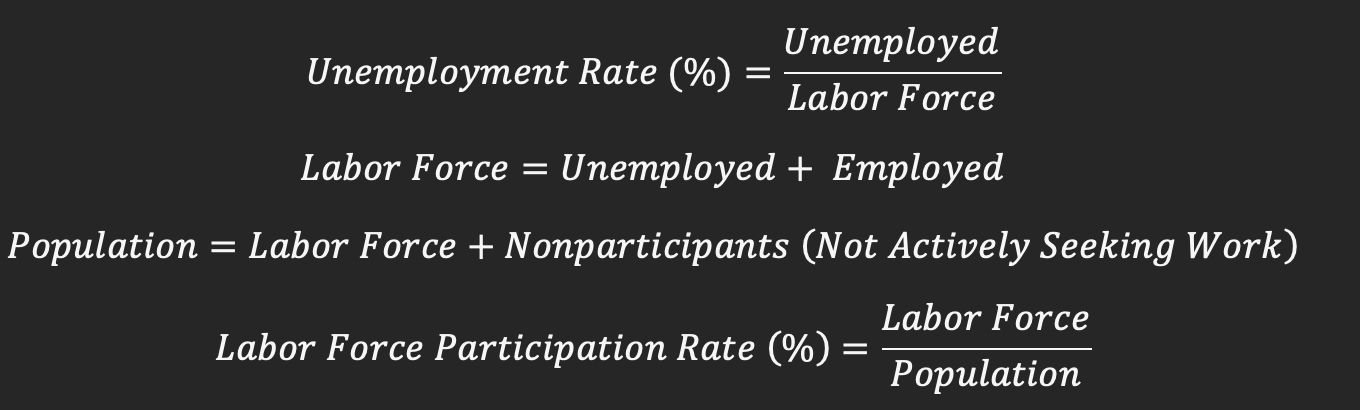
The unemployed are defined as those who are not employed, are actively looking for work, and are available to work. The unemployment rate is the ratio of the number of unemployed persons to the number of labor force participants: people who are either employed or unemployed. Those who are not employed and not deemed to be actively seeking and available for work are excluded from both the numerator and denominator of the unemployment rate. While this may seem like a clean definition, in practice it is difficult for surveys to consistently distinguish between who is unemployed and who is not participating in the labor force.
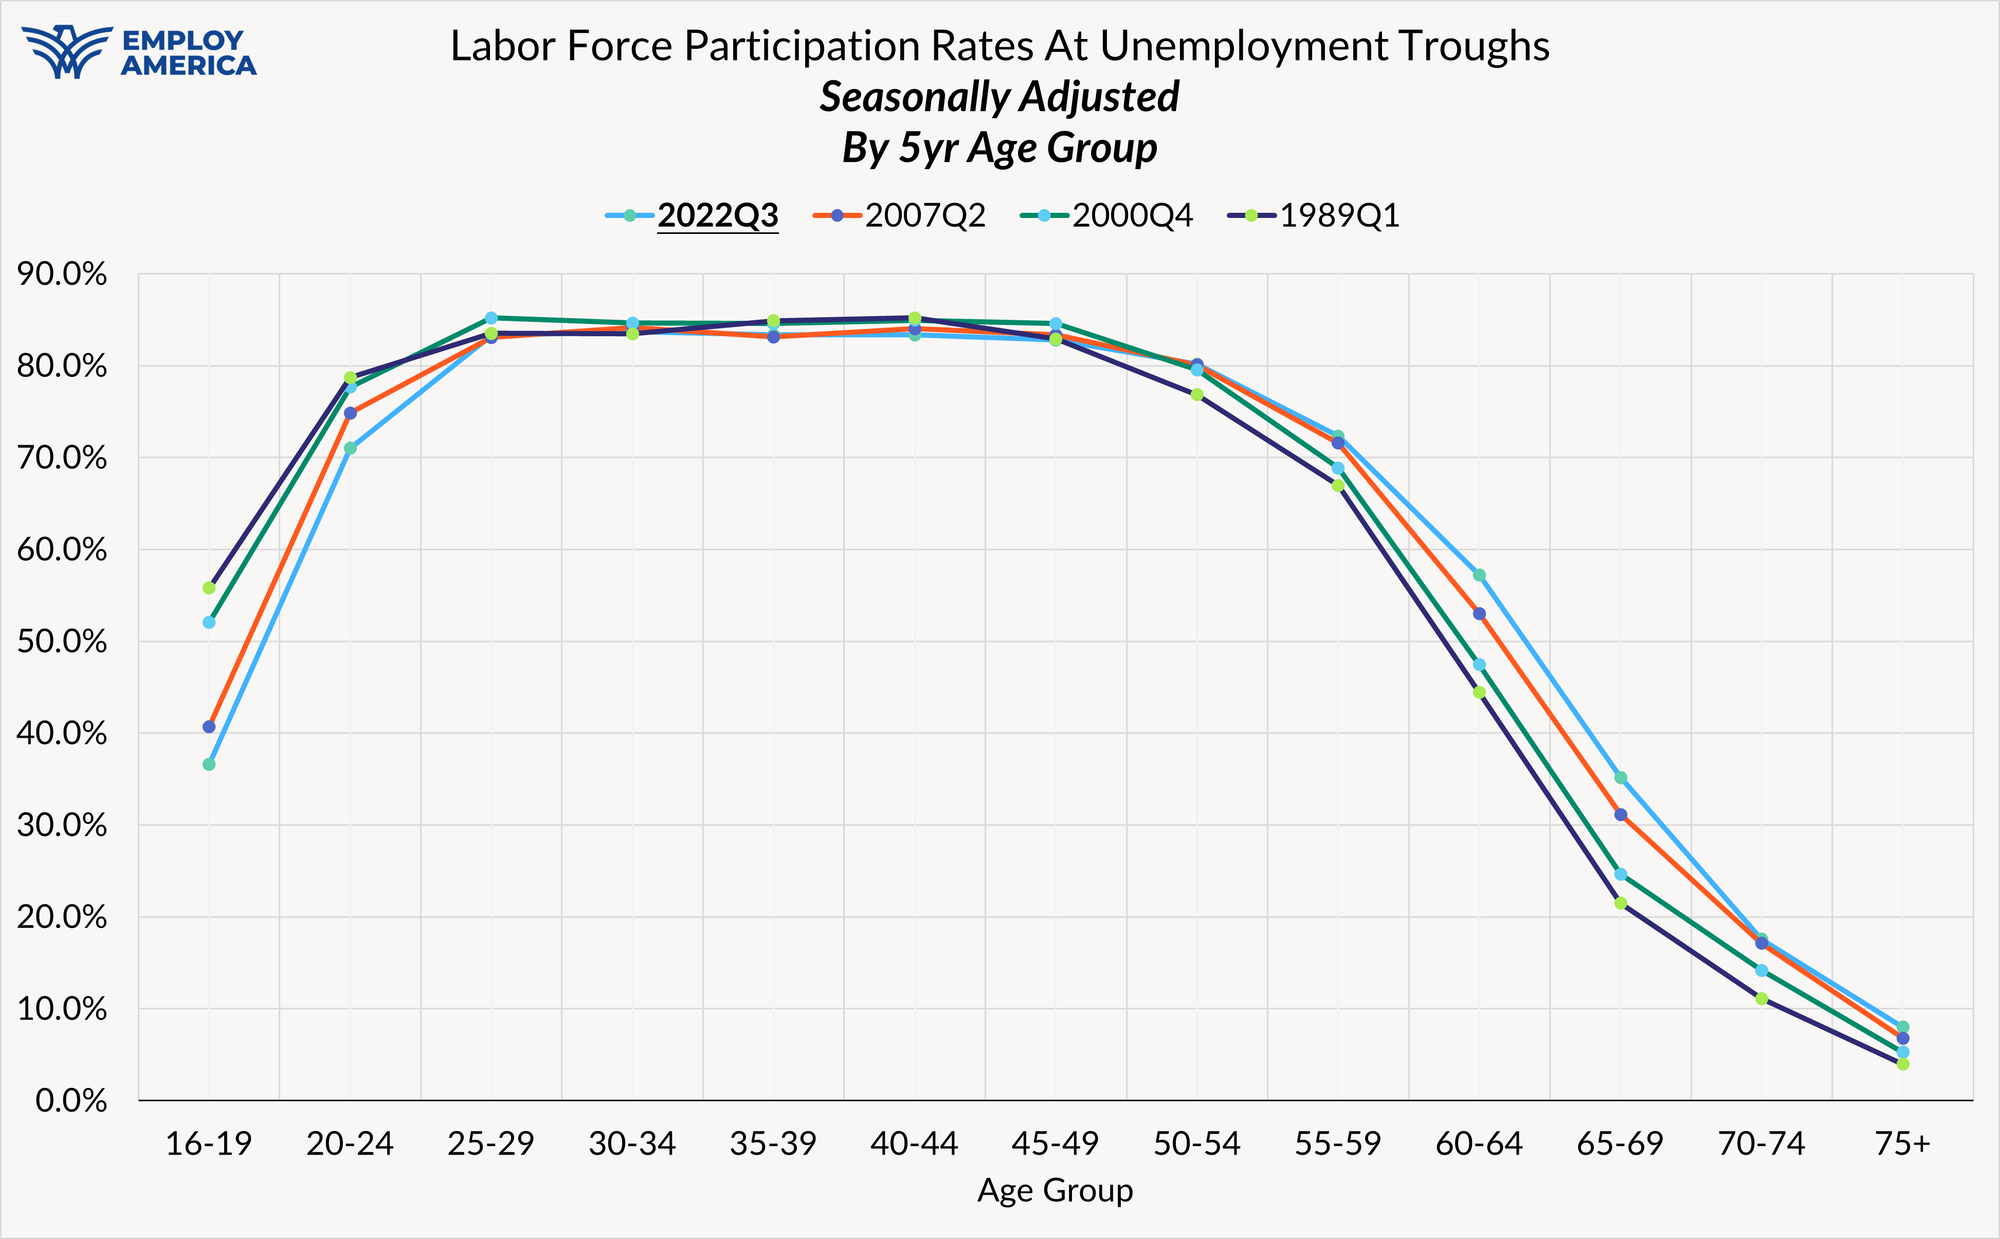
To look past the flawed distinction of "who's really in the labor force," it helps to look at alternative measures. The employment-to-population ratio reflects the number of people who are employed relative to the total working age population, including those who are out of the labor force. The labor force participation rate is the ratio of those who are in the labor force relative to the total population.
The US is in the midst of a historic aging of the population, with baby boomers moving out of the ages where labor force participation and employment are less likely, and into retirement ages where participation rates and employment-to-population ratios are typically lower. Evaluating unemployment rates by age, and decomposing their contribution from both employment and labor force participation trends, helps us uncover:
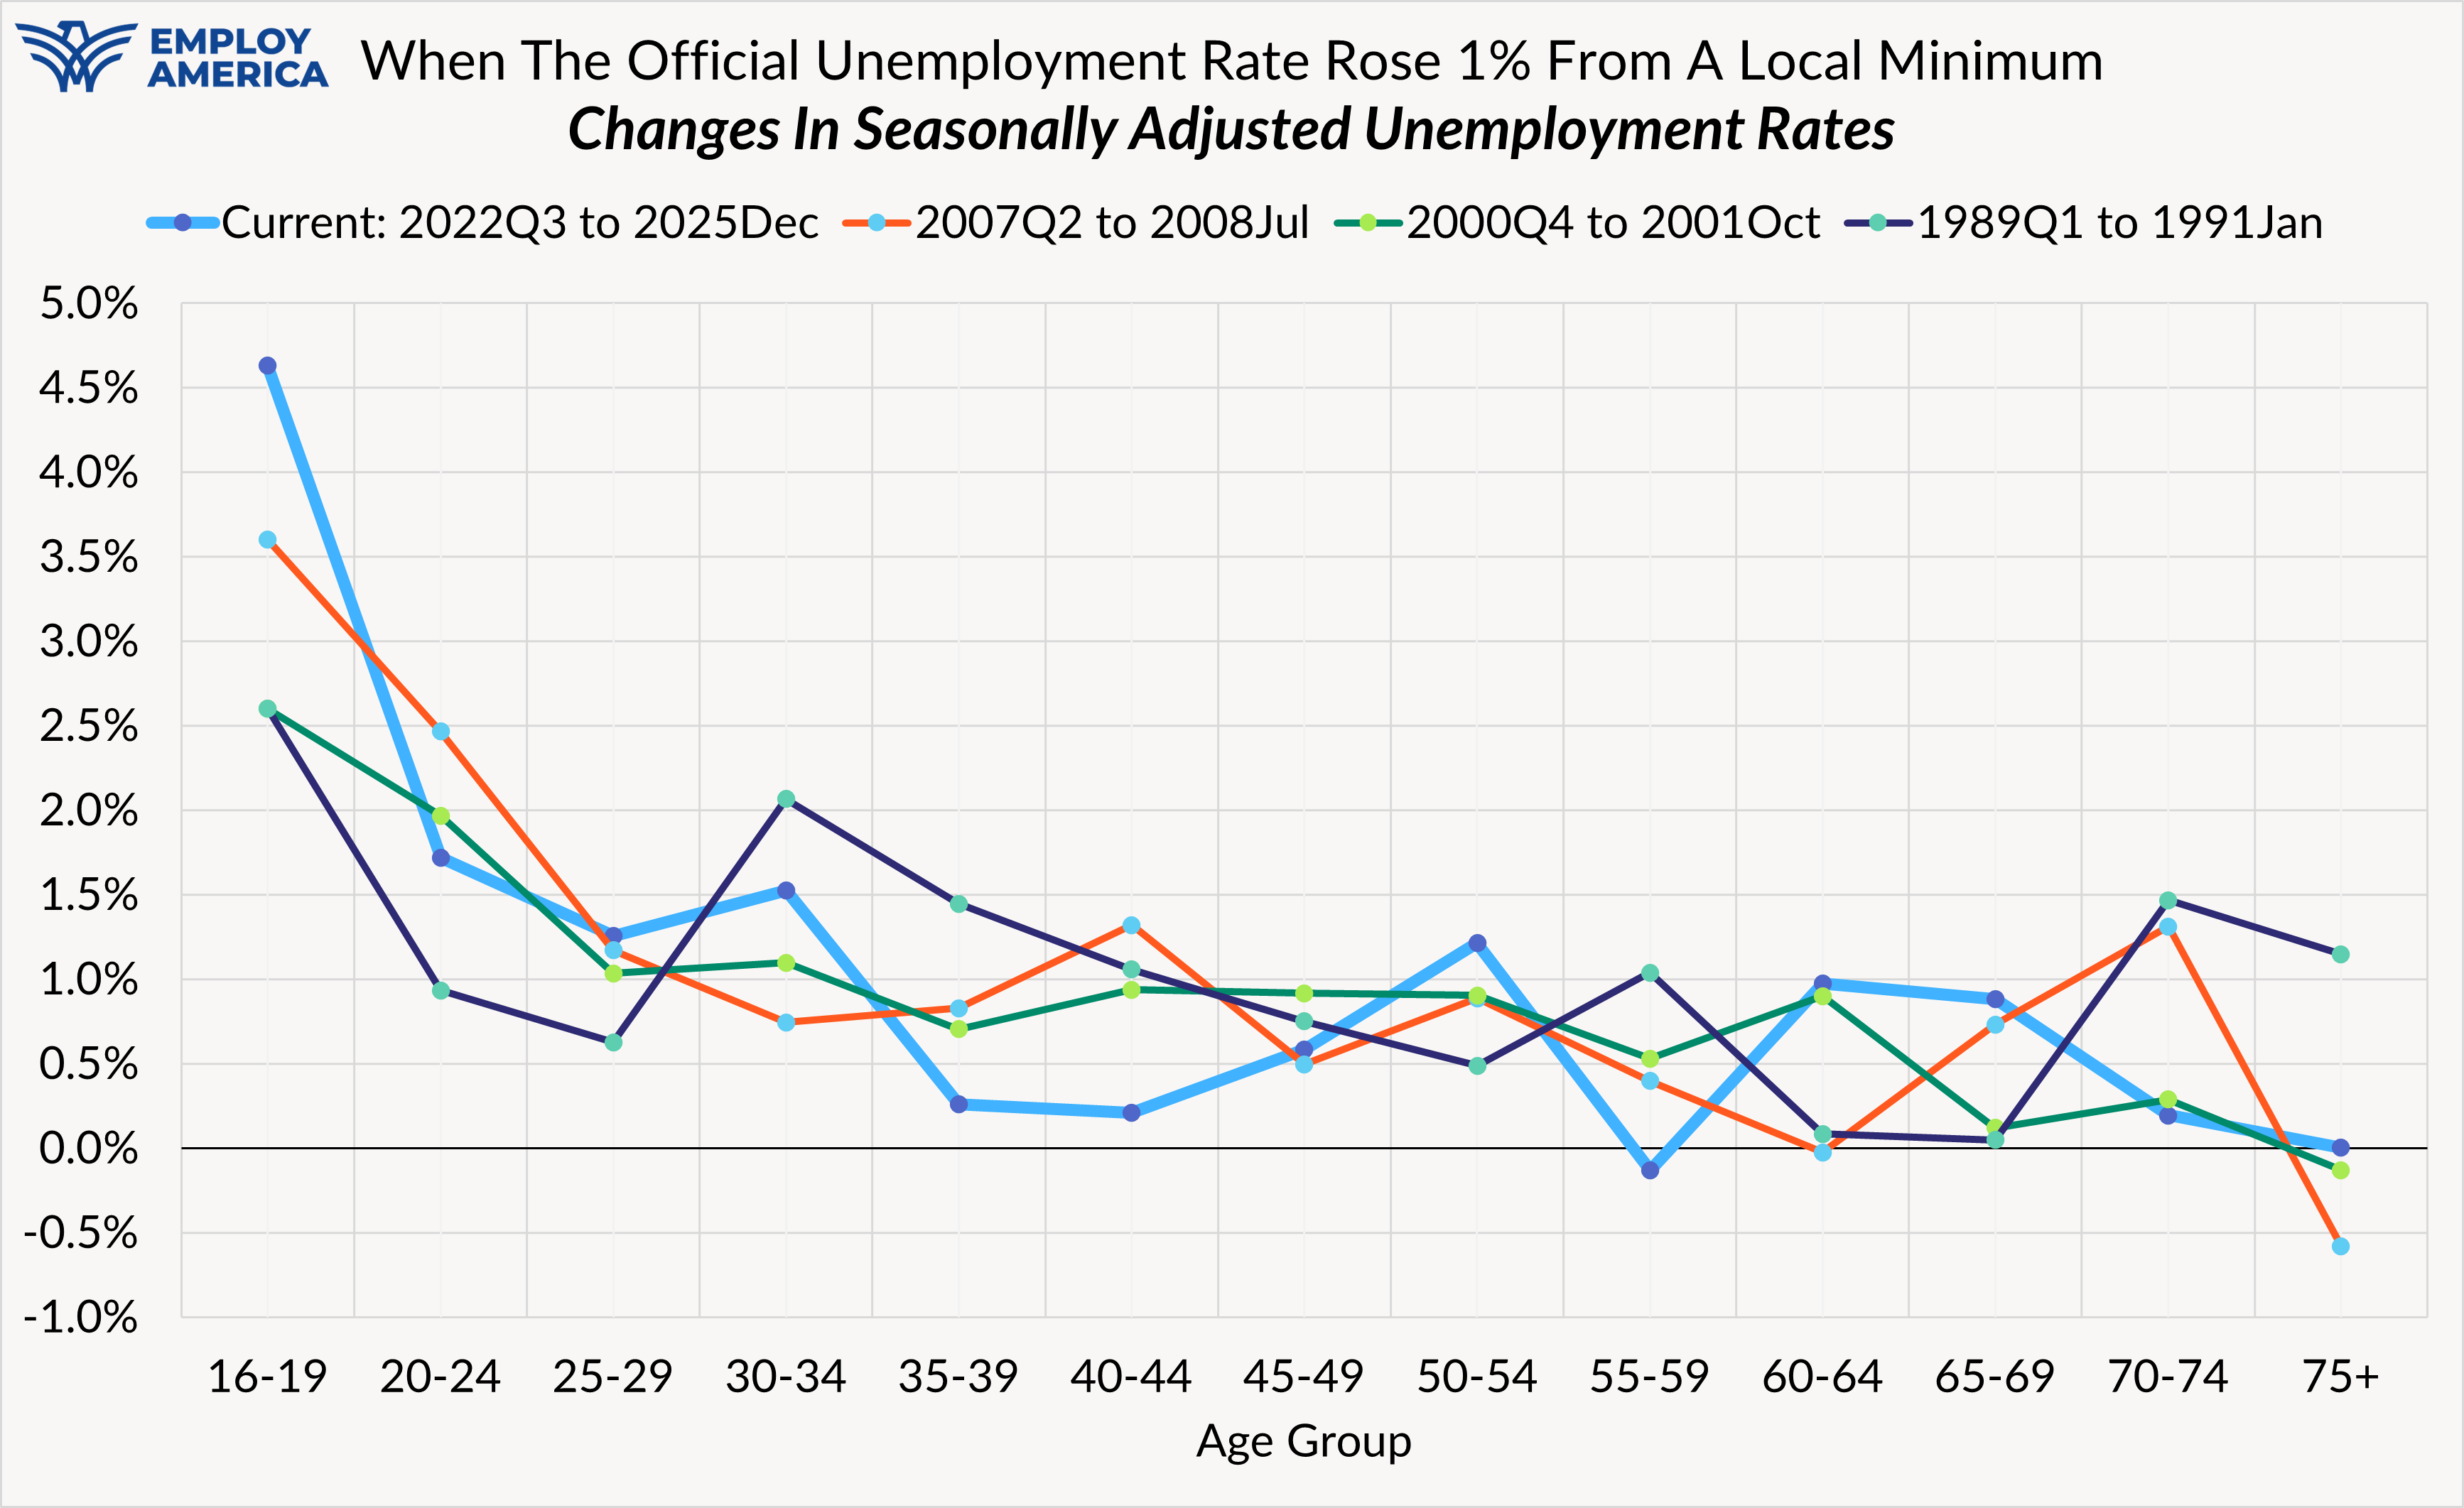
Unemployment rates have risen across all but two 5-year cohorts from the time the headline U-3 unemployment rate hit its quarterly trough in 2022Q3. The past three times we saw the unemployment rate rise steadily by 1%, the increases were virtually uniform in direction and outsized for younger people, especially ages 16-19. The only declines in unemployment among 5-year age group cohorts were (1) among 75+ year olds or (2) 60-64 year olds in 2007-08, whose unemployment rate remained virtually unchanged. While these facts are interesting, it's important to note that 16-19, 60-64 & 75+ year olds participate at much lower rates in the labor force than the rest of the population.
In the current episode, the unemployment rate has declined within a different age-group, 55-59 year olds, who also tend to participate a higher and growing rate than 16-19, 60-64 or 75+ year olds.
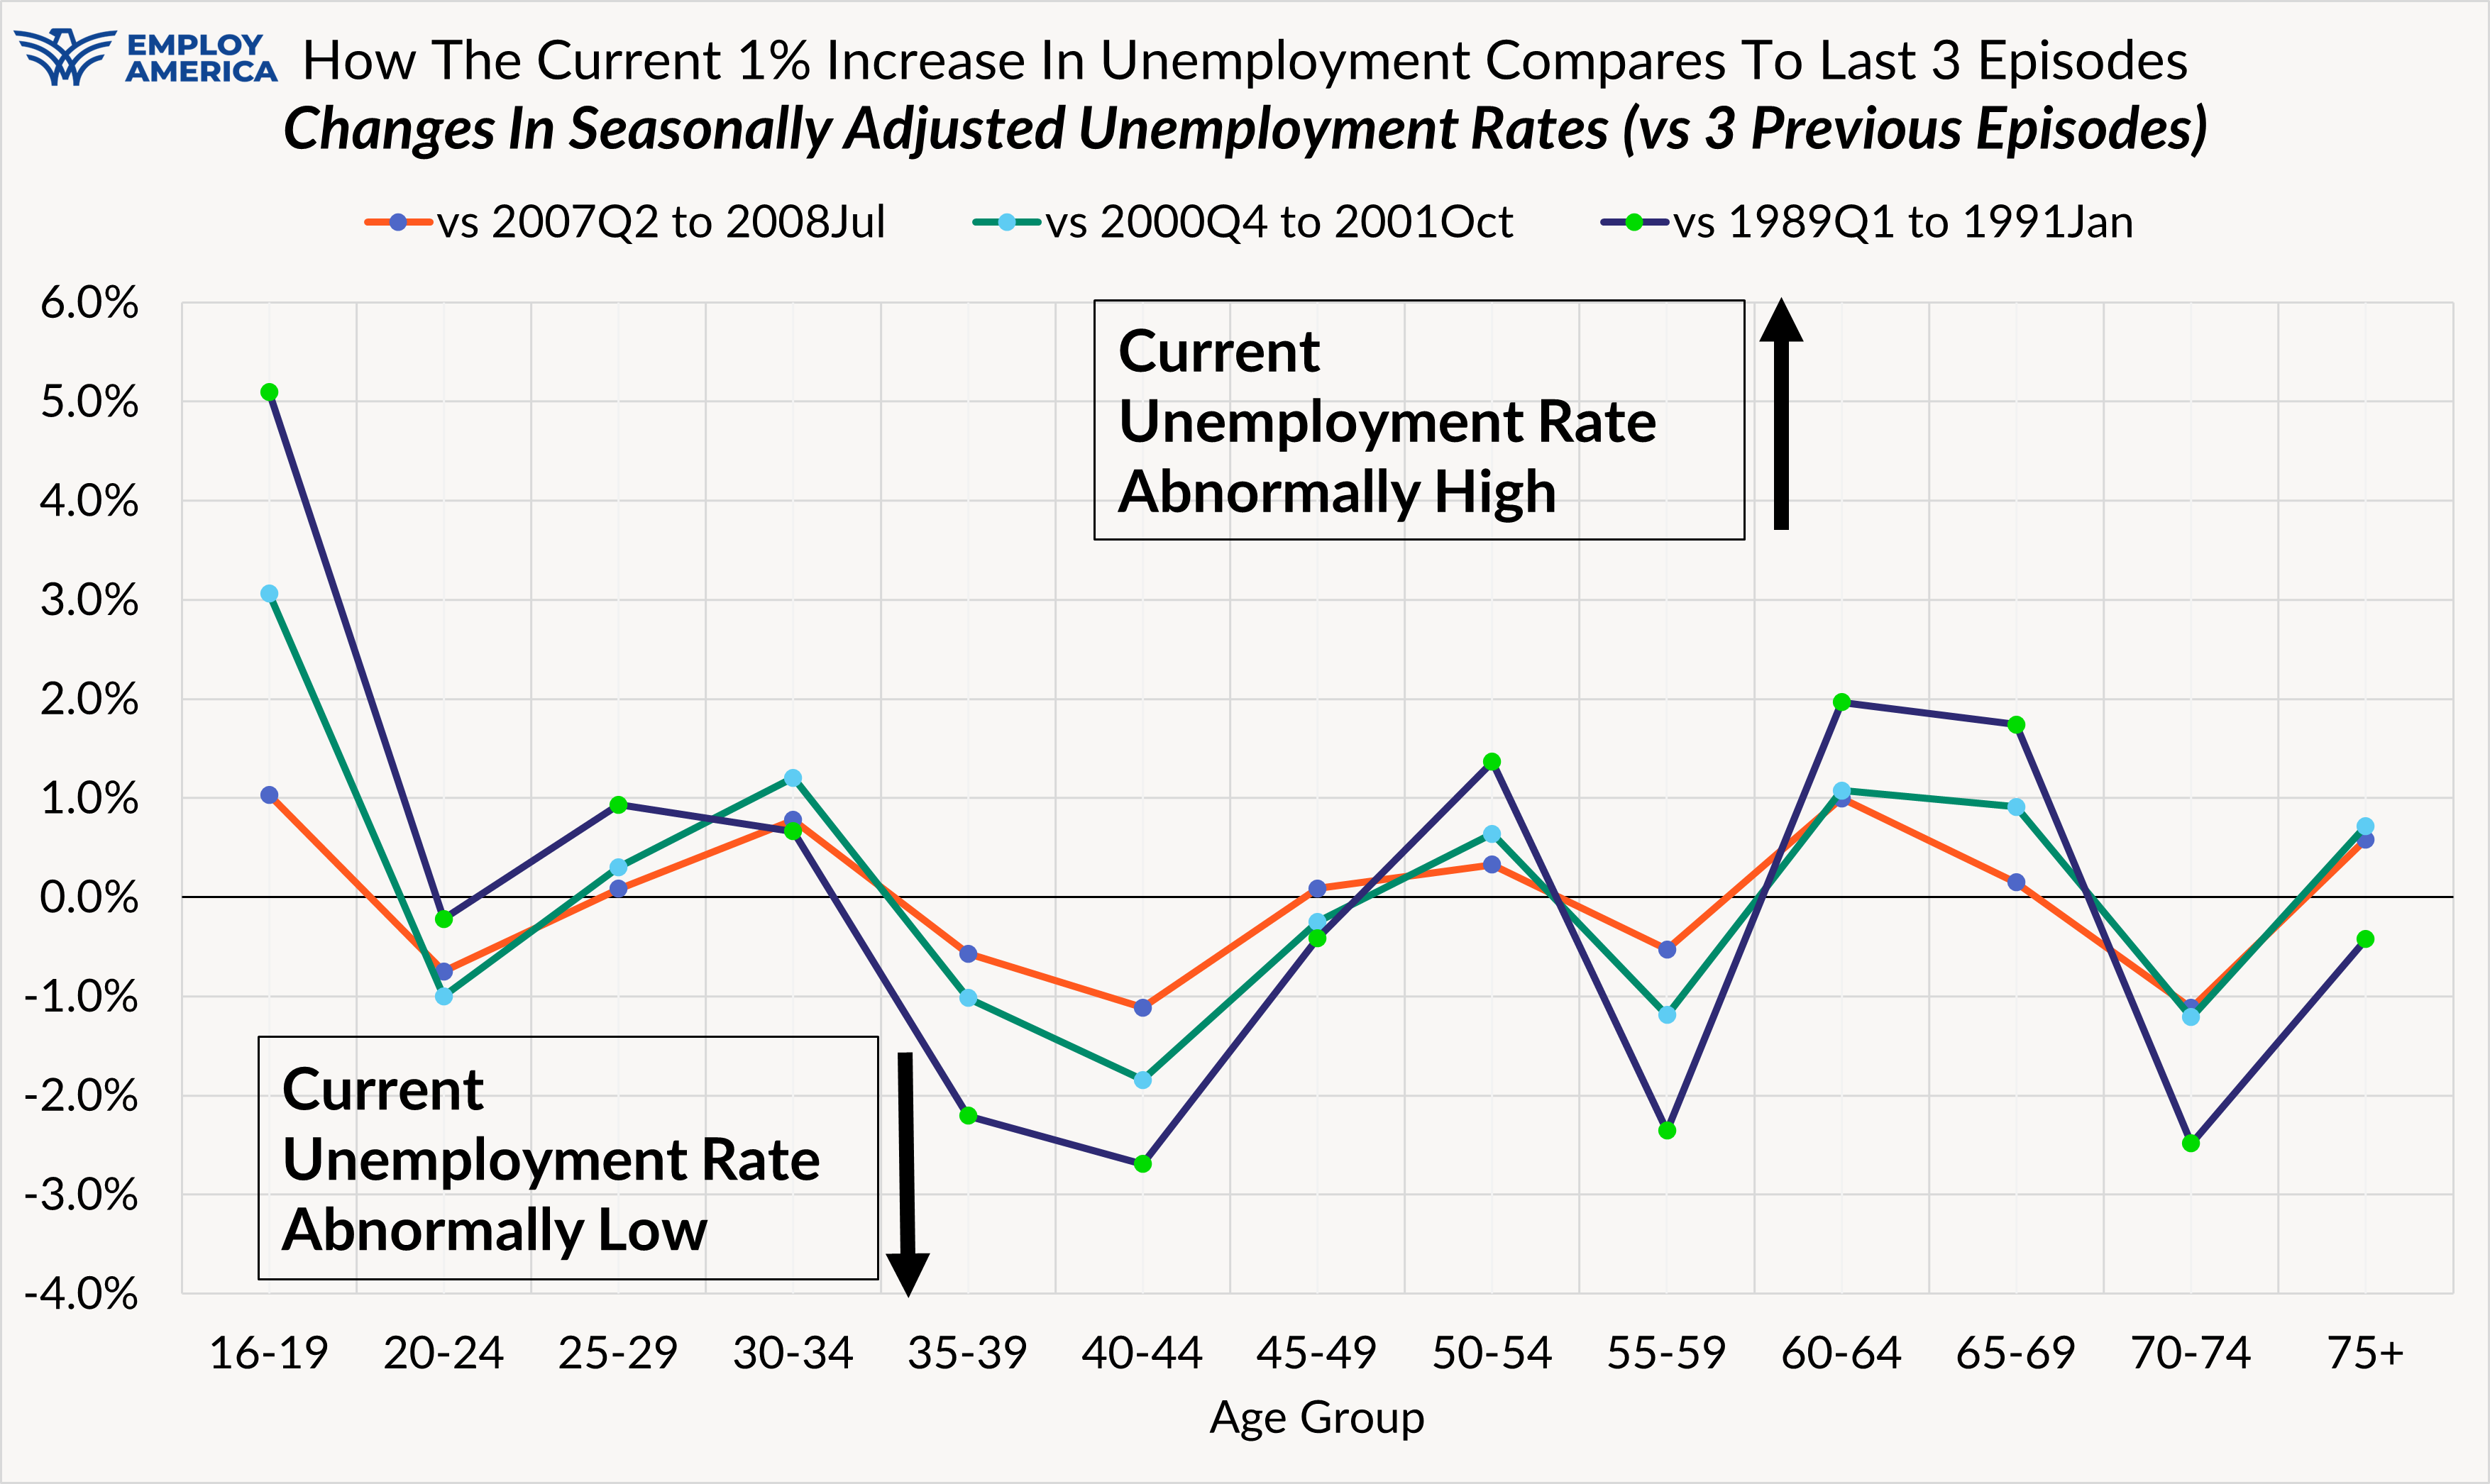
If we compare 1% headline unemployment rate increases across the past four non-pandemic episodes, the current episode contains notable trends in both directions. For those of the ages 16-19, 25-34 and 60+, the unemployment rate has generally risen faster than it did in the other three episodes. For most 35-59 year olds, unemployment rates have not risen quite as materially, with the lone exception of 50-54 year olds. Purely due to general randomness, there are bound to be some age groups that outperform and underperform prior historical episodes.
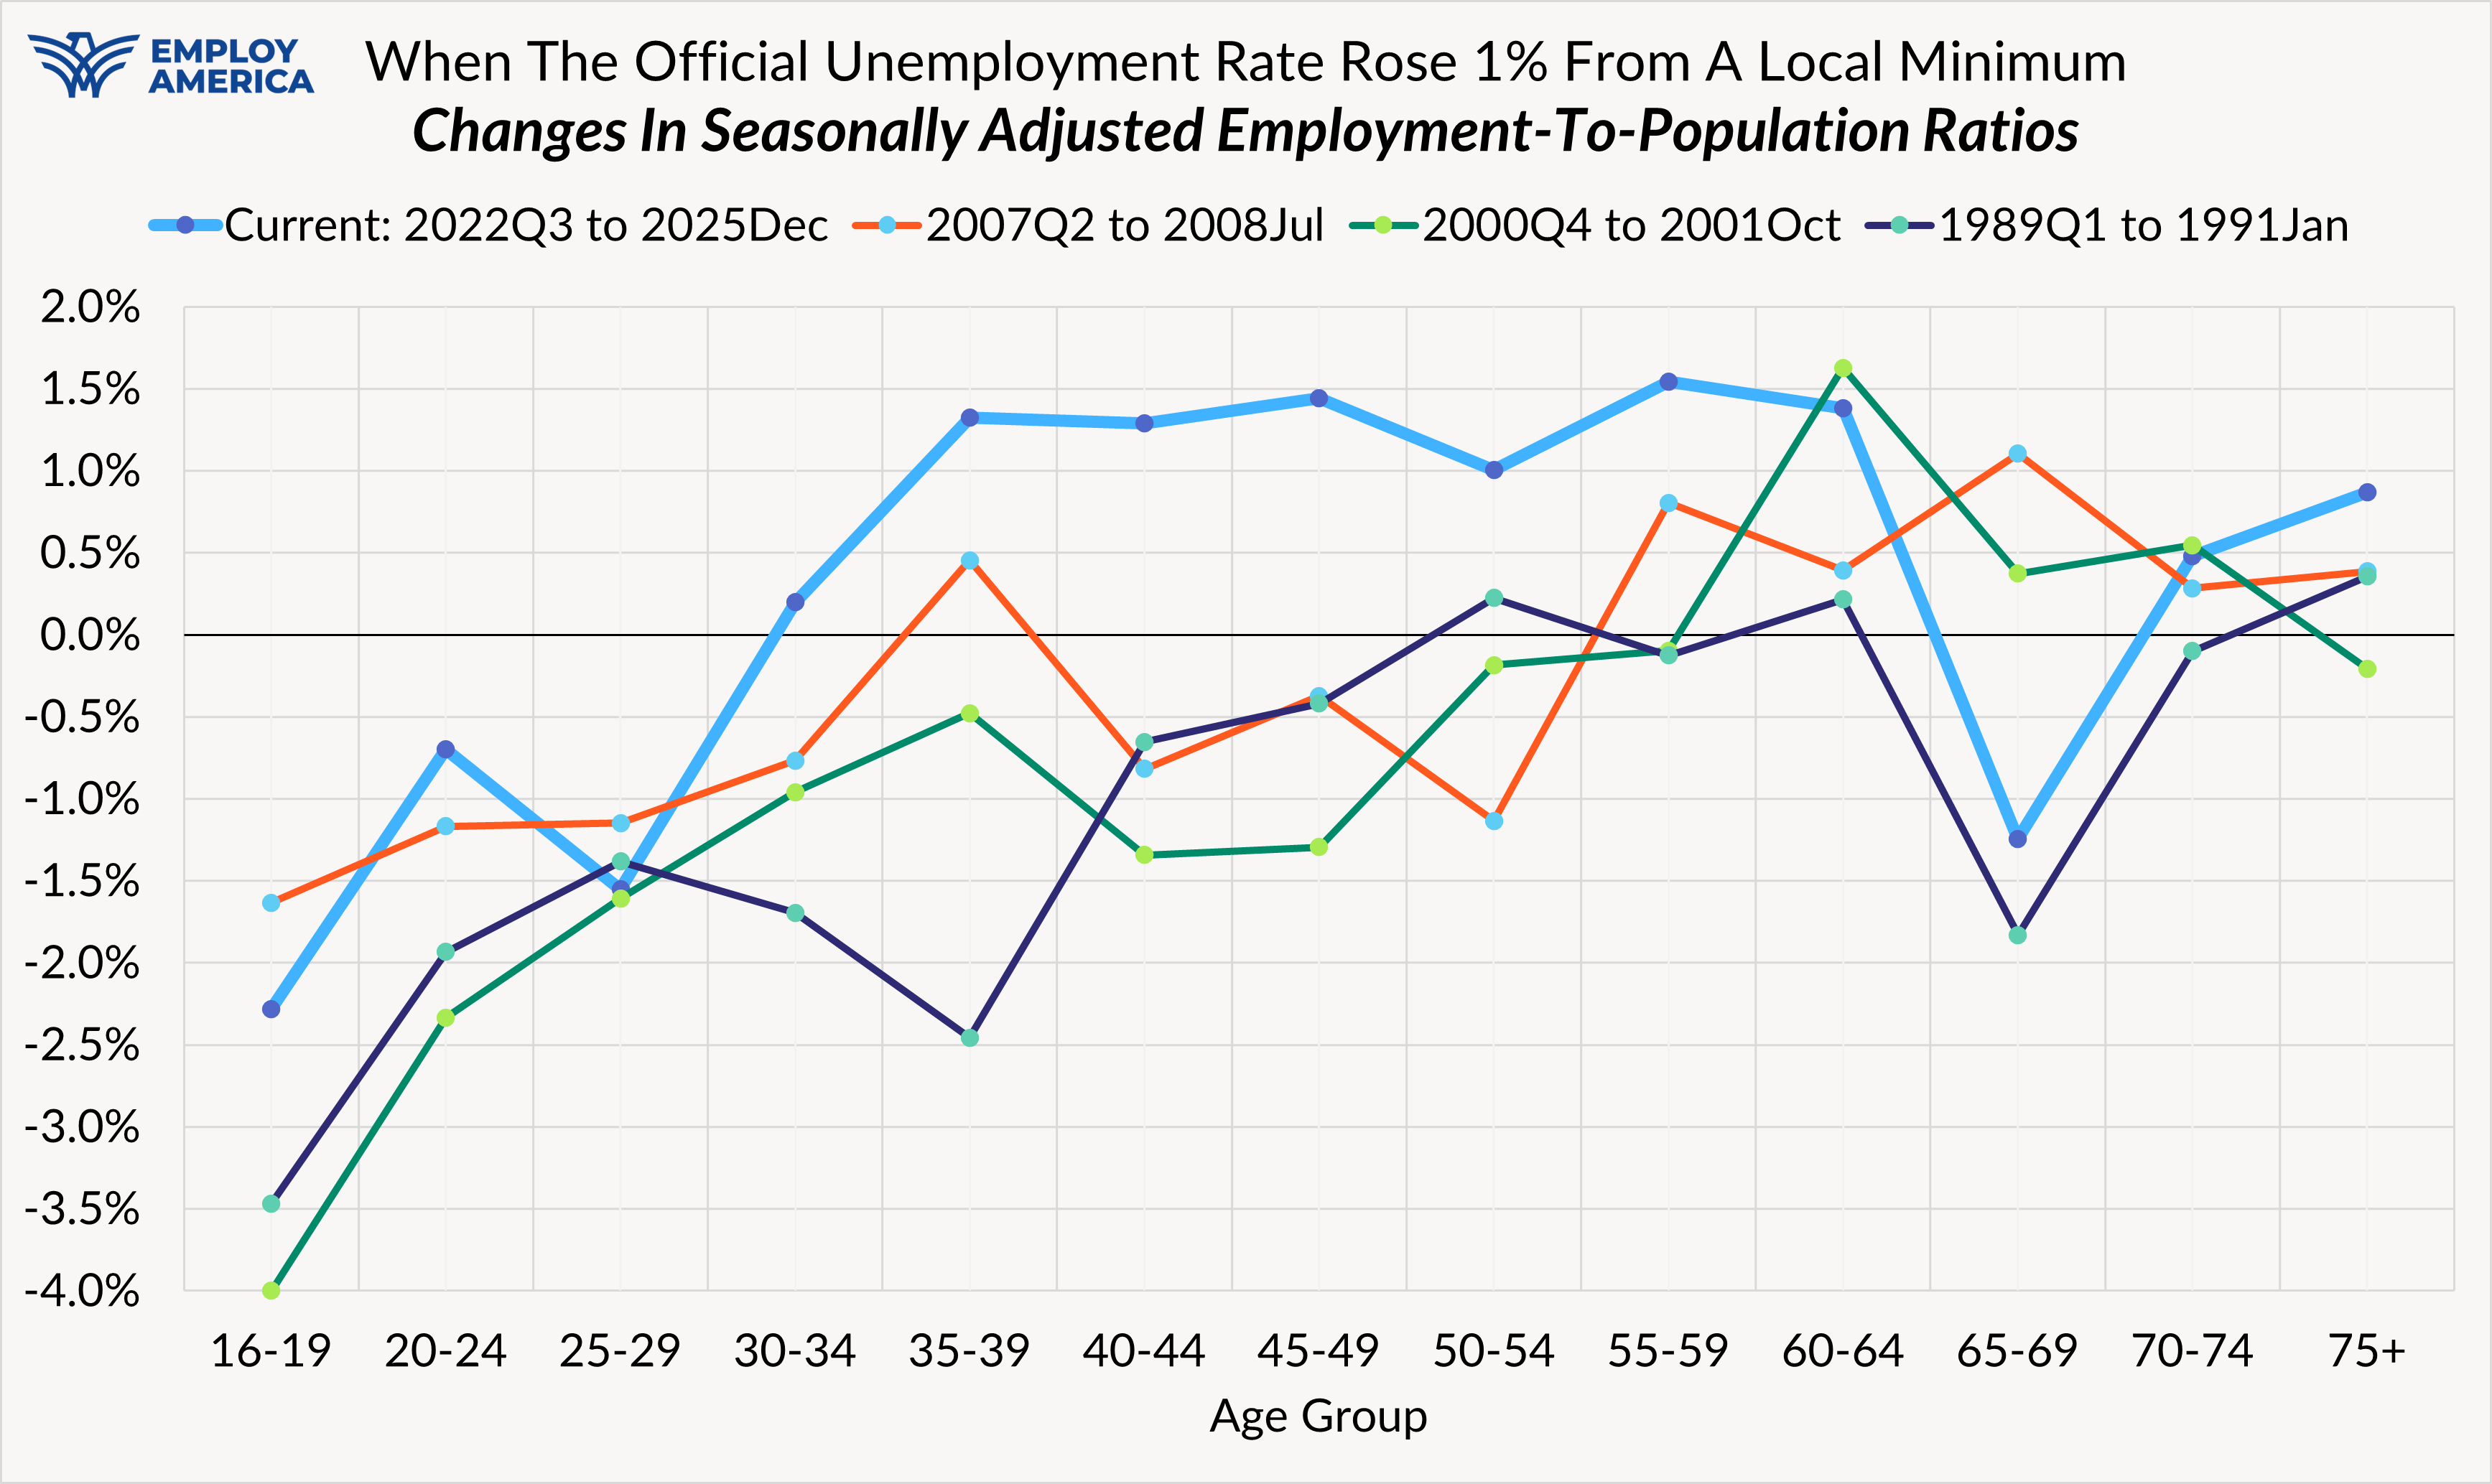
As we start to pick apart what part of unemployment is actually weak, one simple fact cuts against the recessionary thesis: for most prime-age participating age groups, employment rates have risen quite meaningfully in the past three years. For the age groups between 35 and 64, employment-to-population ratios have increased by 1% to 1.5% even as the headline unemployment rate has increased 1%. This stands in contrast with what's going on for younger people ages 16-29: employment-to-population ratios have behaved as they would in the prior three recessionary episodes prior to the pandemic. It's not hyperbolic to say that for some younger age groups, their labor market experience is quite comparable to what they would have faced in a prior recession.
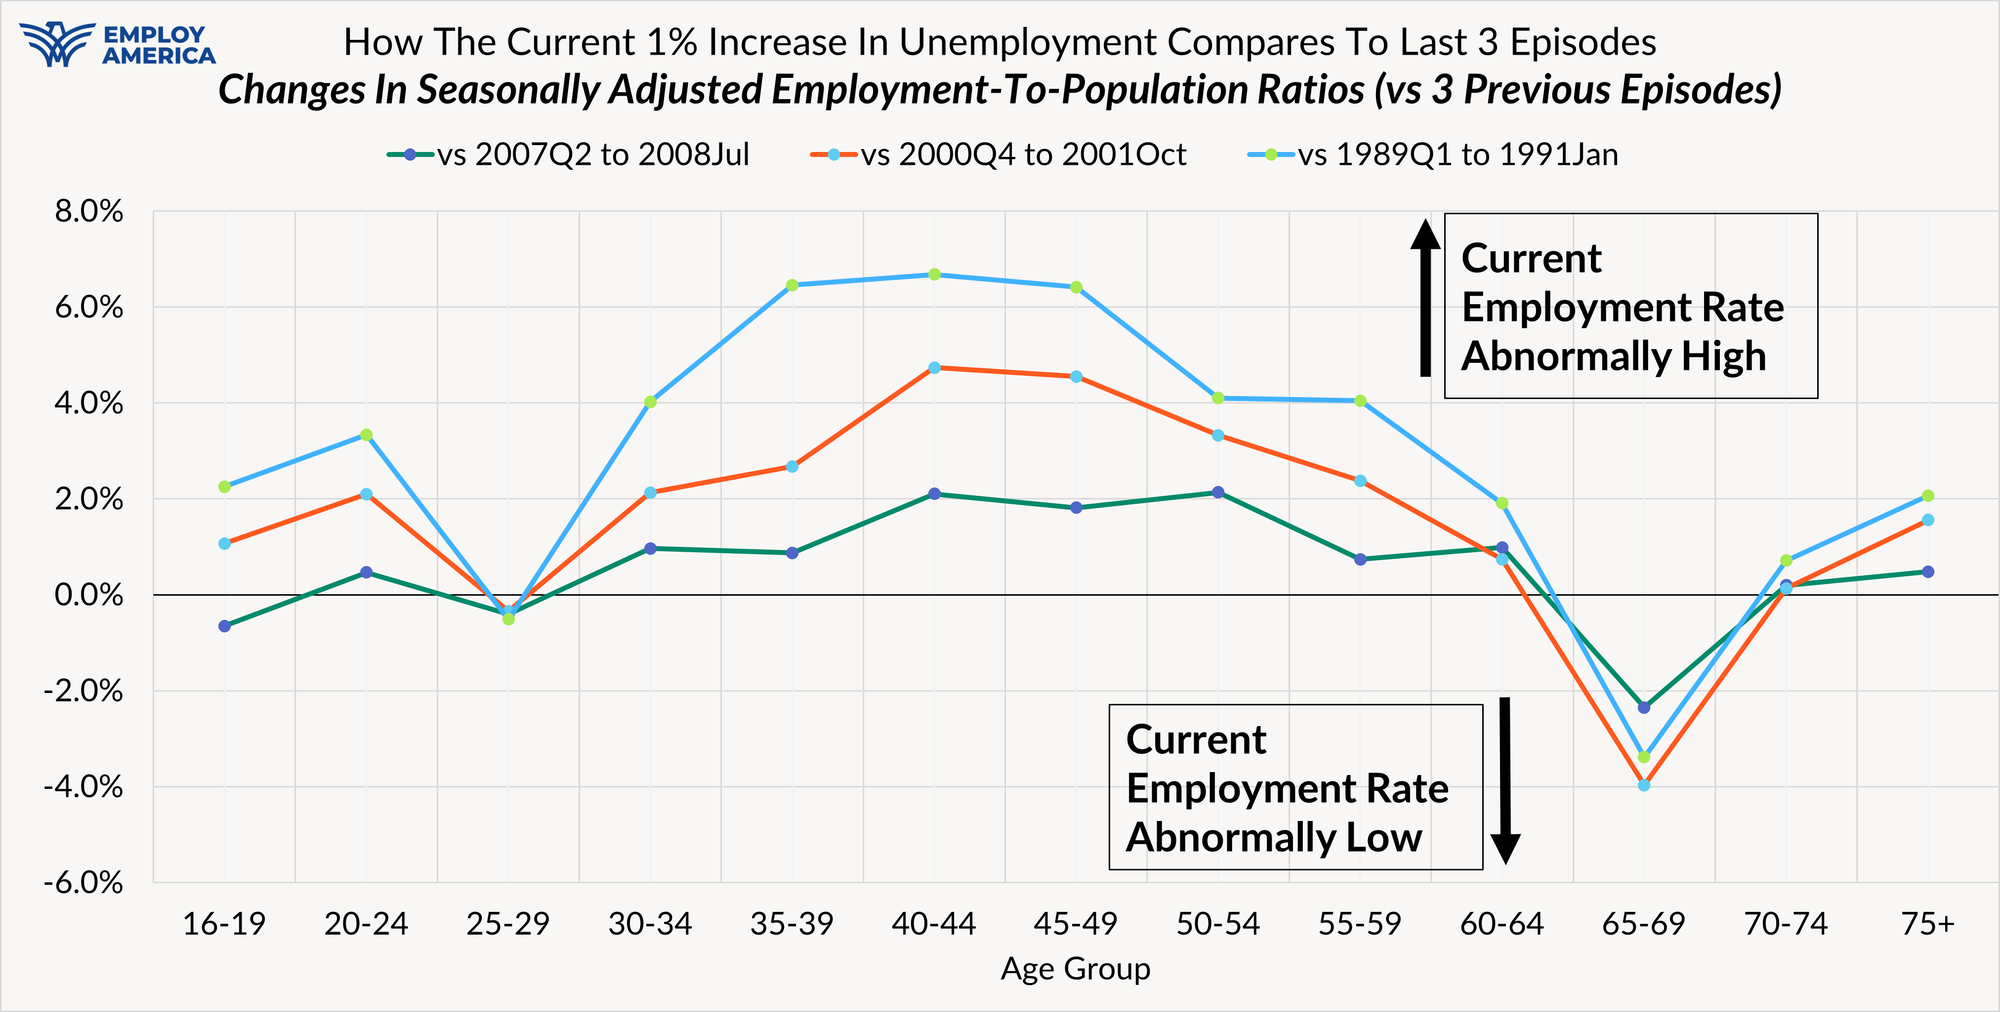
The coincidence between rising employment and rising unemployment is abnormal. When comparing employment-to-population ratio trajectories in the current episode to the prior three pre-pandemic episodes, the current outperformance is palpable across most age groups. Even for many age groups that have seen outsized increases in unemployment relative to past episodes, their employment-to-population ratios are still declining at a slower pace than their historical counterparts.
When the unemployment rate is rising meaningfully, it's hard to celebrate the state of the labor market. It is true that rates of hiring and job-switching have also fallen over this same period, suggesting fewer credible employment opportunities for workers and sluggish labor demand. Aggregate job growth has ground to a near-halt thanks to a combination of weak hiring and a reversal of recent immigration inflows. Nevertheless, some facts defy the gloomy characterizations of the labor market.

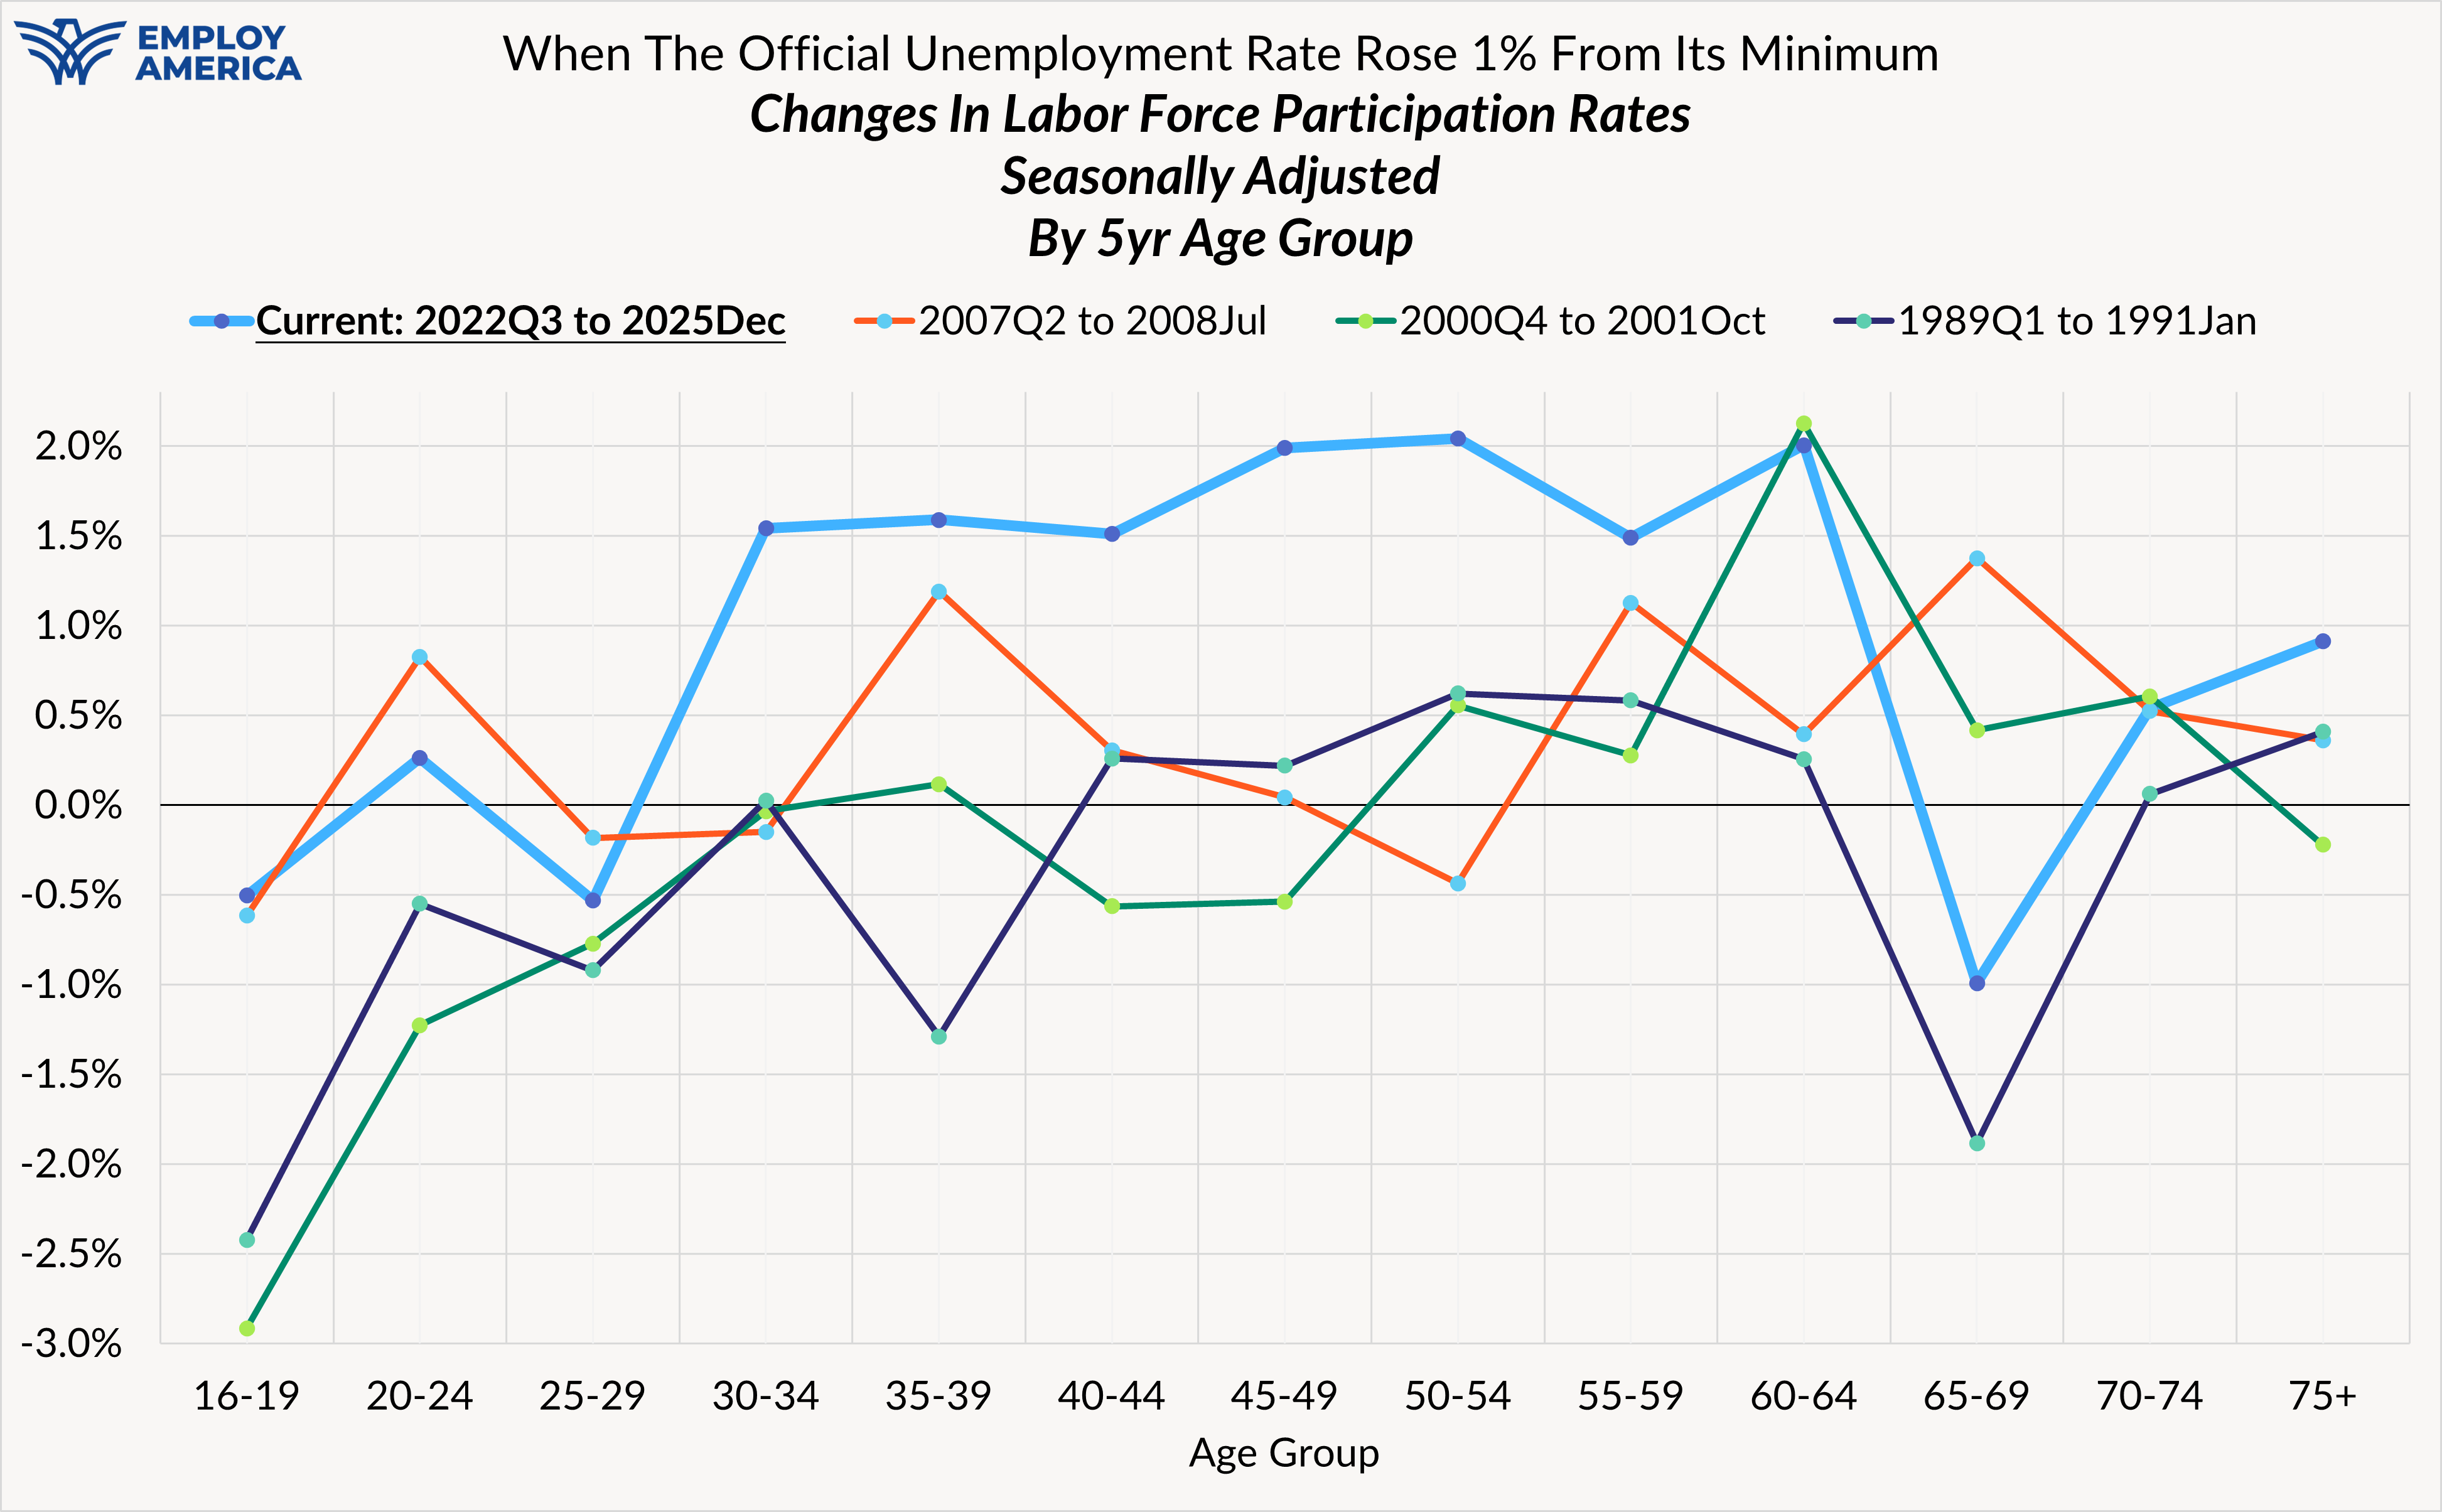
Even as the unemployment rate has risen across most age groups, the number of people who even count towards the labor force and the unemployment rate has increased too. The labor force participation rate has increased by 1.5% to 2% for age groups between 30 and 64. These are the age groups with the highest propensity to participate in the labor market in the first place. A 1.5% to 2% increase in labor force participation rates is also very meaningful and not to be taken for granted. For these same age groups, labor force participation rates had fallen by over 2% following the onset of the global financial crisis, and only began recovering those losses in 2015.
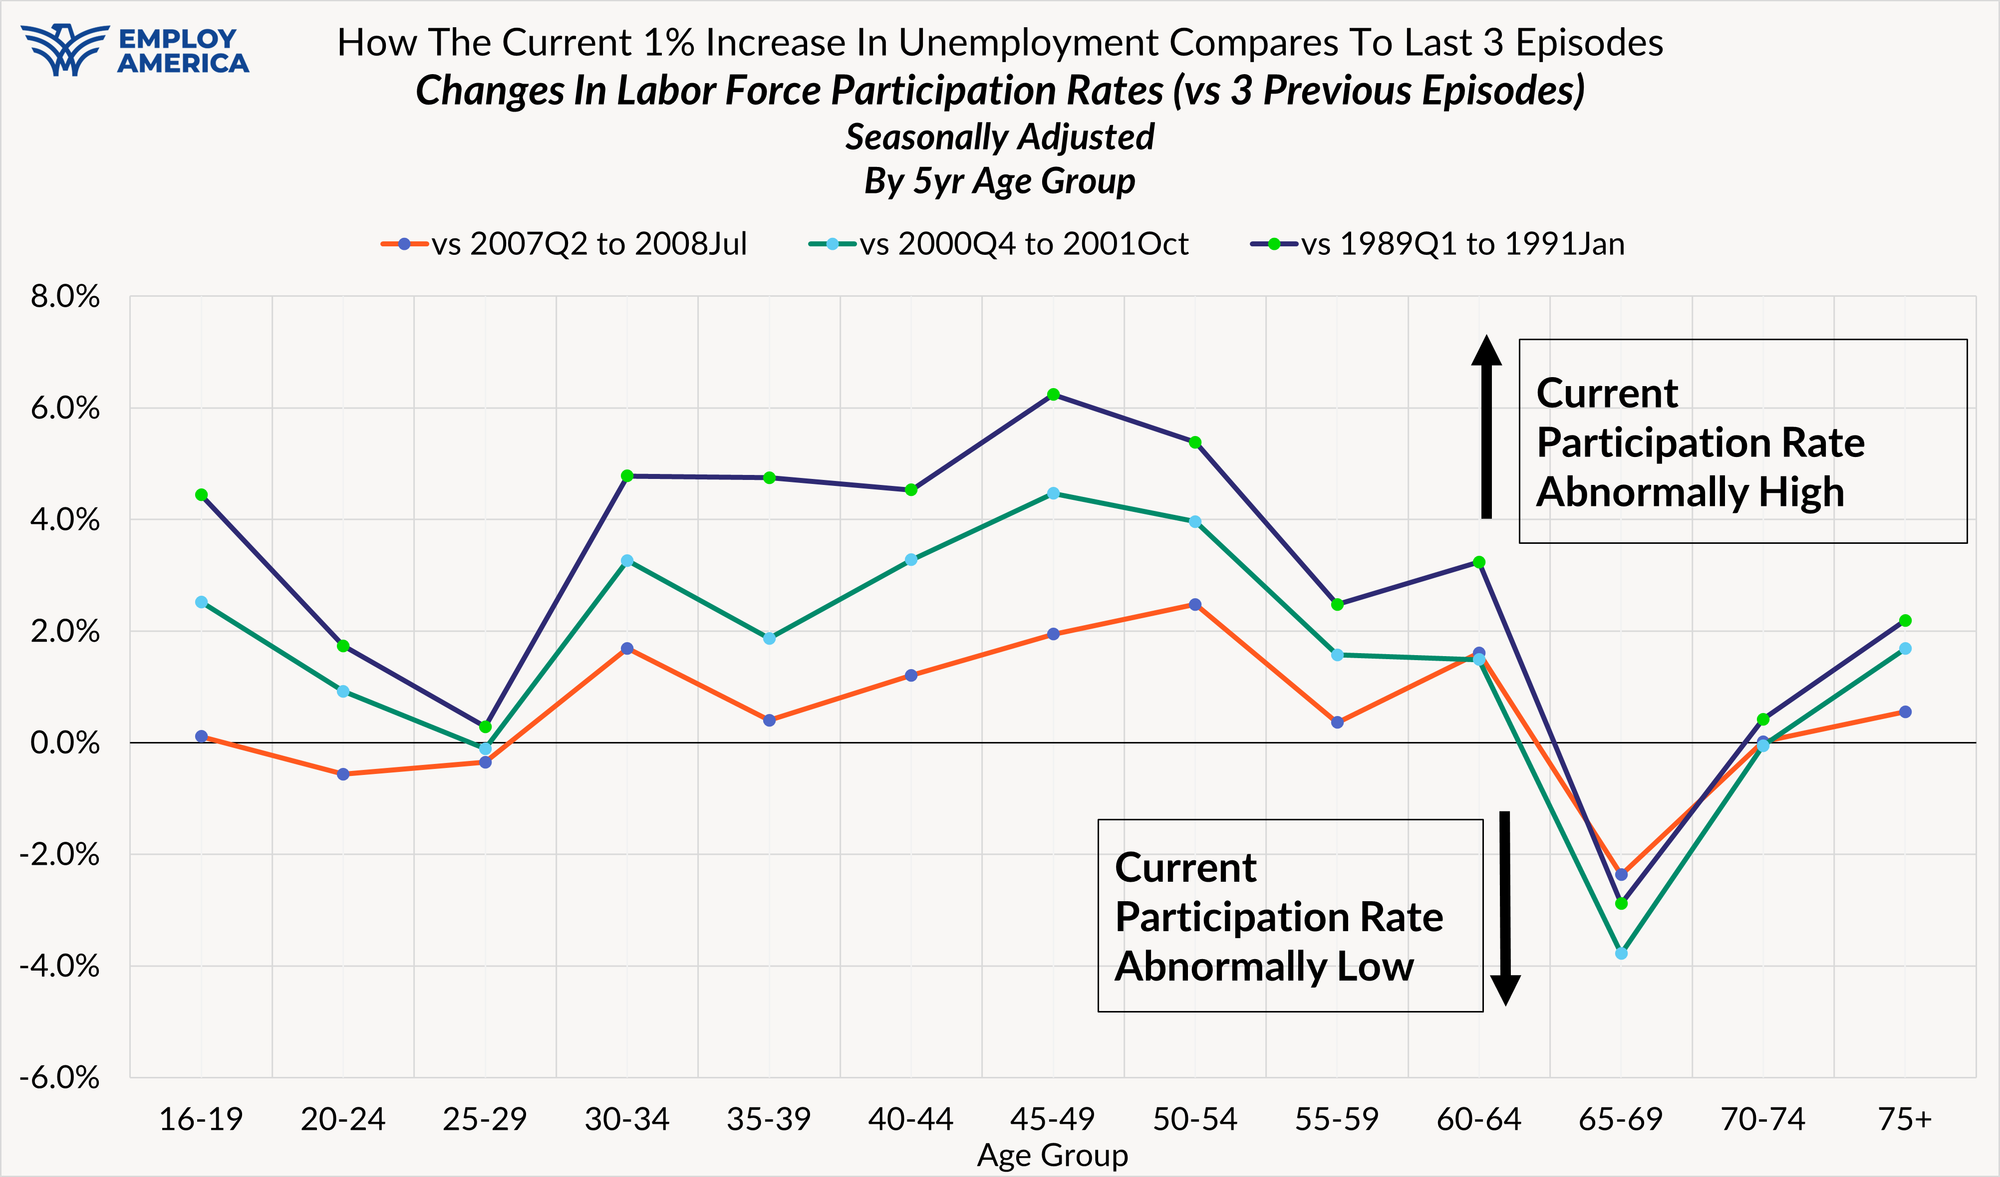
When comparing what labor force participation has done over this episode of rising unemployment, the outperformance is almost uniform across age groups, even if of varying magnitudes. You typically don't see an initial rise in unemployment alongside impressive labor force participation gains.
Just as a falling unemployment rate isn't categorically good, and especially people are so discouraged by labor market conditions to look for a job, the opposite can also be true. A rising unemployment rate isn't categorically bad. The labor force appears to be increasing as more people on the sidelines are now actively looking for work. This dynamic doesn't explain the entire increase in the unemployment rate, but without it, the increase in the unemployment rate would look far less worrisome or anomalous.
What's transpired in the past three years is a messier story than simply "the beginning of the end" for the business cycle expansion. There is a slowing in labor market momentum and some concentrated weakness at the younger end of the labor market, but also some underlying strength. Should the US labor market run into a shock that catalyzes declining age-adjusted labor force participation, one would hope that policymakers do not write off the prospect for future reversals and improvements.
This time is proving to be different for the unemployment rate. Maybe it won't last. If we see more compelling evidence of recessionary forces emerging, our view of the labor market trajectory will have to grow more pessimistic. While we at Employ America are going to stay vigilant against threats to full employment, we think it's just as important to highlight good news where it emerges. We too were worried about the unemployment rate's initial rise in 204 and how that might interact with risks from restrictive policy. Since that time, interest rate policy has grown less restrictive and there is no value to crying wolf prematurely. The weakness in the labor market appears to be concentrated among 16-29 year olds, with much of it beginning prior to the onset of AI-related breakthroughs but continuing onward through 2025.
Our analysis here is purely retrospective. With the data we have right now, it's hard to make a strong case for imminent labor market and business cycle deterioration. We do still see a very sluggish labor market in terms of growth, hiring, and dynamism. The fact that prime-age employment rates stopped making new highs in 2025 is itself remarkable, a sign that the labor market has lost speed even after adjusting for changes in immigration and population. Circumstances can shift quickly, and as they do, assessments of the labor market and macroeconomic risk must also adjust correspondingly. For the time being, we can be grateful that the US economy and labor market have avoided a contraction despite the rise in the unemployment rate.