
Executive Summary
Whenever inflation becomes a part of political or economic discourse, policymakers and commentators instinctively reach for narratives and models drawn from the experience of the 1970s inflation. However, these models offer little explanation for even adjacent experiences of inflation. Case in point: the combination of macroeconomic data-points and policy responses observed in the 1950s would suggest — under models of the 1970s — that runaway inflation was imminent. Instead, inflationary pressures quickly resolved themselves as the economic situation changed and new capacity was built out.
The theoretical inadequacy that this fact demonstrates should lead us to view explanations of present inflationary pressures that rely heavily on models developed to explain the 1970s — like the Phillips Curve, inflation expectations, or Fed credibility — with a heavy dose of skepticism. Instead, then and now, a sectorally disaggregated view of capacity bottlenecks and required adjustments provides a far superior picture of the source of, and remedies for, inflationary pressures.
The 1950s and the 1970s
Rising inflation readings have made it more important than ever for policymakers outside of the Federal Reserve to understand how and why inflation happens. Most commentators and policymakers look to understand inflation today by directly applying the narrative of the Great Inflation. Coming out of the 1970s, the experience of inflation had proven so socially and economically dislocating that economists set about trying to establish strict general rules which would prevent inflation from ever getting out of hand again.
They succeeded in developing a model — really a network of linked models — which is still in use today, and which most policymakers and commentators rely on, whether implicitly or explicitly. However, this model is so simplistic and so constraining that it fails to provide a convincing explanation for why even adjacent experiences of inflation happened, or why they ended without the kind of macroeconomic regime shift that marked the end of the 1970s inflation (the “Great Inflation”).
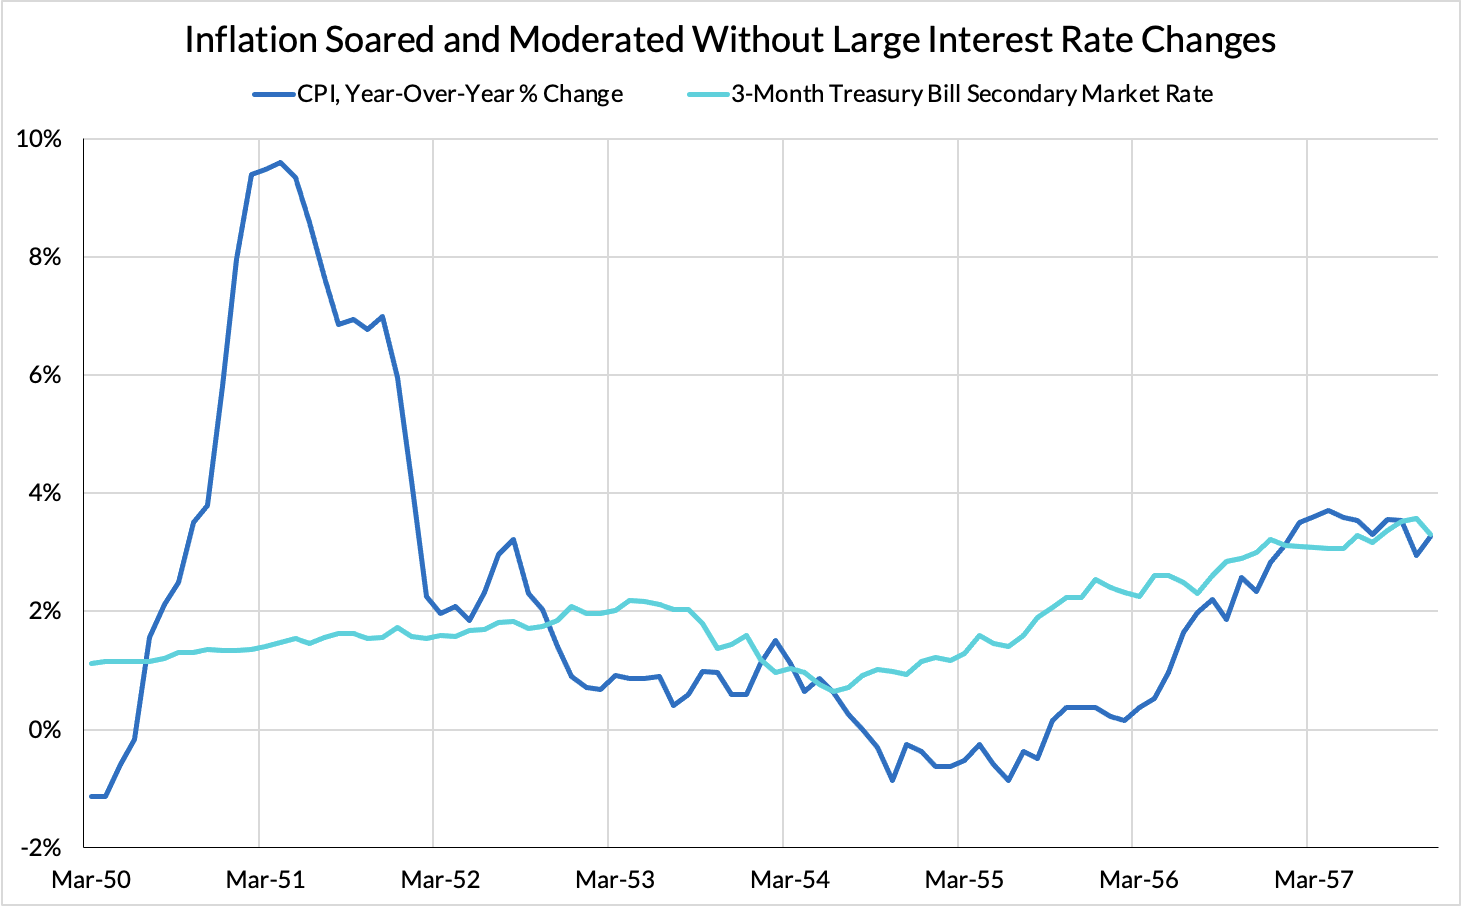
Take the 1950s: the economy saw a burst of inflation in the run-up to the Korean war, but the experience of that inflation and its relation to other major macroeconomic aggregates is difficult to explain using the narrative of the “Great Inflation.” Given the low unemployment rates and high inflation rates of the early 1950s, the tools developed to explain the 1970s would say that self-fulfilling price increases were imminent in the absence of “credible” monetary tightening. However, this inflation abated without the major employment losses and dramatic policy reversals that marked the end of inflationary pressures after the 1970s. In fact, unemployment continued to make new lows even as inflation moderated.
It is possible to use the story of the 1970s to construct something shaped like an explanation of the 1950s. However, doing so requires constant and overwhelming reliance on extreme movements in unobservable variables, fudge factors, and statistical residuals. These already play a role in the conventional account of the “Great Inflation,” but they are at least moving together and in a consistent direction in the narrative of the 70s. To explain the 1950s, we have to assume that things like the “natural rate of unemployment” or “natural rate of interest” change even more drastically and rapidly than they did even in the 1970s, often completely reversing course within the span of a few months.
That this narrative struggles to explain even the inflationary episode immediately prior should give us pause when using it to understand the current set of inflationary pressures. All three periods of inflation are meaningfully distinguishable, but distinguishing them requires a close and careful look at the different causal mechanisms at play. Labor utilization and inflation expectations are not sufficient to differentiate these periods of inflation. To tell the whole story we have to dig into the sectoral composition of capacity shortfalls, the investment responses those shortfalls brought about, and how each of those impulses fed through to the labor market at large.
Naturally, bottlenecks or capacity constraints are more likely to bind when demand conditions are more buoyant, conditions which also tend to correlate with lower unemployment rates and higher interest rates. However, the idea that there is a single natural rate where inflation automatically starts a dangerous ascent can’t find support in the data. Indeed, policy mistakes caused by an over-reliance on these concepts has prompted the Fed to move away from these “natural rates” and hew closer to the approach outlined here.
Mounting a successful policy response to any inflation today — whether transitory or persistent — requires that we understand the underlying causal mechanisms for rising inflation readings in the most direct and identifiable way possible.
The Phillips Curve and the “Great Inflation”
The conventional story of the “Great Inflation” is that labor markets and the Fed both got on the wrong side of a number of unobservable and quickly-changing variables. Unemployment fell below the “natural rate of unemployment” (u*), which led to rising inflation. This rising inflation de-anchored “inflation expectations” (π*), which then led to self-fulfilling prophecies of higher inflation. The Fed didn’t do enough to keep these rising inflation expectations in check, such that even as they raised interest rates, they did not raise rates far enough above the “natural rate of interest” (r*) at the time to curtail inflation. Ending the episode is then assumed to have required Volcker’s aggressive hike in interest rates to finally bring the policy rate far enough above the “natural rate” to reset everyone’s “inflation expectations.”
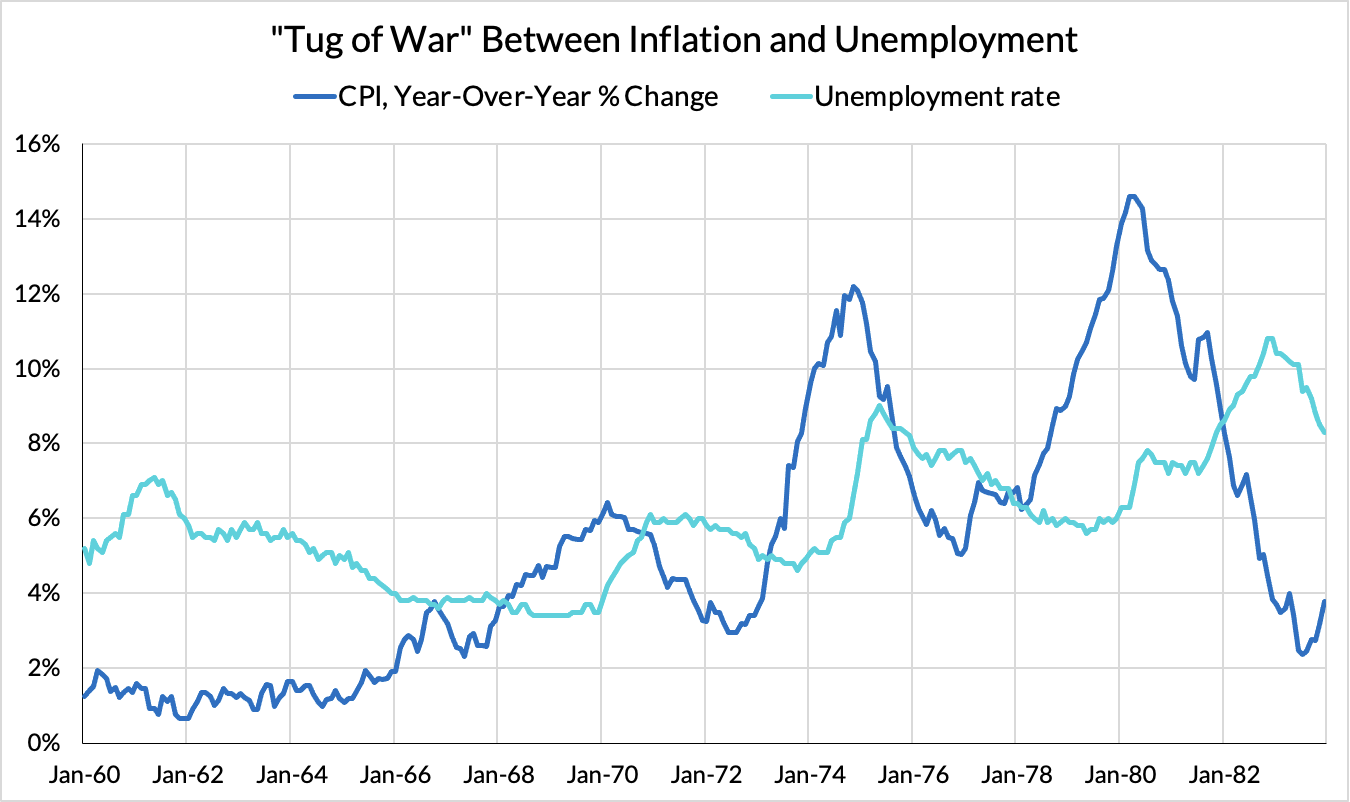
The timeline for this in the “Great Inflation” goes something like: the unemployment rate got too low in the late 1960s (3.4%), which set off inflation through a Phillips Curve dynamic. This inflation then caused workers and price-setters to reset their inflation expectations higher, and these higher expectations cashed out into a higher rate of inflation over the following decade. This tug of war then went on until the Volcker Fed hiked rates far enough to cause a major recession, which reset everyone’s inflation expectations.
The problem is, no part of this story really describes the 1950s. On the Phillips Curve side, the dynamic makes little sense. The conventional version of the Phillips curve would claim that, whenever unemployment falls below its “natural rate” inflation will increase. If unemployment goes further below its “natural rate,” inflation will come on faster and stronger. In the early 1950s, the unemployment rate reached lower lows (3.0%) than the late 1960s (3.4%).
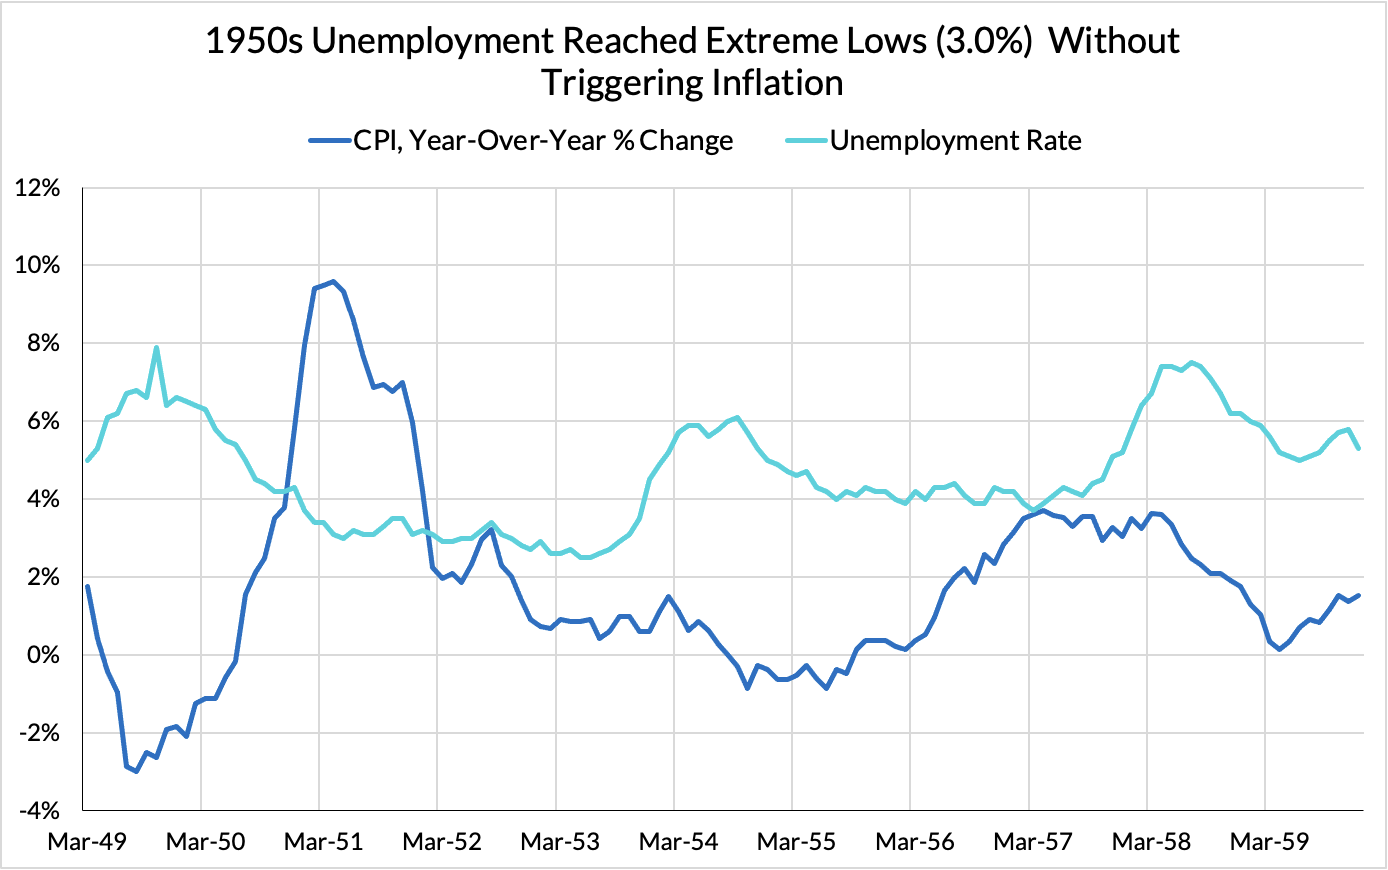
Employment gains did at first coincide with a burst of inflation, but this inflation tapered off as unemployment continued to make new lows. This is the opposite of the dynamic predicted by the Phillips curve. If the “natural rate of unemployment” was such that an unemployment rate of 4% triggered inflation in one year, then surely unemployment rates of less than 3% should trigger stronger and faster inflation two years later. However, the data shows the opposite pattern.
Granted, this period of 1950–1953 coincides with mobilization for the Korean war, and the recession coincides with the war’s end. This timeline will be important to remember when we talk about alternative explanations for the path of inflation and unemployment in the 1950s. Discrete events like wars and pandemics fall outside the scope of models like the Phillips curve, yet policies and private sector responses to the possibility of war exercised tremendous influence over the American economy for the bulk of the twentieth century.
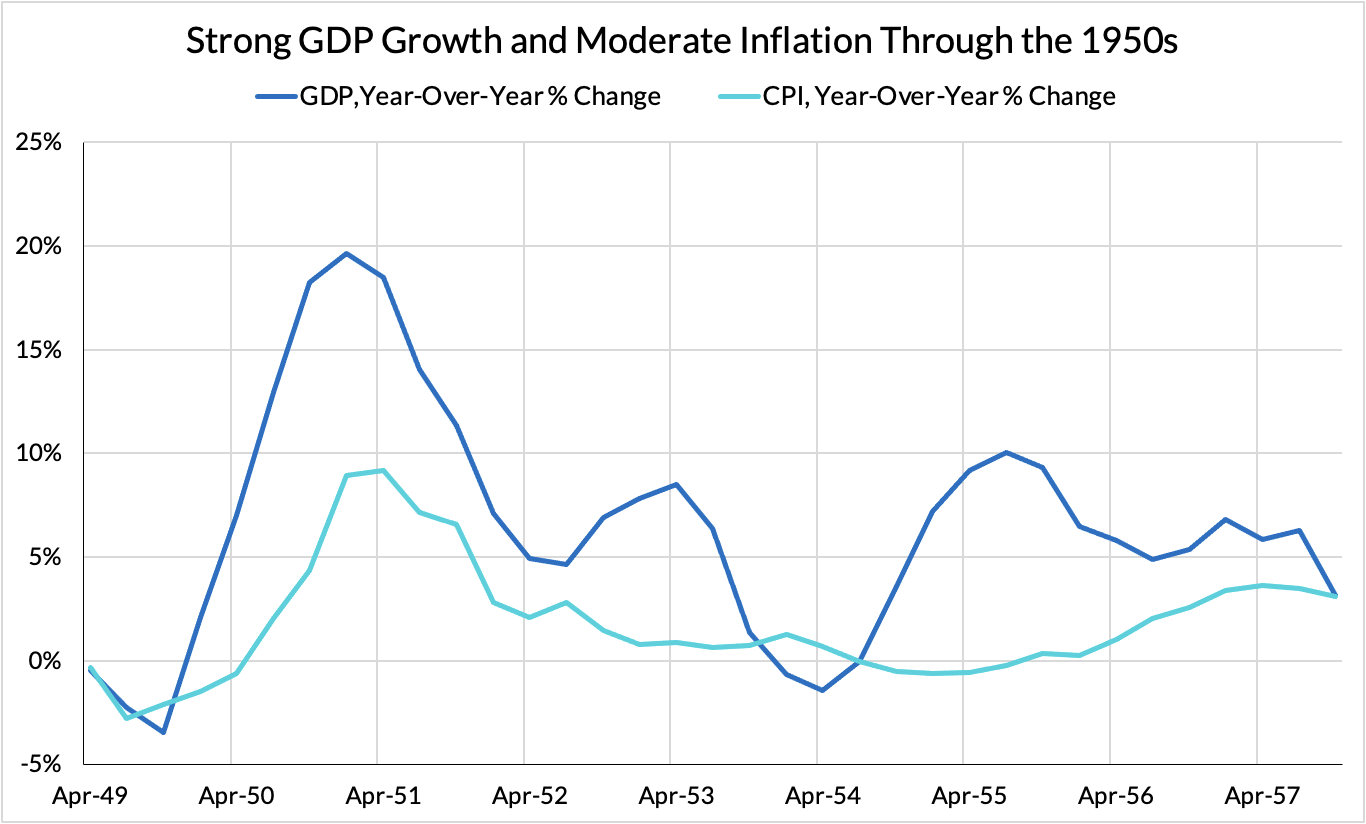
Even after the war and recession, the 1950s saw strong GDP growth, low inflation and low unemployment. Despite an average unemployment rate of 4.8% over the 1953–1959 period, inflation remained muted. The average of just over 1.3% in that period is low even by modern standards.
Inflation Expectations and the “Great Inflation”
When inflation can’t be explained by the Phillips curve, commentators and economists who rely on the conventional story shift gears to “inflation expectations.” As we will discuss later, “inflation expectations” are not in themselves a problematic concept; expectations always structure economic action. However, “inflation expectations” as figured by conventional narratives of the “Great Inflation” often reduce to “a justification for inflation we can’t otherwise explain.”
In order to make the idea of “inflation expectations” tractable using only macroeconomic aggregates, models like the “Expectations-Augmented Phillips Curve” make extreme methodological simplifications. A naive perspective would assume that inflation expectations are derived from looking around at discrete events happening in the world: a coming war, a pandemic, political turmoil in a major trading partner. However, in the conventional narrative, agents generate their “inflation expectations” based only on data that is also readily available to macroeconomists and model-builders. Rather than basing their expectations on local conditions and experiences, “inflation expectations” in the conventional story only look at past realized values of aggregate inflation measures.
There are two reasons the conventional story takes this strategy. First, it reduces the amount of empirical work that has to be done before declaring the economy to be at risk of persistent price acceleration. Second, it makes realized inflation a direct function of expected inflation, and expected inflation a direct function of past realized inflation. If price-setters expect an increase in prices, they will raise prices, creating the increase in prices that they had expected. As that higher inflation is realized, it then is assumed to reset “inflation expectations” which spiral ever upwards.
However, that story should give “inflation expectations” a particular signature in the data. Without policy intervention or dramatic labor market deterioration, inflation expectations — and thus inflation — can only rise or plateau. As such, experiences where “inflation expectations” become unanchored should look like a plateau or a staircase. The one thing they shouldn’t look like is a sawtooth, or a series of mountains, with inflation quickly rising and then falling just as quickly.
Once again, the conventional narrative falls short in explaining the 1950s data. In the 1950s, we saw inflation rise quickly and fall just as quickly, without shocks to interest rates or unemployment. We even see a similar pattern following the end of WWII-era price controls in the late 1940s. In the 1970s we see this pattern again, albeit a little less sharply, and against a backdrop of steadily rising interest rates. Inflation rates look like mountains, rather than the plateaus that the conventional “inflation expectations” story requires.
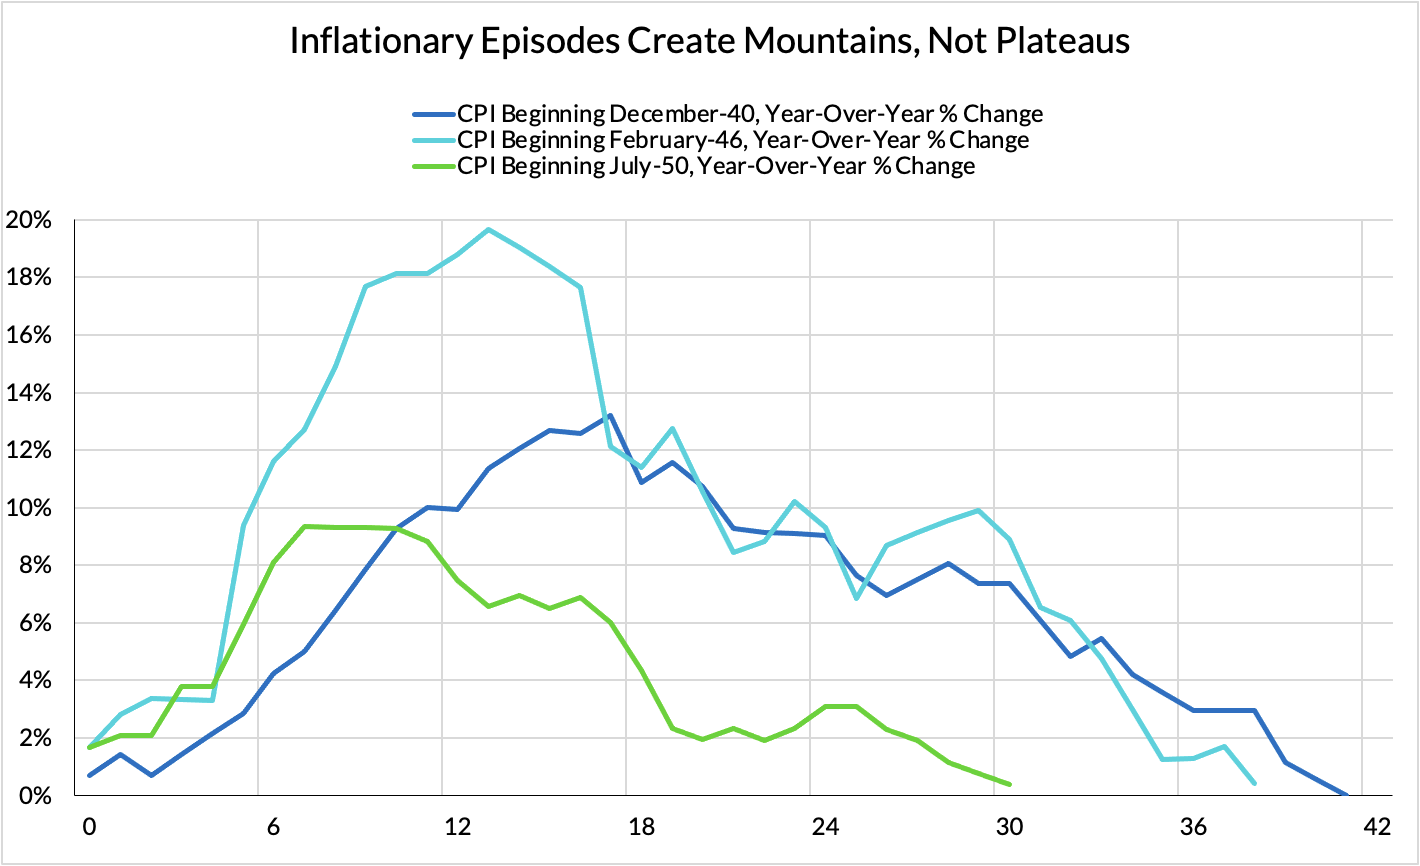
The inflation seen in 1947 after the end of price controls was far stronger, and happened much faster, than at any point in the “Great Inflation” of the 1970s. From an “inflation expectations” standpoint — especially if they are assumed to explain the bulk of the 1970s inflation — there’s no reason to think that an inflationary impulse that strong would give way to disinflation in under a year. In fact, we even see these mountains and troughs over the “Great Inflation” period. Rather than plateaus that represent inflation expectations anchored at an elevated level, we instead see periodic mountains.
If inflation expectations play a role in determining inflation — which they almost certainly do — the means by which they do so has little to do with the conventional story of the “Great Inflation.”
The Natural Rate of Interest and the Great Inflation
The third step in the conventional narrative is the need for intervention by the Fed to cut off all inflationary impulses, lest rising expectations continue to pull inflation further up as expectations become “unanchored”. In the “Great Inflation,” this is treated as the great lost opportunity to crush inflation early: had the Fed tightened rates dramatically in the 1970s, some claim, the whole problem could have been avoided. Since then, the Fed has been expected to proactively tighten interest rates whenever inflation rates print above expectations.
This tendency has become sufficiently extreme that the Fed has tightened rates on the anticipation that tight labor markets may have caused inflation which may have gone on to increase inflation expectations. Clearly the fears and mechanisms inculcated by this conventional narrative are so deeply ingrained that the threat of an unchecked inflationary threat must be responded to, even without evidence of inflation in the data.
In short, the government of the 1950s made every policy mistake that the conventional narrative of the “Great Inflation” warns against, while landing in a macroeconomic sweet spot of strong growth, low inflation and low unemployment.
This leaves a final question: if the conventional story of the “Great Inflation” can’t explain the 1950s experience, then what does?
Capacity, Demand, and “Inflation Expectations”
Although “inflation expectations” is treated as an ill-supported catch-all residual in the conventional story, it does not have to be. Consider a different view of “inflation expectations.” In 1950, just before inflation took off, it became clear that the Korean war had the potential to become a sustained engagement. Firms and producers, remembering the recent experience of WWII rush to build up inventories in anticipation of high wartime demand. At the same time, speculators try to front-run one another, by buying up commodities they anticipate will be in high demand in a wartime economy. At the same time, firms and workers tried to actively front-run wage and price controls. Taken together, these behaviors look a lot like a kind of inflation expectation. Price setters think that, once the war begins, there will be a high demand for labor and for certain goods against a backdrop of wage and price controls, so they bid up the price trying to get ahold of them before their prices rise.
Instead of fixing inflation expectations at a high level, firms changed their strategies dynamically as the path of the war unfolded. Once it became clear that the Korean war would not require the same scale of economic overhaul or active management as WWII, inflation expectations quickly normalized. Mainstream accounts center the importance of the Fed-Treasury Accord here, arguing that the freeing of the Fed to raise interest rates to fight inflation was decisive in explaining the low inflation that followed. However, despite the Fed-Treasury Accord — which functionally freed the Fed to raise interest rates as it saw fit (see more here) — rates remained relatively stable for the entire inflationary period.
The account of “inflation expectations” that this experience implies is one centered around world events, rather than past realized values of inflation. This version adds a degree of empirical realism, but sacrifices the idea that inflation — once started — will create a self-sustaining upward spiral. Instead, inflation rises and falls as expectations about the future change. Capacity adjusts, or the situation originally motivating higher inflation expectations ends, and inflation falls.
This approach offers another frame for understanding the “Great Inflation” of the 1970s as well. While it is beyond the scope of the present piece to develop a comprehensive history of the 1970s inflation, we can point to the outline of an alternative.
Changing demographics and international trade patterns meant changing structures of demand, which capacity could only slowly accommodate. Adapting to this changing landscape required substantial increase in the volume of, and changes in the output of, industrial, agricultural and energy capacity.
Depending on the nature of the capacity deficiency, such capacity augmentation can require a substantial yet uncertain amount of time, labor and investment. Dramatically increasing investment spend can also contribute to inflation in the short run, despite creating disinflation in the long term. Until new capacity is built out, prices for remaining capacity are bid higher. At the same time, if domestic workers are primarily responsible for building out that capacity and consume the same things as other workers without increasing the production of those things, they thereby help drive up the price.
These capacity bottlenecks and the major reorganization of supply chains required to alleviate them help explain the persistence of inflation despite slack in labor markets. It wasn’t that “inflation expectations” were permanently high due to high realized inflation, but rather that investment in new capacity is usually inflationary in the short-term. At the same time, firms had to consistently brace for new and ill-understood economic shocks as the post-WWII period ended and trade evolved.
Both of these new stories have ways to tell us much more than the conventional narrative of the “Great Inflation,” and also offer sound policy advice as we exit the disruptions caused by the pandemic.
Much post-pandemic measured inflation can be traced to changes in consumption patterns. Sharp jumps in demand for semiconductors were well outside of the normal range of conditions that those managing supply chains and productive capacity had relied on for 10–20 years. Rental cars sold off fleets of cars in order to conserve balance sheet space as bookings plunged. As market conditions improved, restocking those fleets has required the bidding up of prices for new and used cars to such a degree that it has skewed aggregate inflation readings. Some employers are still having a hard time hiring staff, but this is happening in high-visibility sectors that let most employees go at the beginning of the pandemic.
Ultimately, the experience of the 1950s teaches us that transitory inflation associated with new capacity recedes without necessitating policies that kill jobs as a show of “credibility” to keeping inflation expectations anchored. The 1950s show that it’s possible to do everything the model considers a “policy mistake” while achieving low inflation and low unemployment. When seeking to resolve the inflationary pressures and capacity shortfalls associated with the end of the pandemic, policymakers should be looking to identify the direct causal mechanisms and contextual insights that explain how these dynamics emerge and avoid hand-waving about loosely-specified fudge factors and statistical residuals.