Hedging Natural Gas Shocks: How Gutting the IRA Risks Prolonging Electricity Price Pain


Congress is considering raising the tax burden on electricity investment and production supported through tax credits (ITC & PTC) enacted in the Inflation Reduction Act of 2022 (IRA). These provisions support building generation capacity across a range of sources, including nuclear, geothermal, energy storage, wind, solar, and hydro, thereby diversifying a sector currently led by natural gas. Part of the justification for the ITC & PTC was the additional development and returns to scale that could be unlocked from otherwise underinvested sources and technologies. But as a first-order matter, the rollback of these tax credits will simply make it more costly for the private sector to construct and to deliver affordable electricity production across these sources.
At 43% of national electricity generation, natural gas is the primary source for powering the United States. Its flexibility, reliability, and relative abundance has made it critical to how electricity prices are set at the margin. Unfortunately, we are also in an environment of (1) surging data center demand to support the artificial intelligence boom, (2) growing liquefied natural gas (LNG) export capacity and sensitivity to foreign demand, and possibly (3) waning byproduct natural gas production if oilpatch investment continues to decline. All three dynamics pull up on the price of natural gas. And at the same time, we appear to be in a multi-year bottleneck for gas turbines and rising costs for constructing additional natural gas power generation.
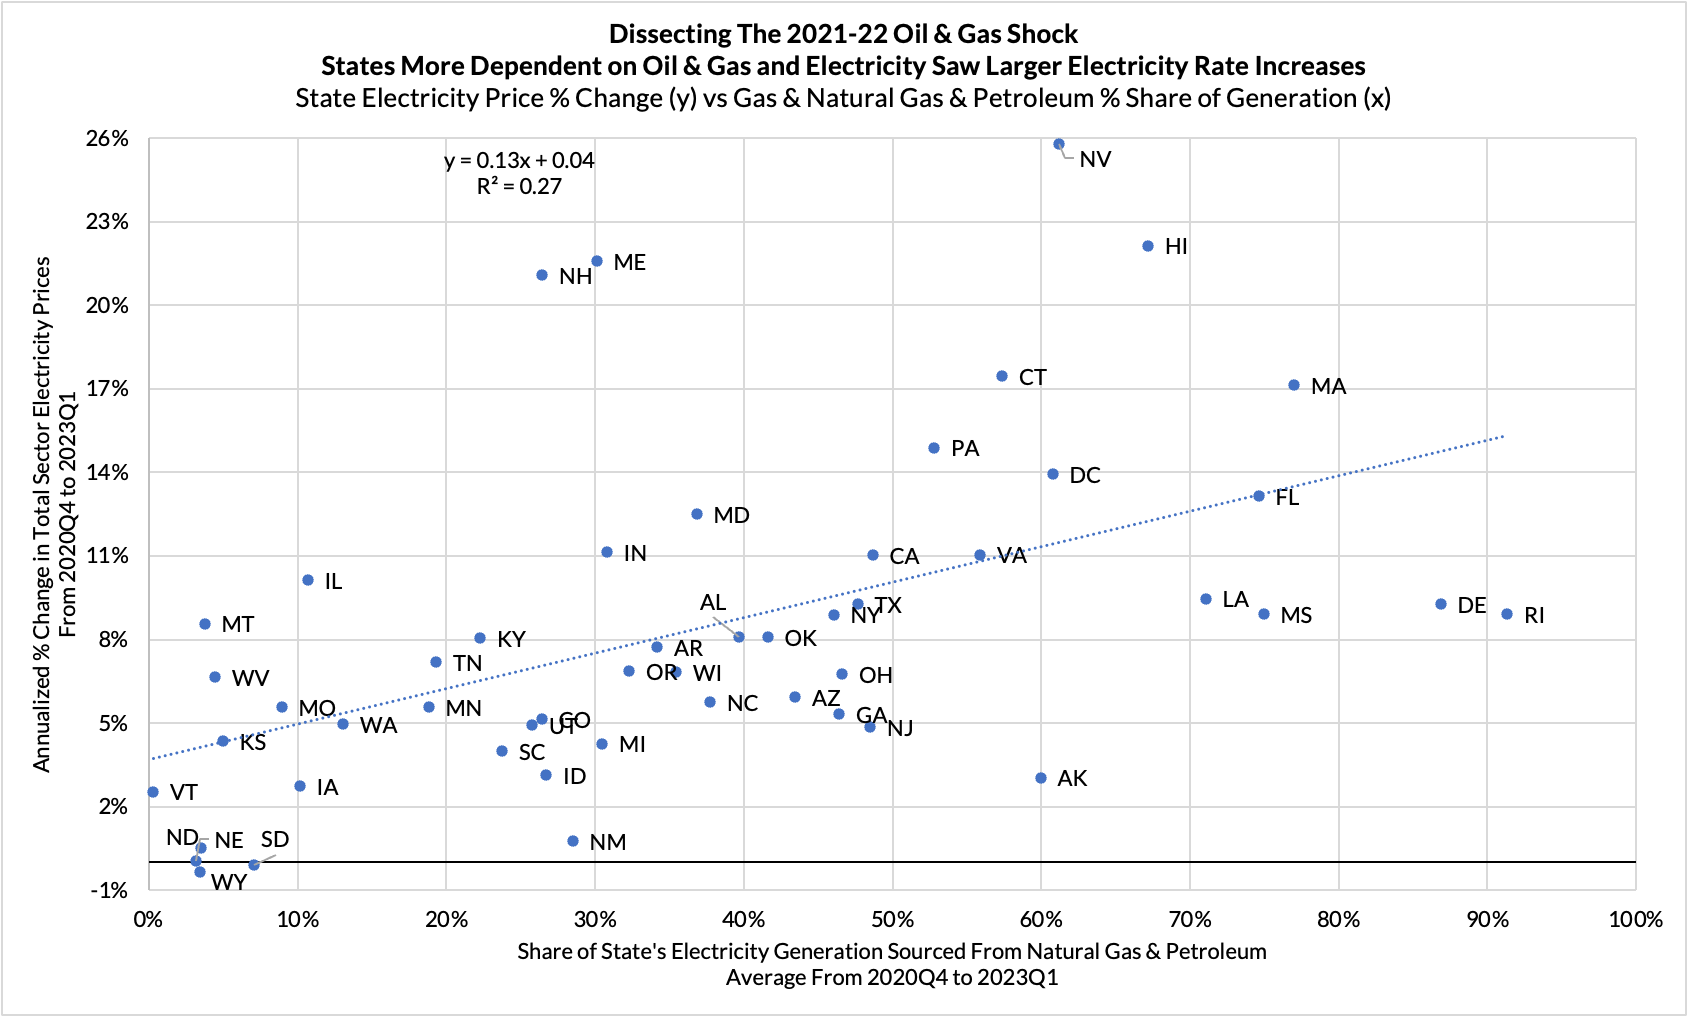
What is even less appreciated: less diversity in electric power generation leaves more Americans vulnerable to the forces already pulling up natural gas prices across the country. As this report details, in the 2021-22 period when natural gas prices surged from $2 to as much as $10/MMBTU, states with high shares of electricity generation sourced from natural gas and petroleum were more vulnerable to high rates of electricity inflation. Given their related production and partial substitutability, the natural gas price spike understandably materialized alongside a surge in crude oil prices and refining margins, driven by (1) an uneven recovery from the pandemic and energy price crash of 2020, and then (2) the Russian invasion of Ukraine. There are many forces that shape the price of electricity, but even simple analyses reveal how over a quarter of the variation in state-level electricity inflation can be attributed to a state's generation mix in the midst of a gas price shock.

After accounting for the role of integrated power and gas markets in key regions, it becomes even clearer how a more diversified mix of electricity generation can be a valuable hedge against natural gas price spikes. From 2020Q4 to 2023Q1, a 20% larger share of total generation sourced from oil & gas implied an additional 7% increase in electricity prices on average, though with substantial scope for variance and upside skew.
We are now at a point where a substantial dose of electricity price inflation is on the doorstep and likely unavoidable as a result of data center demand inflecting. Natural gas prices are up over 100% from a year ago. Customers are likely to see significantly higher electric bills, especially as of the month of this report (June 2025). At the same time, Congress sees the strategic significance of supporting LNG export capacity and the data center buildout to support AI development. Both of these dynamics will pull on natural gas and electricity prices if left unchecked.
To best hedge Americans against the risk and effects of such strategic priorities on natural gas prices, power generation would need to be less gas-dependent. Rolling back the ITC and PTC will undermine the development of alternative generation sources, including the development and deployment of nuclear, geothermal, hydropower, energy storage, wind, and solar technologies. That would leave the American energy system under-diversified, exposing Americans' electricity bills to higher volatility and higher costs over time.
Electricity prices are rising, and for households and businesses across the country, the pain could get much worse. Even as inflation cooled slightly this month, consumer electricity prices increased by 0.9%, and are up over 4.5% over the past year. The risk of further increases is especially acute in states served by PJM, the nation’s largest electricity market, where utility rate hikes are already taking effect.
These cost increases are not accidental. They stem from intensifying pressure on natural gas—the fuel that dominates U.S. power generation and sets the marginal price in many markets. That pressure is unlikely to ease anytime soon. Electricity demand from AI-driven data center growth is accelerating just as natural gas prices are being pulled higher by expanding LNG exports and likely declining byproduct production from a weaker domestic oil sector.
We’ve seen this story before. During the 2021–22 energy shock, states that rely more heavily on natural gas and petroleum for electricity generation experienced the sharpest electricity price inflation. States with more diversified generation portfolios—nuclear, hydro, coal, or renewables—fared far better. The lesson is clear: energy diversification shields consumers from fuel price volatility.
But just as pressure on natural gas is building again, Congress is considering policies that would weaken that shield. The House of Representatives recently passed tax increases on the very technologies—nuclear, geothermal, hydropower, energy storage, and renewables—that helped insulate consumers in 2021 and 2022. While President Trump takes a victory lap on inflation, Congress’ push to tax energy diversification risks turning this summer’s price surge into a prolonged crisis.
Natural gas is integral to meeting electricity demand at the margin and thus setting prices. While spot natural gas prices are far more volatile than electricity prices, the latter regularly responds to a surge in the former, especially over the last 25 years. Every time natural gas prices surge by over 50% on a year-over-year basis, we see meaningful acceleration in electricity price inflation. The elasticities vary over time, in part because there are other factors that affect national electricity prices beyond natural gas. Nevertheless, the reliability of such a relationship demonstrates a core characteristic of the US energy system: natural gas prices drive electricity prices.
In most, but not all, parts of the country, natural gas can flow easily by pipeline to meet markets where supply is falling short of demand. Hydraulic fracturing has made natural gas more available in the United States, both for domestic consumption and for export. Even for states and regional markets with high shares of non-gas generation, natural gas prices may play the key "swing" role in ensuring that demand and supply always equilibrate, and thus can always set the price at the margin.
What appears to be less understood: how the mix of electricity generation affects the exposure of electricity customers to natural gas price swings. The most recent shock to natural gas and petroleum suggests that the effect of those prices on electricity pricing is far from uniform. Electricity customers' insulation from oil and gas price shocks is directly a function of their state's ability to generate and source electricity from sources other than oil and gas.
We have recent experience with energy commodity price volatility and its relevance to electricity pricing. The seeds of the price spike that dominated 2021 and 2022 began in the depths of the pandemic in 2020, only to be subsequently amplified and exacerbated by additional geopolitical forces.
The 2020 pandemic coincided with an oil price war between Russia and Saudi Arabia, and, as a result, energy prices crashed to some of the lowest recorded levels in history. From $60/barrel at the beginning, oil prices in the United States traded at negative levels due to the glut; you had to pay someone to take delivery of a barrel of oil in the depths of spring 2020. Even after the most acute period glut ended, oil prices were still 33% lower in the fall of 2020.

Natural gas prices didn't fall as precipitously as oil prices but fell nevertheless in 2020, from approximately $2.30 per million BTU down to $1.50, a 35% reduction. In both cases, the pandemic had foreclosed key outlets of consumption, first triggering a fall in prices, and subsequently a reduction in production and investment.
Only after demand stabilized and active cuts to production and investment from major producers did prices stabilize at depressed levels. US producers faced a wave of restructurings and financial constraints, while OPEC producers committed to production cuts. These actions, initially in response to a collapse in demand, were also curtailing supply...just as demand was primed for a sharper recovery from the pandemic.
And so it's with this starting point that we can date the beginning of the sustained surge in oil and natural gas prices to the final quarter of 2020, when oil and natural gas prices were well past their troughs.

2021 and 2022 saw oil and natural gas prices surge. Much of the 2021 rise in oil prices could be attributed to a predictable and arguably beneficial rebalancing of global oil demand relative to supply. A cyclical recovery also pushed up natural gas demand and consumption. While the Texas freeze in February 2021 caused a simultaneous rise in natural gas demand and a throttling of production that caused prices to spike past $20 nationally before reverting, that was a one-off in the context of the broader price surge.
Through the latter half of 2021, the recovery was still pulling up demand, but prices were also responding to new developments. The newfound financial discipline of US producers was reducing the elasticity of investment and production to price ("capital discipline") and allowing OPEC to maintain their production cuts and oil prices to continue marching higher. Ahead of fears that there might be consecutive cold winters due to La Nina and growing US LNG export capacity, Asian and European demand for LNG was anticipated to be strong and pulling up natural gas prices.
Of course the major dynamic that drove the second half of the oil & natural gas price shock of 2021-22 was the Russian invasion of Ukraine. Prices were already rising in anticipation of the risk of the war, and once the war broke out, prices rose further to reflect the risk of greater shortages. As a major supplier of natural gas to the rest of Europe and of crude oil and refining capacity across the world, Russia could threaten to precipitate substantial supply losses for oil and natural gas. As a result, prices rose further through 2022 to reflect this risk.
The interconnectedness of oil and natural gas is also worth noting, as both are sources of fuel for electric power generation, and both are often produced together, with natural gas materializing as a byproduct of onshore crude oil extraction. These were correlated phenomena for a variety of reasons and thus this episode cannot neatly separate the oil shock from the natural gas shock. The oil and natural gas components of this shock are best analyzed as a bundle when studying the relevance of this episode.
The totality of these shocks was severe. From an average of $2.50/MMBTU in 2020Q4 for natural gas in the United States, prices nearly hit $10 in late August of 2022, close to a 300% increase. Oil prices also surged from an average of $42.50/barrel in 2020Q4 for crude oil in the United States to roughly $120/barrel both in March and June of 2022, close to a 200% increase. As the first chart demonstrates, electricity prices typically respond with a 1-3 quarter lag to these dynamics, and electricity rates are often only reset at the beginning of a new calendar year. Thus even as oil and natural gas prices subsequently subsided, the effects on electricity prices were likely not fully baked until the first quarter of 2023.
Average retail electricity prices in the United States across all sectors rose 20% from 2020Q4 to 2023Q1. This was a sizable jump in the price of an essential energy service, growing at an annualized rate of 8.4% over nine quarters. For context, average retail electricity prices grew at only a 0.8% annualized rate from 2009Q4 to 2019Q4.
Natural gas is the dominant source of electricity generation across the United States, but its relevance does vary. At a time when Congress seems eager to support AI development and the geopolitical value of LNG exports, it seems equally important to reckon with the knock-on effects of natural gas to the key service prices everyday Americans pay for. For one-off states like Hawaii and Alaska, and to a lesser extent Louisiana, Massachusetts, and Michigan, petroleum is a relevant source of power generation.
Given the coincident and historic rise in natural gas, petroleum, and electricity prices over the discussed period, the 2021-22 period deserves special study. We saw a major shock to electricity prices with a reasonably identifiable set of causes. It's true that other causes were relevant, but even a simple one-dimensional analysis is illustrative.

States with higher shares of electricity generation from natural gas and petroleum were, on average, more heavily exposed to electricity price increases. While the precise effect in each state varies, and there were surely other causes at play, a given state's share of electricity generation from oil & gas is still a powerful explanation for state-level electricity inflation. A simple linear regression can pick up over a quarter of the variation in state-level electricity inflation over this period.
This dynamic was true regardless of the precise source of electricity that provided diversification. States like South Carolina and Illinois benefited from high shares of nuclear power generation. Washington benefited from abundant hydroelectric power, while South Dakota saw some of the lowest electricity price increases due to wind resources. Still, others like Wyoming and West Virginia were insulated due to local coal resources.
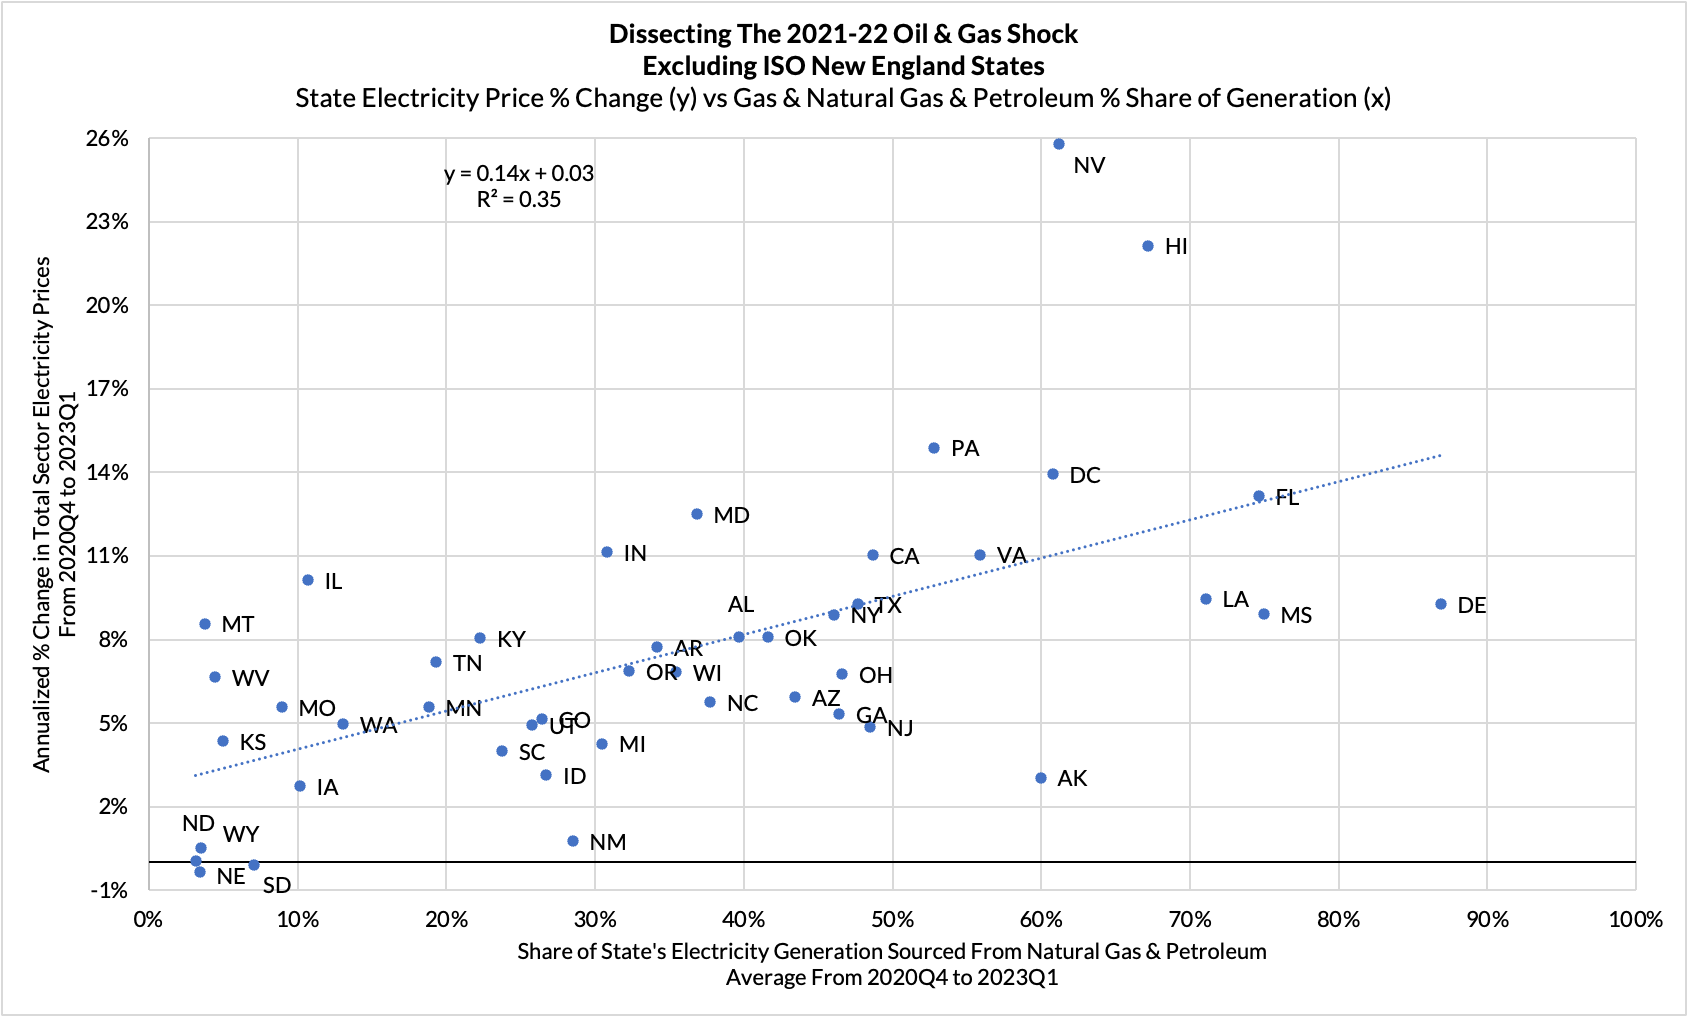
This relationship also appears to be strong in spite of some clear factors that might complicate the analysis. Electricity is transmitted and distributed across state lines, but because there are losses and costs to doing so, electricity consumption and electricity generation tend to be closely related for most states. There are exceptions to this dynamic, and those exceptions tend to drive the outliers. For a highly integrated interstate wholesale market like New England, what matters are resources across the interstate region. Even as New Hampshire has a high share of nuclear generation and Maine has a high share of hydroelectric power generation, New England as a whole is highly dependent on natural gas for power generation. In contrast to California, Texas, New York, the Midcontinent Independent System Operator (Midwest), the Southwest Power Pool (Plains), the Western Power Pool (Northwest & Mountain West), and PJM (NJ, PA, OH, MD, WV, DE, VA, KY), New England stands alone in how much power it sources from natural gas (over 50%).
Worse yet, New England is substantially constrained in its pipeline connectivity to onshore natural gas resources. That means the marginal cubic foot of natural gas to meet New England's power demand is typically via imported LNG, which commands a premium and is likely to be most sensitive to global natural gas market swings.
Even just by accounting for the lone effect of New England idiosyncrasies, the relationship between oil & gas shares of electricity generation and electricity price inflation appears even stronger.

Excluding the states within the ISO NE (New England Independent System Operator), the variation in the share of each state's electricity generation sourced from natural gas and petroleum can explain a little over a third of the state-level variation in electricity price inflation over the critical 2021-22 period. For an additional 20% of total state electricity generation derived from oil and gas, electric bills were liable to increase by an additional 7% in a given year.
Just as important as the average price increase is the skew of risks as oil and gas grows dominant as a share of total electricity generation. The largest outliers, Nevada and Hawaii, are also among the most dependent.
As Congress debates and considers changes to the tax treatment of constructing generation capacity and power production, it should reckon with the full set of risks. We are already seeing higher natural gas prices as a result of rising LNG export capacity and the AI-driven demand for power from data centers. If those dynamics are to be treated with strategic priority, consumers are vulnerable to paying more for electricity. The right approach to cushioning consumers should involve expanded supply and expanded diversification, particularly where sources have high commercial potential but vulnerability to underinvestment from the private sector.
At a time when Americans are likely to be stiffed with even higher electricity bills and utility gas service prices, it does not make much sense to be raising the tax burden associated with constructing additional electricity generation capacity, and producing power for American consumers. It makes even less sense to encourage a more homogenous power system reliant on natural gas when natural gas prices are rising, exhibiting more volatility, and subject to their own multi-year supply constraints.
Intelligent diversification has already proven, at the state level, to be an important insurance policy against major price shocks and geopolitically driven supply outages. Preserving the incentive to invest in geothermal, nuclear, hydropower, and renewables with storage can unlock a more diverse and commercially potent energy system, resilient against a wider range of shocks. The United States can better balance competing strategic priorities without sticking Americans with even higher electricity bills.