Labor force entry likely explains between ⅓ to ½ of the rise in US prime-age participation from its recent trough, and that the level and slope of labor force flows suggest prime-age participation may have even further to rise in the absence of exogenous shocks.
Employ America welcomes our first guest writer, Ernie Tedeschi!
Ernie Tedeschi is a policy economist and the Head of Fiscal Analysis at Evercore ISI, a macro advisory firm. He is also an occasional contributor to The Upshot section at The New York Times. Previously, Ernie was a Senior Advisor and Economist at the US Department of the Treasury. His research interests include the federal budget, monetary policy, and labor markets. You can follow him on Twitter at @ernietedeschi. The analysis here is solely his own.
Summary
The labor force participation rate of prime-age (25–54 year old) Americans has risen almost 2 percentage points since its trough in 2015.
Labor force growth must be due to some combination of higher labor force entry rates and/or lower labor force exit rates; it is an open question how much each has contributed to the recent rise.
A recent study published by the Federal Reserve Bank of San Francisco (Barnichon (2019)) attributes virtually all of this rise to lower labor force exit and concludes that the tightening labor market of the last five years has not pulled in new workers.
By contrast, I show that this finding is not robust when looking at flows that are: 1.) adjusted for internal errors and inconsistencies; 2.) measured year-on-year rather than month-on-month; and, 3.) calculated from broader or narrower measures of labor supply.
I conclude that labor force entry likely explains between ⅓ to ½ of the rise in US prime-age participation from its recent trough, and that the level and slope of labor force flows suggest prime-age participation may have even further to rise in the absence of exogenous shocks.
Introduction
The Great Recession hit the American labor force hard. By 2015 Q3, the share of Americans age 25–54 who were classified as in the labor force — those with or actively looking for a job — had dropped to 80.7%, the lowest prime-age participation rate since 1984.
But in retrospect, we now have strong evidence that much of the decline was due to the soft economy. One tell is how participation has behaved in the tightening labor market of recent years: by 2019 Q1, the prime-age participation rate had risen to 82.6%, almost two percentage points up from its 2015 trough.
A recent Economic Letter from the Federal Reserve Bank of San Francisco makes the case that the rise since 2015 was almost exclusively because workers began leaving the labor force at smaller and smaller rates (“labor force exit”), not because of new entrants into the workforce (“labor force entry”). This would mean that the tight American labor market hasn’t really pulled workers back into the nation’s labor supply.
The San Francisco Fed analysis based its conclusion solely on month-to-month flows in the Current Population Survey (CPS), but there are two weaknesses to its approach.
First, a growing literature shows evidence of possible internal inconsistencies and errors in CPS labor force status. I find that correcting for these errors meaningfully changes, and under certain assumptions fully reverses, the month-to-month flow story.
Second, the San Francisco Fed analysis did not test the sensitivity of its conclusions against other approaches, either by using year-on-year rather than month-to-month flow calculations, or by looking at different labor force definitions.
Addressing both of these issues, I come to a wholly different conclusion. Both labor force exit and entry contributed to the recent participation rise, the latter responsible for between ⅓ and ½ of the rise. Moreover, the level and slope of these metrics’ reads since 2015 are consistent with further rise in prime-age participation in the absence of exogenous shocks.
On bathtubs and participation
Labor supply can expand through two different mechanisms: by workers coming back into the labor force (a rise in labor force entry), or by a stem in the flow of workers leaving the labor force (a fall in labor force exit).
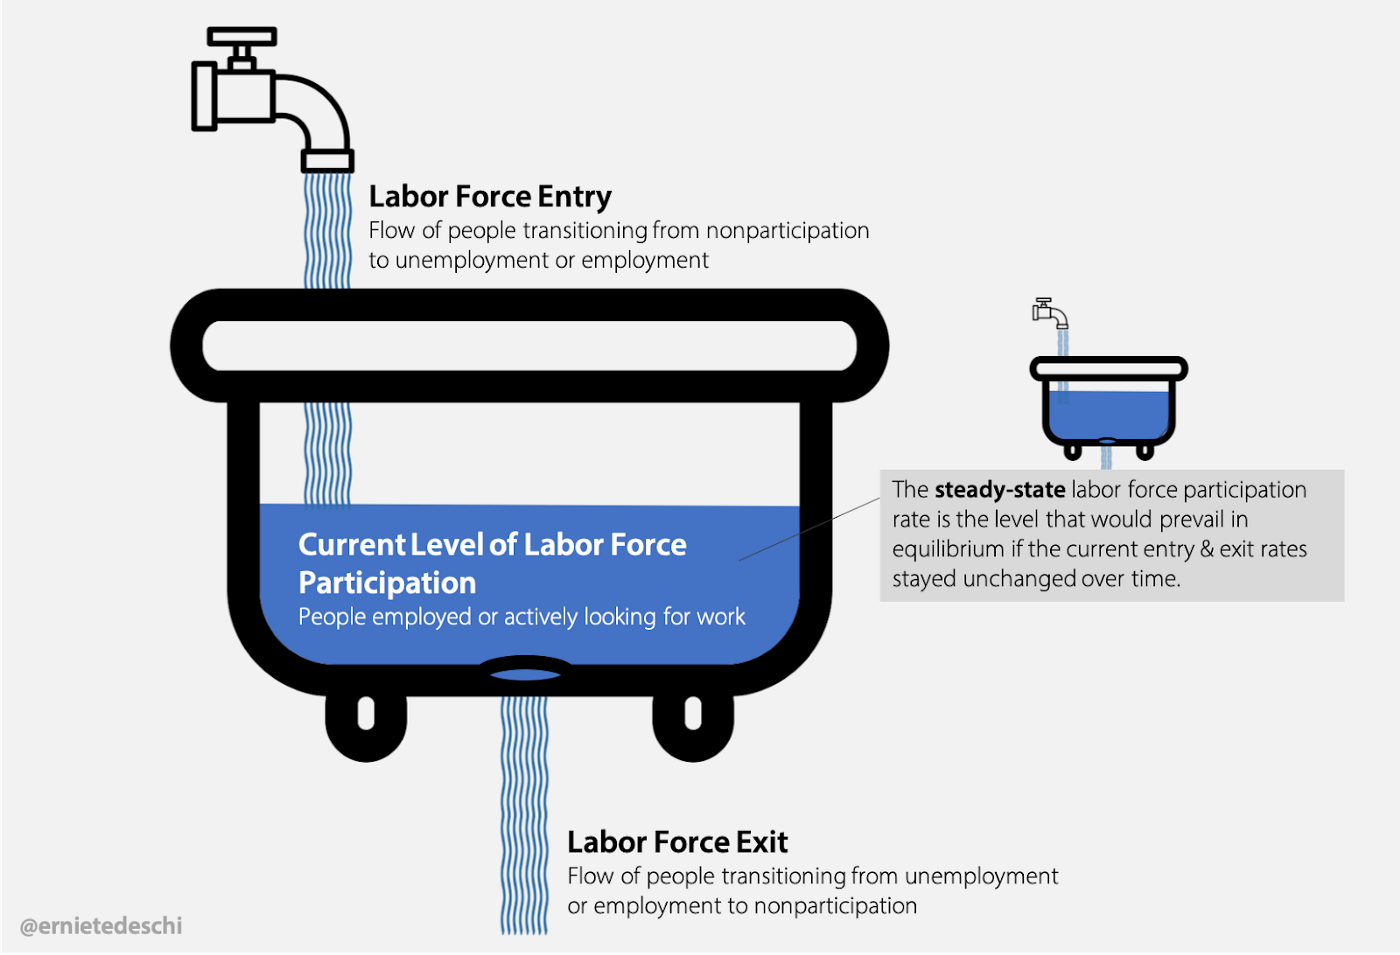
The more formal depiction of this logic is often called a bathtub model, and it’s used in economics, demography, the natural sciences, and engineering.
The upshot of the bathtub model is that the “steady state” level of a metric is the level that would prevail in equilibrium if both entry/inflow and exit/outflow rates remained unchanged over time.
The mathematical version of the graphical explanation above follows this equation:
To give a specific example: if every month 8% of nonparticipants entered the labor force, and 2% of the labor force left it, then over time if those flows didn’t change we would expect actual labor force participation to converge to the steady-state rate of 80% (8%/(8%+2%)).
But the math is far less important here than the underlying mechanics. Labor force participation can rise either because the rate of people entering the labor force has risen (in keeping with the bathtub analogy, this is like more water coming out of the faucet) or if the rate of people exiting the labor force falls (like if the drain was clogged), or some combination of the two.
A recent FRBSF analysis suggests all of the participation rise stemmed from lower labor force exit.
In a May 2019 Economics Letter, San Francisco Federal Reserve labor economist Regis Barnichon looks at the behavior of entry and exit rates in the CPS and concludes that virtually all of the rise in prime-age participation after 2015 was due to a fall in labor force exit. Based on these estimates, the hot economy had little to no impact on labor force entry rates.
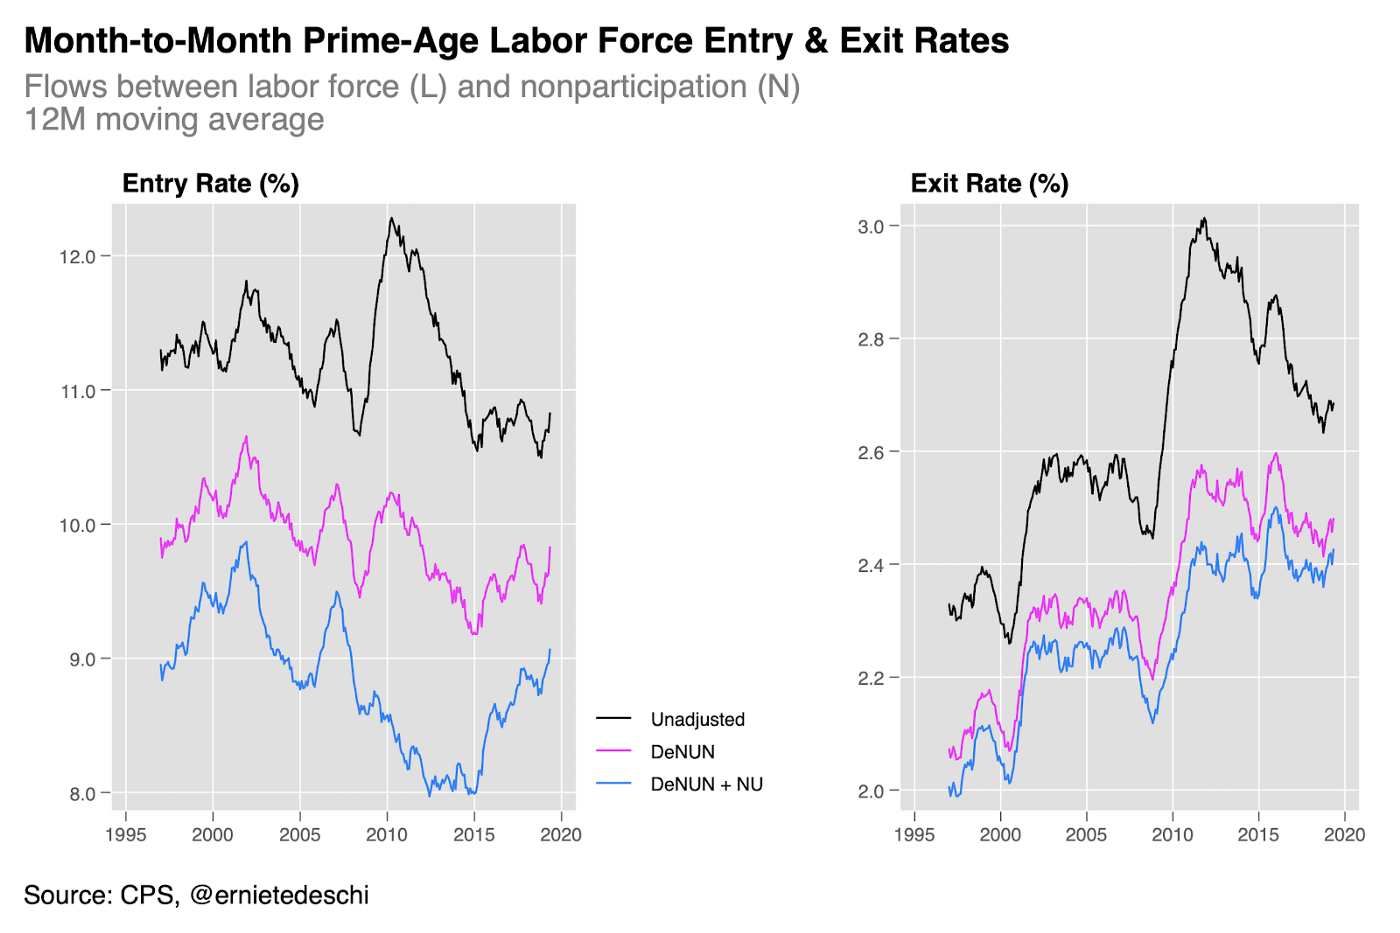
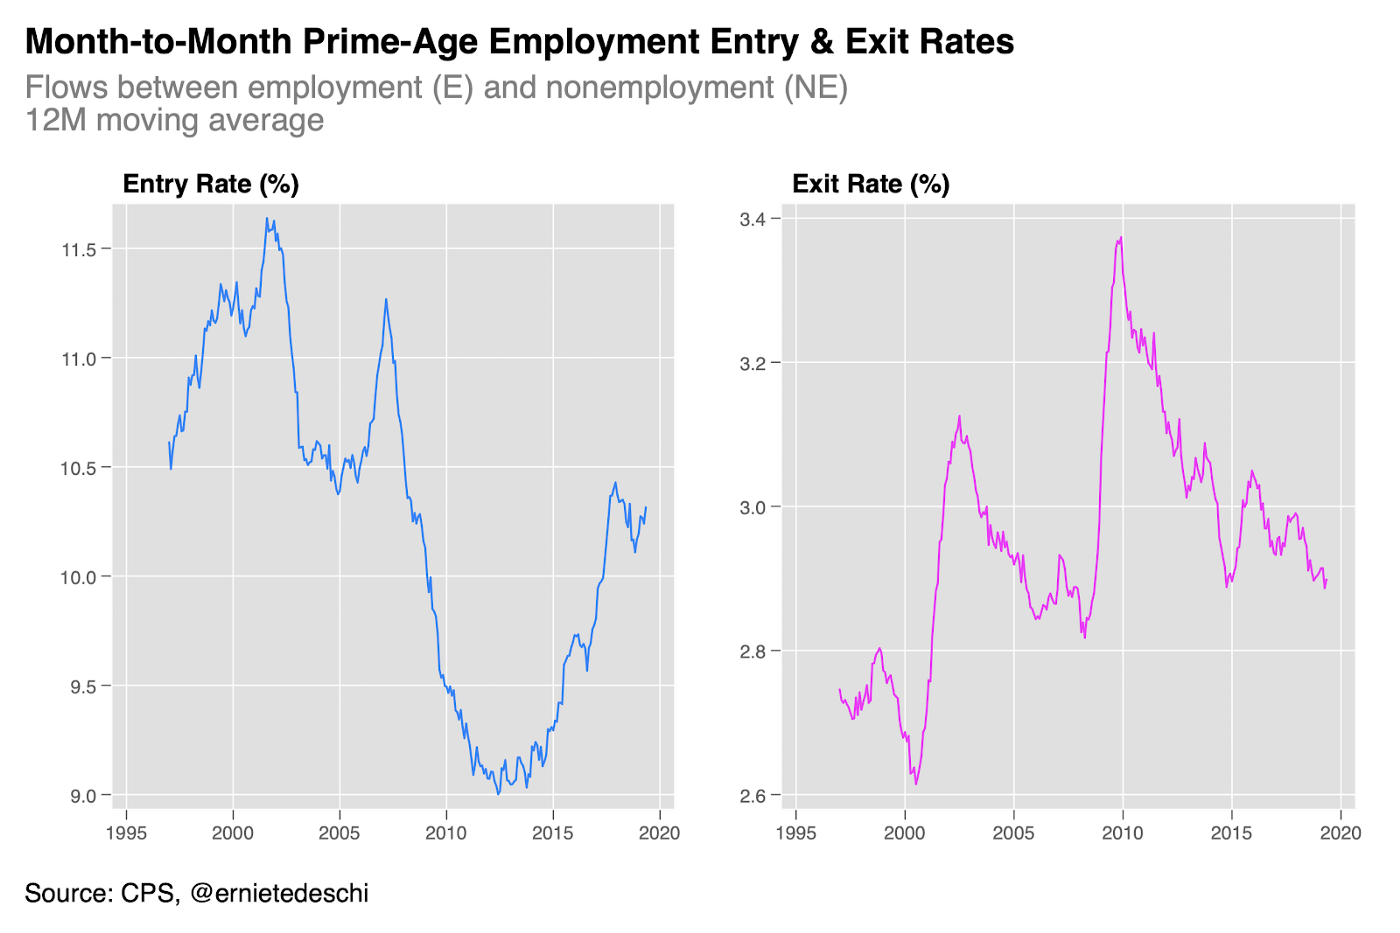
I’ve reproduced the Barnichon (2019) data series below, which is month-to-month and takes CPS labor force status as-is with no adjustments. [1] Both unadjusted labor force entry and exit rates spiked in the wake of the Great Recession, and then fell subsequently. Entry rates flatlined beginning around 2015, while exit rates have generally continued to fall. Barnichon (2019) concludes then that the rise in participation must have been driven entirely by declines in the level of labor force exit.
Decomposing the entry and exit effects from October 2015, when the 12-month average of actual prime-age participation troughed, to May 2019 under the Barnichon (2019) approach, exit is responsible for 96% of the rise in prime-age participation, with entry contributing the other 4%. Starting the clock at October 2013 instead, when the steady-state participation rate troughed, the exit contribution rises to 129% since month-to-month unadjusted entry is down slightly from that date.
Barnichon (2019) goes on further to make a slope argument, pointing out that there’s no indication from this month-to-month flow data that the labor force entry rate is poised to rise. He therefore concludes that the US is unlikely to see sustained higher labor force entry in the short- to medium-term.
Note that unadjusted month-to-month labor force exit is falling and may still have further to fall.
However, even on Barnichon’s own terms, a flattening of one mechanism (entry) doesn’t necessarily mean that the level of prime-age labor force participation has peaked. Exit rates, the other mechanism,are falling but remain elevated from their 2007 and 2000 lows. If one concluded that labor force exit had further to fall, then the implication is that prime-age participation by extension still has further to rise.
Under the Barnichon analytical framework, I calculate that if unadjusted month-to-month labor force entry were unchanged but labor force exit continued falling, then the prime-age labor force participation rate would rise another 1 percentage point under the 2007 exit rate, and 2 percentage points under the 2000 exit rate.
This is not dispositive of course — there may be factors preventing entry and exit from reaching pre-crisis levels. But the point is that even using the Barnichon methodology, we may not be at peak prime-age labor force participation yet.
The distinction between unemployment and non-participation is often inconsistent within the CPS.
Economists should be cautious about drawing strong conclusions solely from unadjusted month-to-month CPS flows, because the distinction between participation and non-participation can be inconsistent for some CPS respondents over time.
Determining whether a person in the CPS is entering or exiting the labor force often hinges on the distinction between being “unemployed” — out of work but actively looking for a job — and being a “nonparticipant”: out of work and not actively looking.
Both involve periods of non-work, but an unemployed person is still in the official labor force, whereas a nonparticipant is not. The CPS includes a series of questions meant to guide and prompt household respondents with these distinctions.
Most respondents to the CPS appear to have consistently-coded labor force status over time. But some labor force status records appear to be susceptible to classification error.
For example, Ahn & Hamilton (2019) notes duration inconsistencies: some people who are nonparticipants in the CPS one month and then switch to being unemployed the next consecutive month also report that the duration of their unemployment spells have been greater than a month. But this is internally inconsistent within the CPS: a person switching statuses into unemployment should report being unemployed no more than one month.
Meanwhile, Abowd and Zellner (1985), Poterba and Summers (1986), and Elsby, Hobijn, and Şahin (2015) also identify cases of spurious transition, where households will move from, say, unemployment to nonparticipation and back again over three consecutive months. In principle this is entirely possible, but in practice these temporary flows may effectively be noise rather than signal.
Once we adjust for these issues, labor force entry becomes a more important factor in month-to-month transitions.
To test the robustness of the Barnichon (2019) approach, then, I make two adjustments to account for possible errors mentioned above.
The first is an adjustment suggested in Elsby et al (2015) which the authors colorfully term “deNUNifying”. For CPS records in the first four or second four monthly rotations [2], a record that switches from N to U and then back to N again in consecutive months (NUN) is treated as N for all three (NNN); likewise if an N record was U in both the prior and subsequent month (UNU), it’s changed to U for all three months (UUU). The two exceptions are if the record switched between U and N each of the four rotation months (UNUN or NUNU); in those cases, I leave the records as-is since either state is an equally-likely counterfactual.
The second adjustment is one employed in Ahn & Hamilton (2019) and which I uncreatively dub “deNUing” here. If a record transitions from N to U in consecutive months (NU), but then reports an unemployment duration of greater than 5 weeks, I treat the prior month’s N as a U instead (UU). [3]
These adjustments flip the entry & exit story on its head, as illustrated in the graph above. Whereas the unadjusted month-to-month flows show virtually no rise in labor force entry since 2015, and substantial falls in labor force exit, the two adjustments suggest that in fact it’s labor force exit that’s been more or less flat for almost a decade while labor force entry has gradually risen for four years.
DeNUNed month-to-month entry contributed 43% of the participation rise since October 2015 and 55% since the deNUNed steady-state trough of October 2013. When the data is also deNUed, the entry contribution rises to 73% and 93% respectively. This is almost the mirror image of the decomposition under the Barnichon (2019) approach.
This is confirmed when we look at year-to-year transitions.
But just as economists should not draw strong conclusions solely from unadjusted month-to-month CPS flows, so too should they be reticent to rely only on adjusted flows, no matter how internally-consistent or transparent those adjustments are. After all, the adjustments here literally involve changing responses to the CPS.
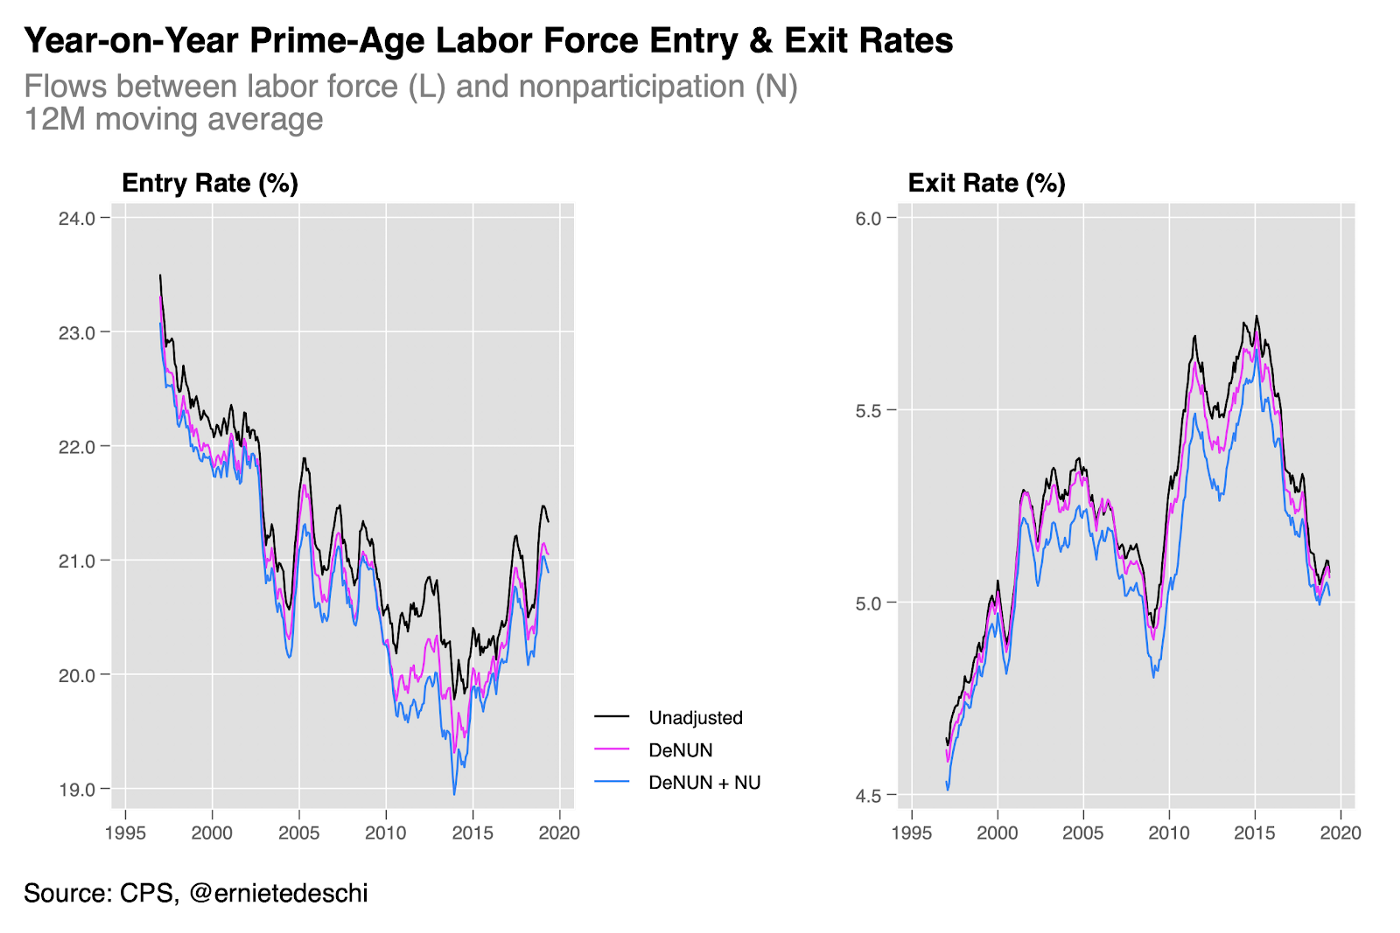
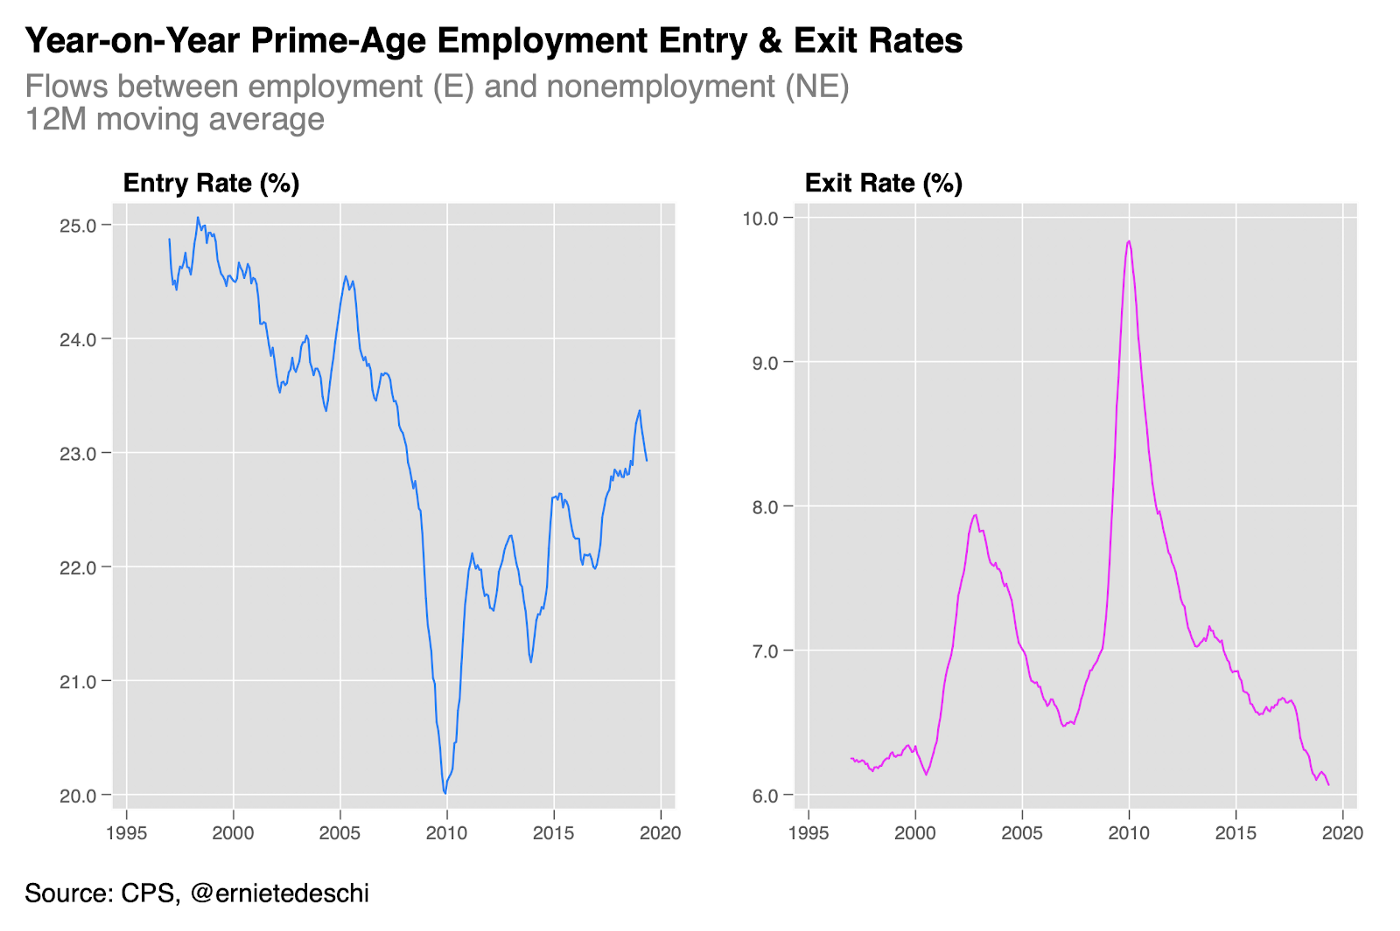
A useful cross-check for the month-to-month flow analysis is to look at year-on-year flows. If a concern with the CPS is that short-term labor status flows are subject to classification errors, then looking at the same flows 12 months apart may provide a more reliable signal of persistent status shifts. Year-on-year flows also have the advantage of being seasonally-aligned, since they compare the same month across two different years.
And in fact, the year-on-year flow data — even the raw unadjusted flows — are consistent with the story told by our deNUNed and deNUed month-to-month flows: the rise in prime-age participation has been driven by both higher labor force entry and lower labor force exit. The 12-month flow rates themselves differ in level terms between the unadjusted and adjusted series, but their relative behaviors are all consistent with one another and tell similar stories. The entry contributions for the year-on-year flows range from 33–36% since October 2015 and 38–45% since their July 2014 steady-state troughs.
The entry story is also confirmed when looking at employment flows instead…
Economists focus on labor force participation often because it is a proxy for how we think of labor supply — the population of workers who have or are pursuing a job in any given month.
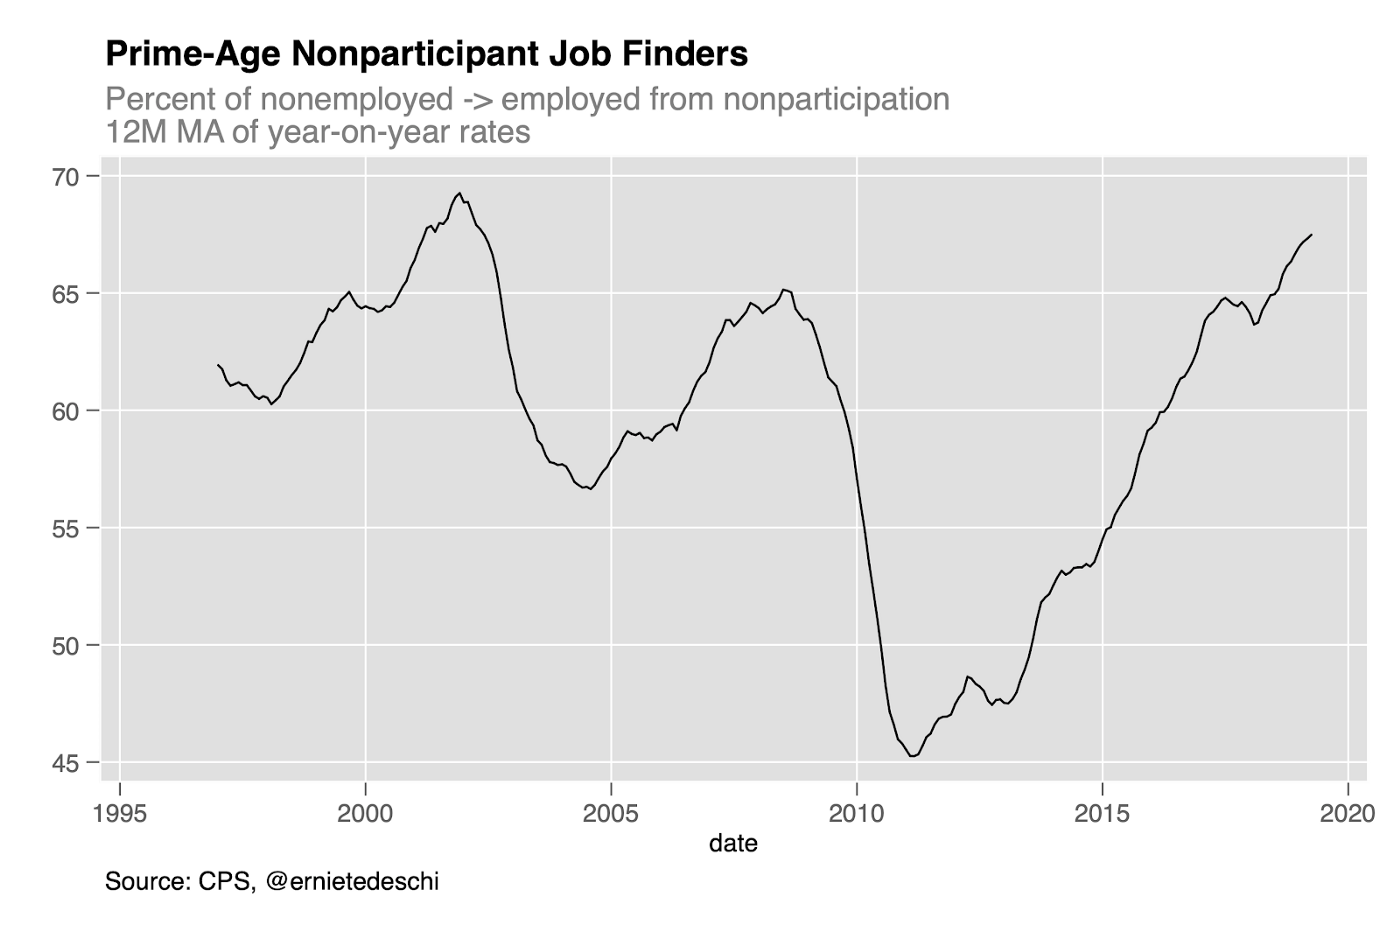
But the participant-versus-nonparticipant distinction isn’t always meaningful when it comes to job-finding. The unemployed are more likely to transition into employment over 12 months than nonparticipants are, but there is a great deal of heterogeneity among different types of nonparticipants. Some nonparticipants, for example, still say they want a job; these nonparticipants often have job-finding rates not dramatically different from the unemployed.
Moreover, more than two-thirds of the prime-age workers hired out of nonemployment were nonparticipants rather than unemployed, and in fact most of these hired nonparticipants had previously said they didn’t want a job.
An additional robustness check then might look at a narrower, more conservative definition of labor supply. In that vein, I look at employmentflows rather than labor force flows.
Economists generally think of employment as a labor demand rather than supply measure, since there are always nonemployed Americans transitioning between jobs or ready and willing to take a job should one arise, margins that in principle a labor supply metric would account for.
But the point here is not to hold up employment as a superior labor supply measure. Rather it’s simply to find a measure that can bookend a sensitivity analysis on the narrow side. For this purpose, using employment is straightforward and comprehensible.
The results further support the conclusion from the adjusted month-to-month flows and the year-on-year flows: the rise in prime-age employment is a function of both job finding and a fall in job exit, though with employment the trough in entry was pre-2015. Month-to-month employment entry contributed 60% of the prime-age employment rise since October 2015 and 36% since the steady-state employment trough in December 2009. Year-on-year results are 21% and 23% respectively.
…as well as with a broader labor force measure…
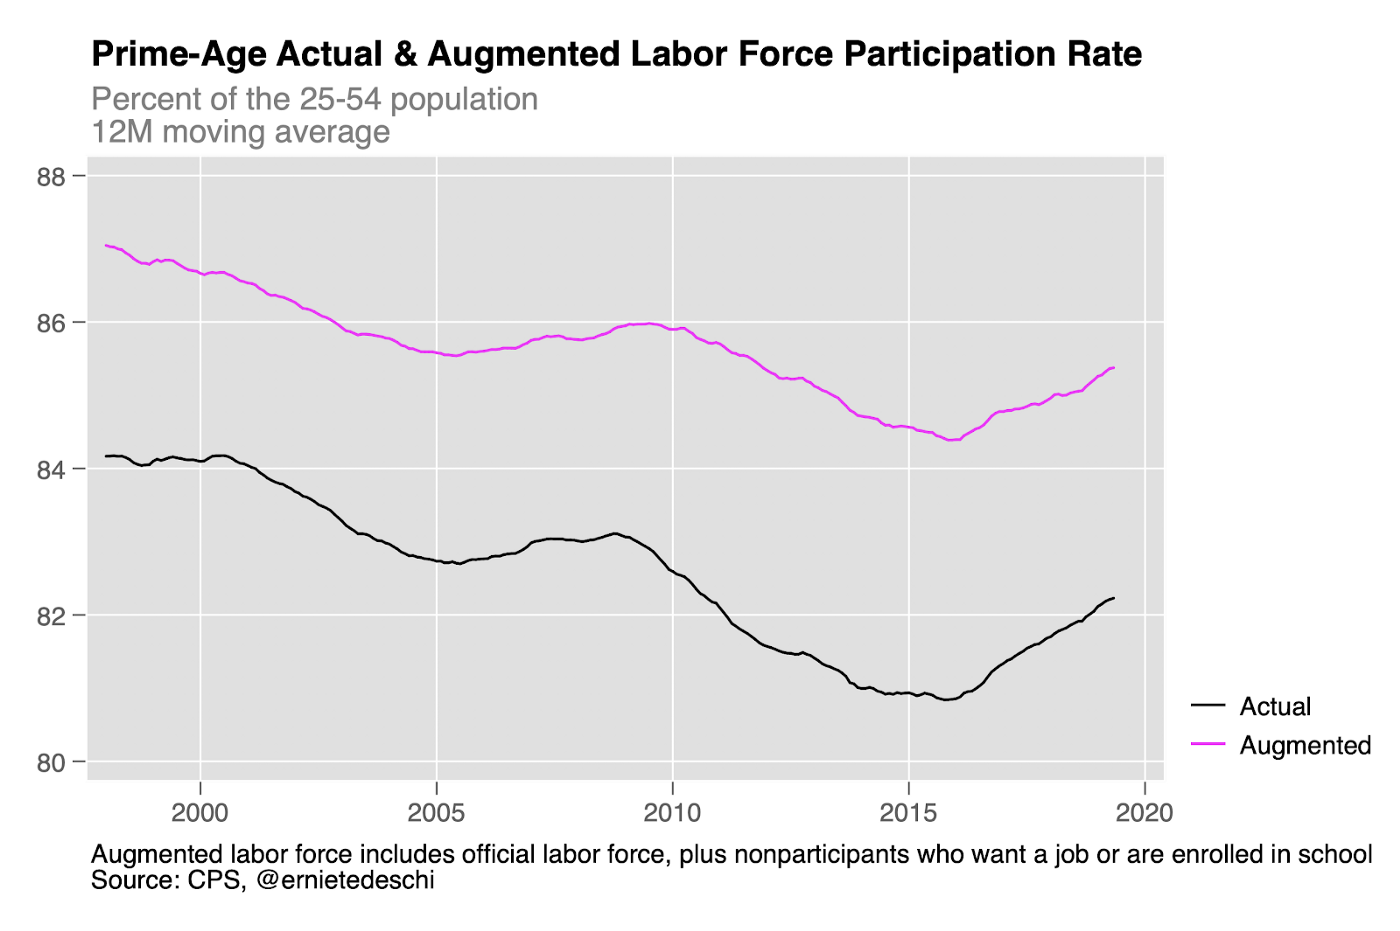
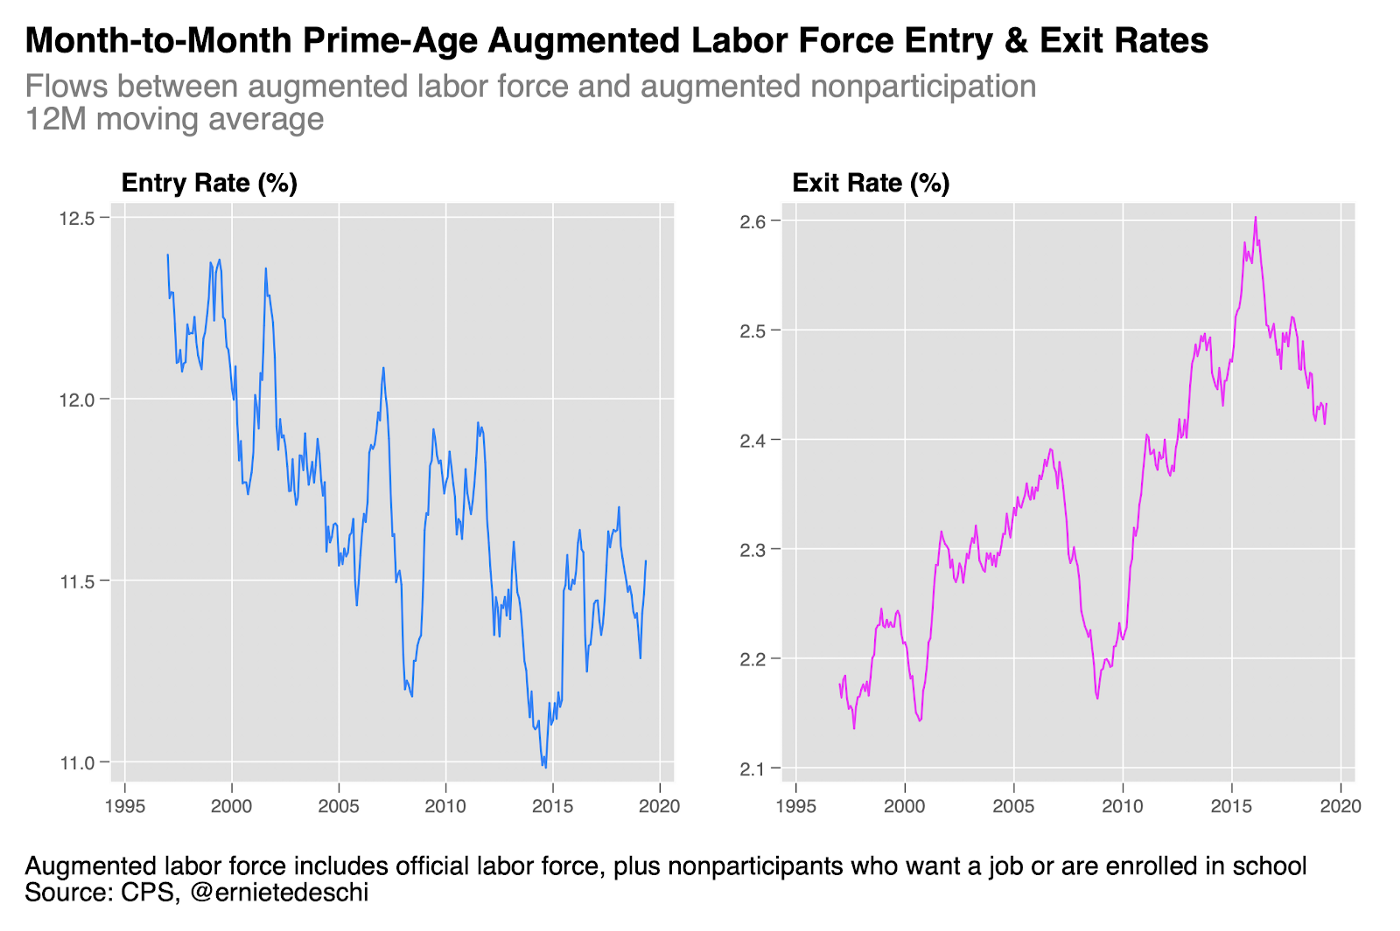
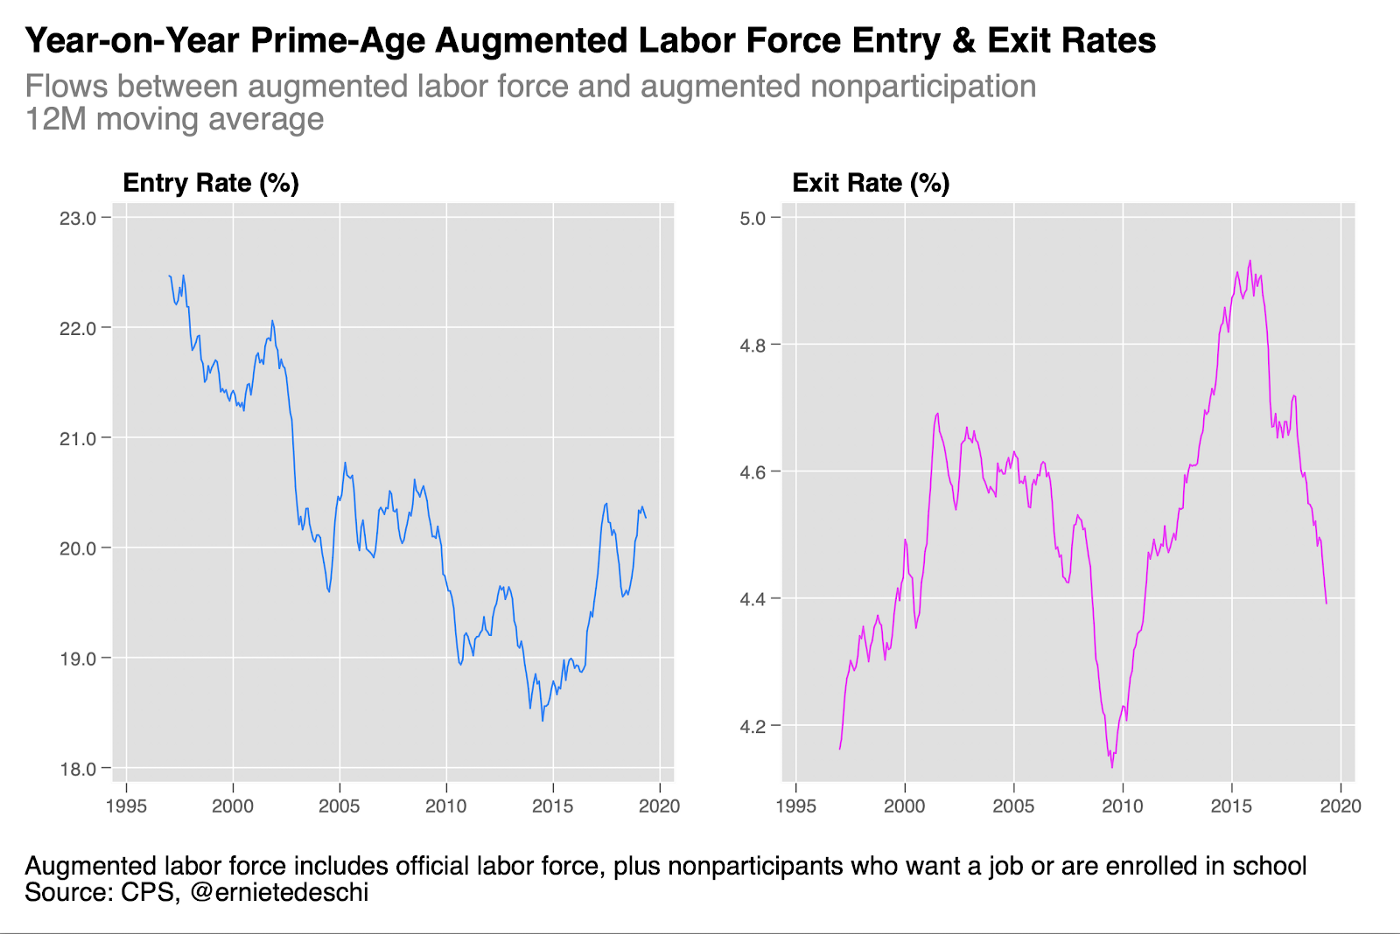
Another cross-check, which bounds the other side of the analysis, uses a broader measure of labor supply than the official labor force. To try to keep the analysis here similarly straightforward to the one using employment, I define an “augmented prime-age labor force” equal to the official labor force plus prime-age Americans who are nonparticipants but say they want a job, as well as prime-age Americans who say they are out of the labor force due to school enrollment (based on the logic that Americans investing in more education probably intend to reenter the labor force at some point). This alternative definition is about 5 percentage points higher in level terms than the official prime-age labor force participation rate in 2019, a gap that has grown over time.
On a month-to-month basis, augmented labor force entry is up somewhat from its trough in late 2014; exit is down from its peak occurring around a year later. The dynamics are similar year-on-year, but the entry rise and exit fall are sharper and clearer. In both cases the flows show a nonzero contribution by labor force entry. Augmented month-to-month labor force entry contributed 11% of the rise since October 2015 and 46% since the steady-state augmented labor force trough in June 2015. Year-on-year entry was responsible for 37% and 43% respectively.
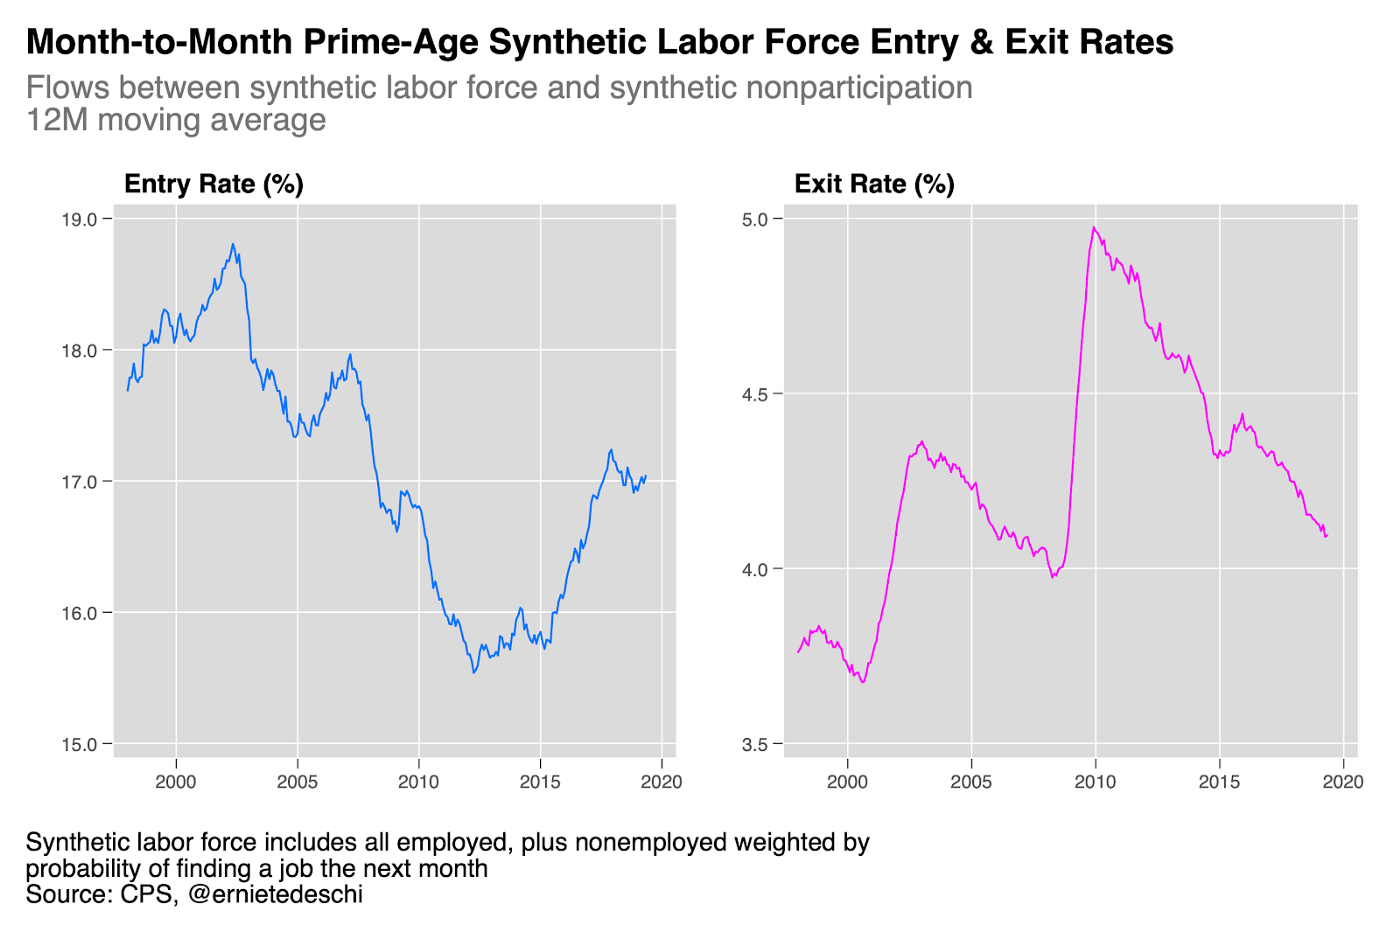
...and also, finally, with a synthetic labor force measure.
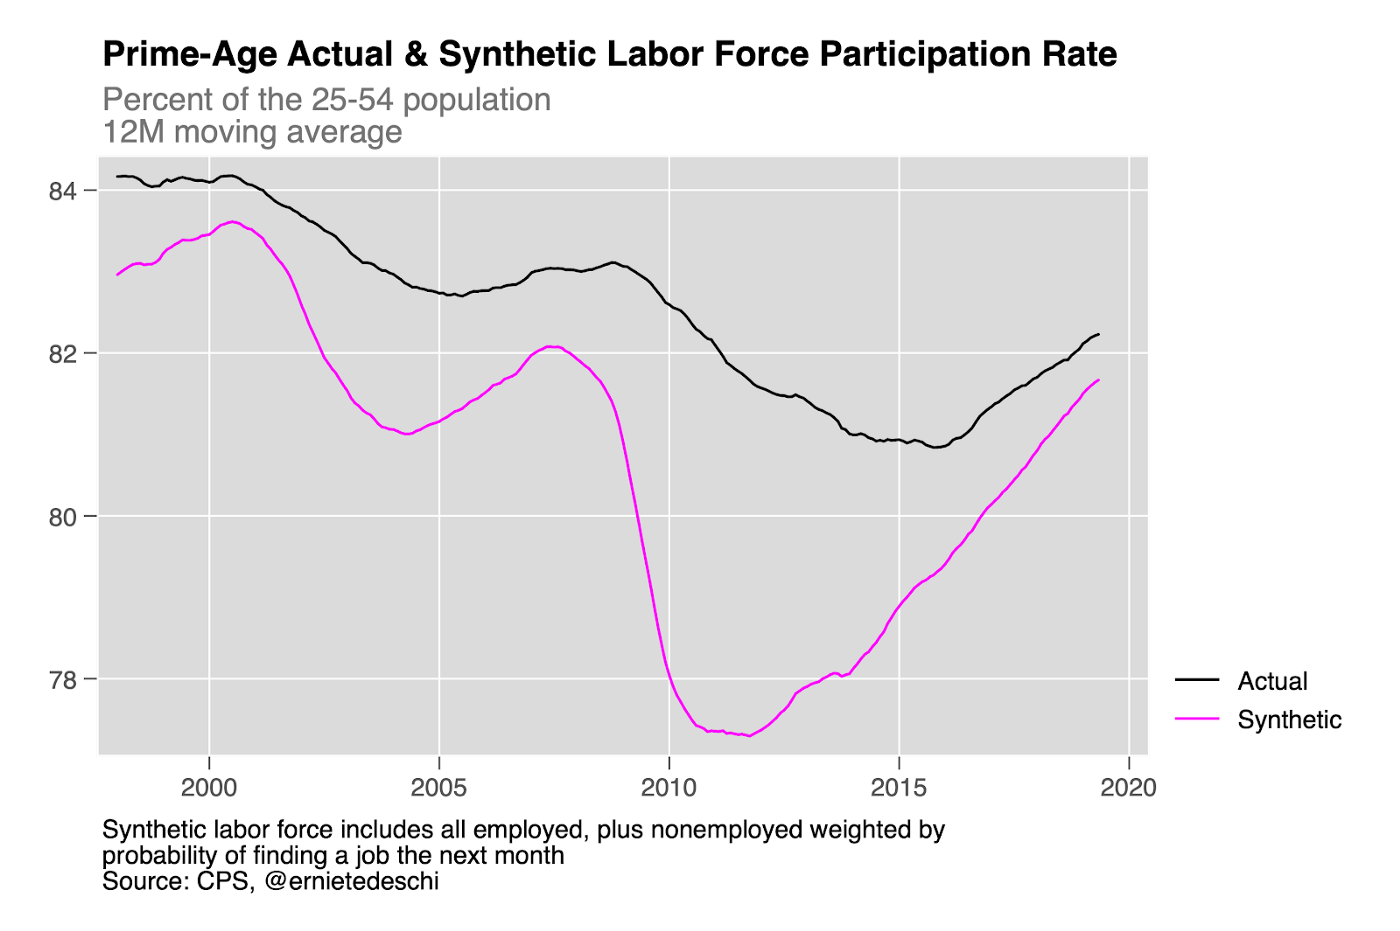
As a final robustness test, I construct a synthetic labor supply metric. All workers with a job are included 1:1, but I weight those without a job, whether unemployed or nonparticipants, based on the real-time probability that they will find jobs the next month. I use a rolling centered three-year probit model. The model predicts the probability of one-month job finding based on sex, age, parenthood, marriage status, race, nativity, education, size of metro area, and reason for nonemployment (short- or long-term unemployment, discouragement, retirement, enrollment, disability/illness, home/family care, or other). To calculate flows, I randomly assign the nonemployed CPS records to synthetic labor force status based on these binomial probabilities.
In one sense, my synthetic measure is broader than the official labor force in that every margin of nonemployment is given at least some weight, including nonparticipants. But in practice because my synthetic measure no longer weights the unemployed at 100% but at a (usually much) smaller weight, its level is lower than the official prime-age labor force, and so ought not be thought of as a broader labor force measure. It is however more cyclical than the official labor force: the rise since 2015 has been twice that of headline labor force participation.
Synthetic entry and exit qualitatively behave much like employment flows, which is not surprising given that the non-employed are weighted based on job-finding and the underlying model is re-estimated across time. Exit peaked around 2010 and has been steadily falling since then; entry flatlined and then began rising again in 2014. Since October 2015, synthetic entry contributed 44% of this rise; since the synthetic steady-state trough in July 2011, the entry contribution has been 30%.
Conclusions: Putting it All Together
Analyzing the contribution of exit and entry on labor supply changes depends crucially on three dimensions — the frequency of the flows, the adjustments made for consistency and survey error, and the very definition of “labor supply” itself.
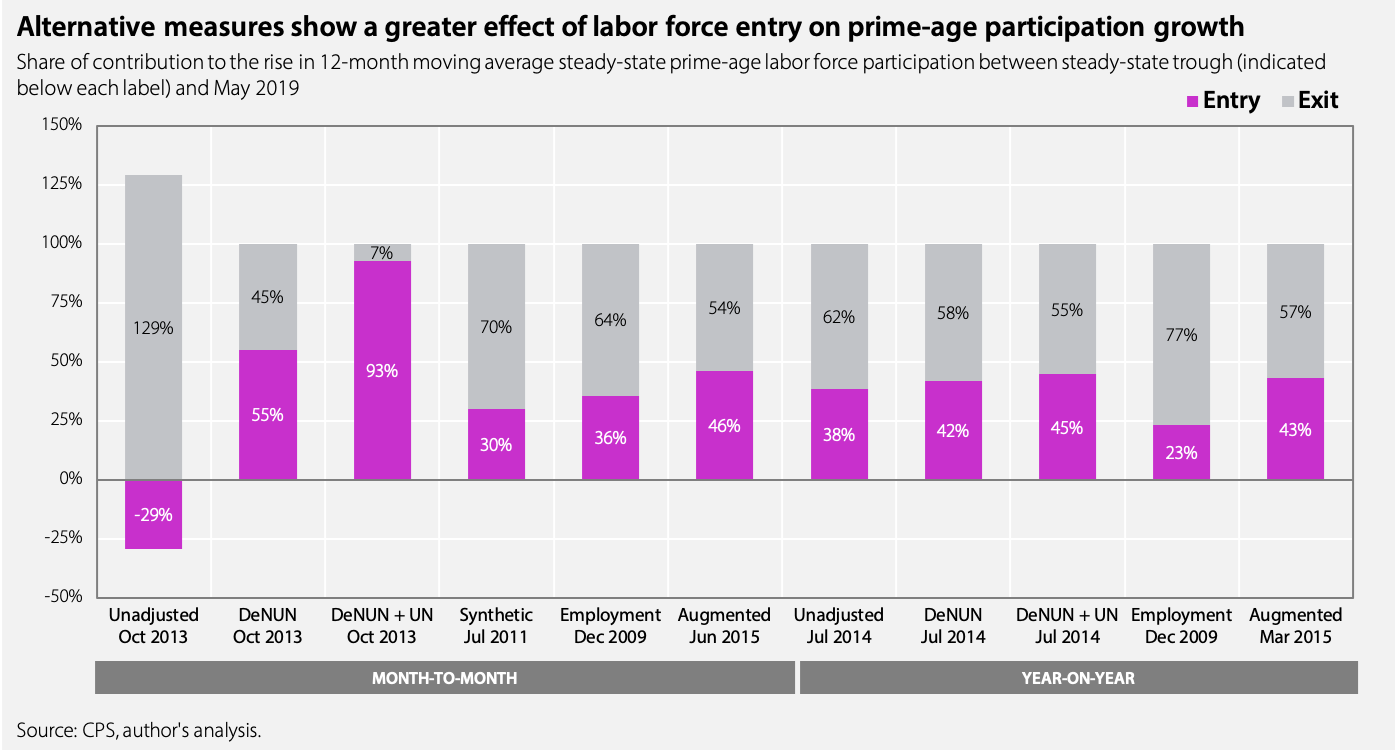
The chart below decomposes the change in prime-age participation implied by different metrics. In this particular figure, the starting point is always October 2015 (when the 12M moving average of the prime-age participation rate troughed) and runs through May 2019.
The unadjusted month-to-month CPS flows used in Barnichon (2019) suggest that all of the prime-age participation rise — actually, more than all since unadjusted month-to-month labor force entry falls somewhat between October 2015 and May 2019 — was due to falls in labor force exit.
A sensitivity analysis that compares the unadjusted month-to-month flows with alternative labor force status flows that correct for possible errors or inconsistencies shows that labor force entry consistently played a role too. These corrections yield results that are qualitatively in line with unadjusted year-on-year flows, as well as flows into and out of a probability-weighted synthetic labor supply measure.
Quantitatively, labor force entry contributes between 11% and 73% of the rise in prime-age labor force participation since October 2015 under the ten alternatives I analyzed, with a median across all the metrics of 36%.
Moreover, because these flow measures are different from one another, their steady-state troughs each occur at different dates other than October 2015. If I measure entry and exit contributions beginning at each metric’s steady-state trough rather than the same October 2015 start point, the range of alternative entry contributions rises to 23% — 93%, with the median rising to 42%.
In other words, when looking at a robust array of measures, prime-age labor force entry rose during the recovery. Based on the range of results a reasonable conclusion is that labor force entry has contributed between ⅓ and ½ of the rise in prime-age labor force participation during the recovery.
Flows alone provide no conclusive evidence on potential participation, but for most of these alternative measures, entry is rising but still below pre-crisis peaks, and exit is falling but still above pre-crisis troughs. Both of these behaviors suggest prime-age participation has further to rise in the absence of exogenous shocks.
End Notes
[1] My data here are 12-month moving averages whereas Barnichon (2019) shows calendar year averages; the two series nevertheless appear to be consistent with one another. I weight my flow metrics using a constructed weight that constrains the sum of longitudinally-linked monthly records to be equal to the total population along sex, 5-year age group, and labor force status interactions. Later on in this analysis when I look at year-on-year flows, I use a similarly-constructed weight but limited to records longitudinally-linked across 12 months.
[2] The CPS surveys the same household a total of eight months. The first four months are consecutive. Then the household is off the survey for eight months. And finally the household returns to the CPS for another four consecutive months. All told, sixteen months elapse between a households first and last months in the CPS.
[3] Ahn and Hamilton set the cutoff at >4 weeks of reported duration rather than >5; I choose 5 instead of 4 to conservatively avoid false error-identification in case of seasonal timing variations, since a typical month is greater than 4 weeks long.
The link has been copied!
Your link has expired. Please request a new one.
Your link has expired. Please request a new one.
Your link has expired. Please request a new one.
Great! You've successfully signed up.
Great! You've successfully signed up.
Welcome back! You've successfully signed in.
Success! You now have access to additional content.