All in all, still a soft report. Methodological quirks explain some of the weakness but they only go so far. The Fed won't see this as a reason to cut imminently, but they'll be on guard.
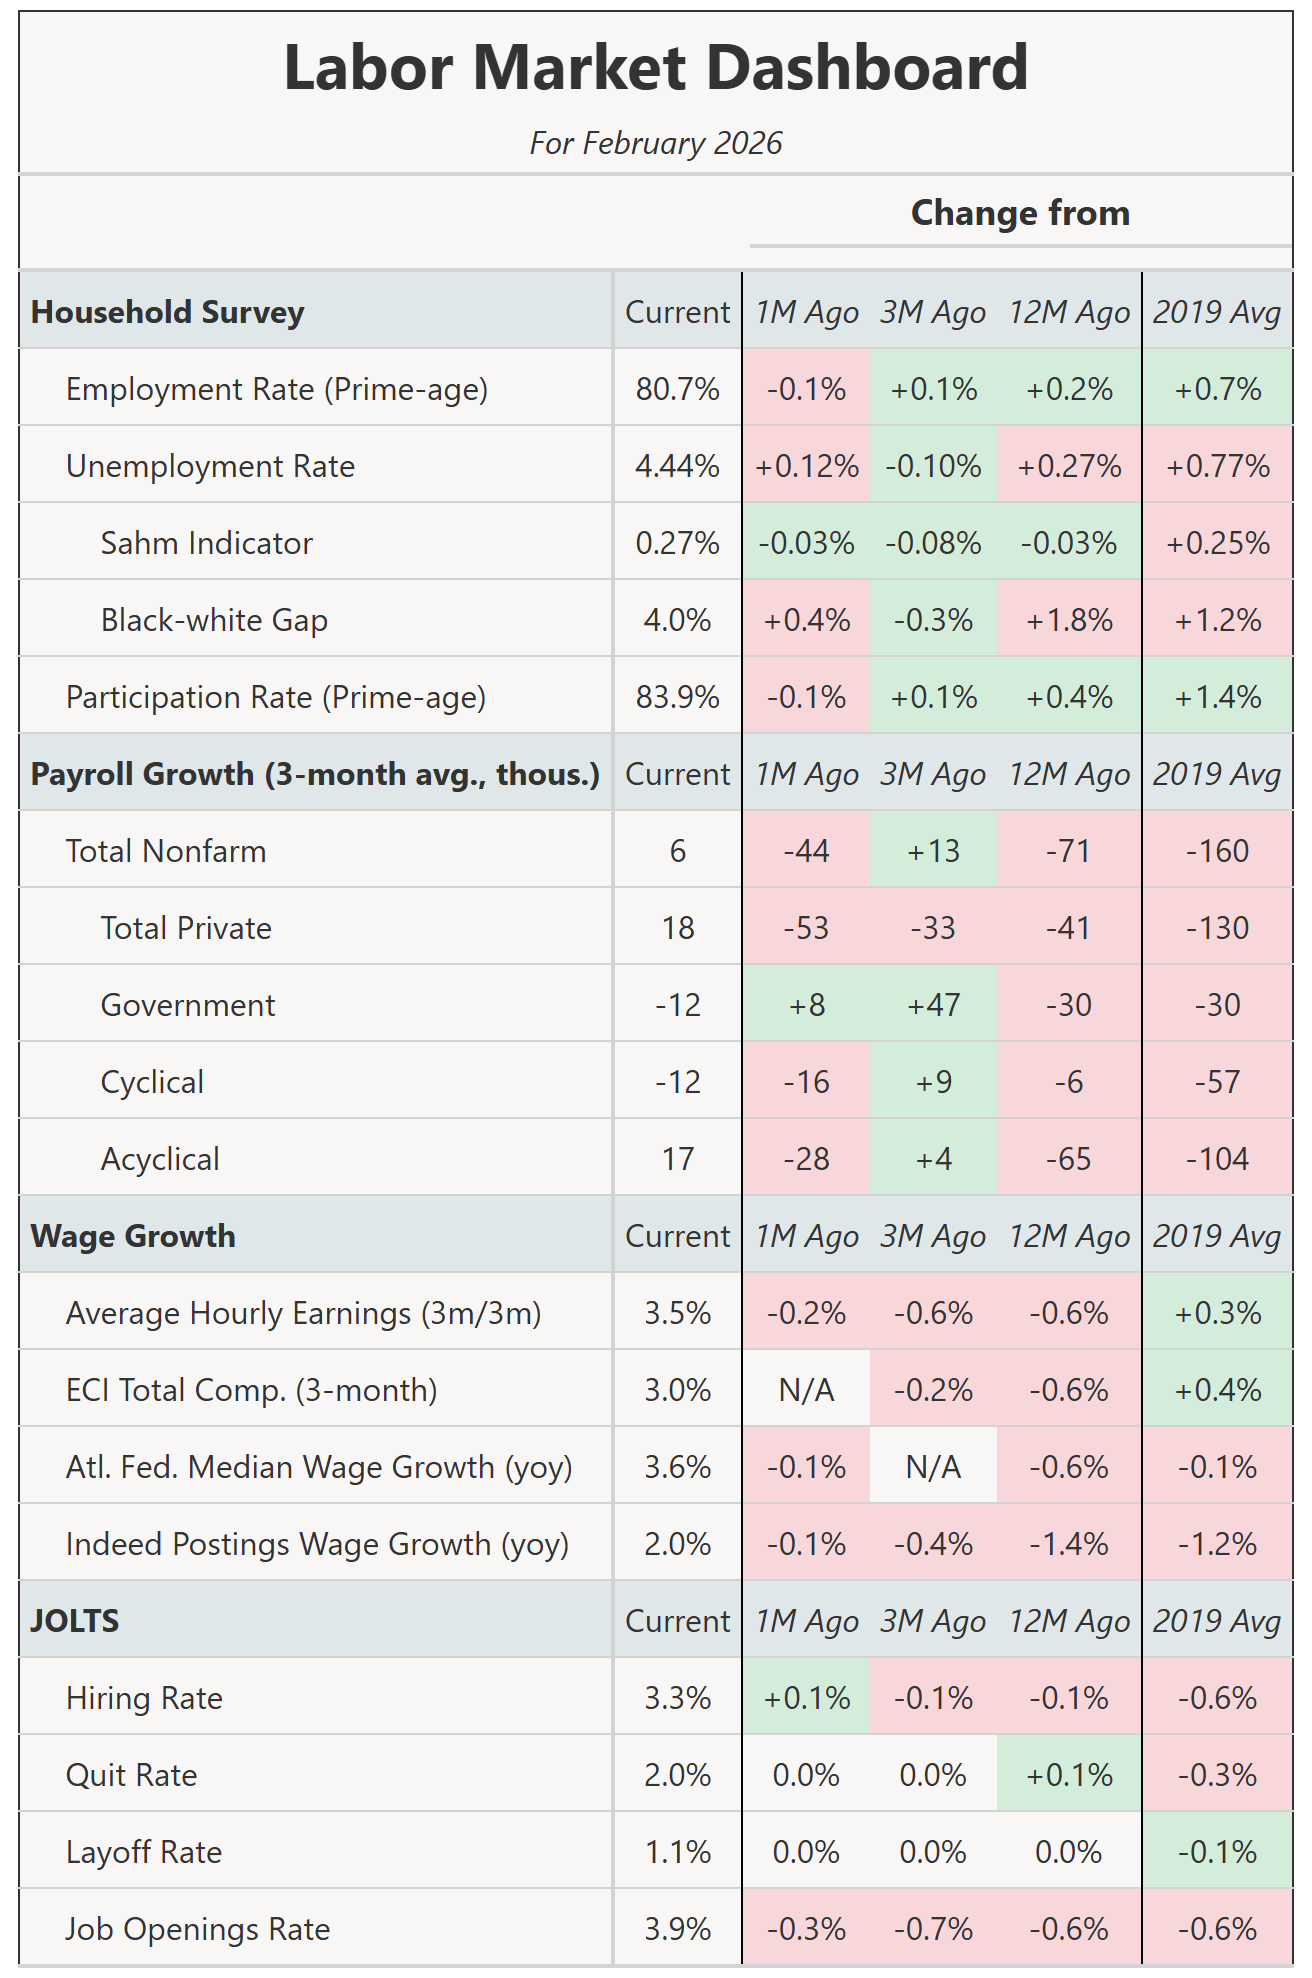
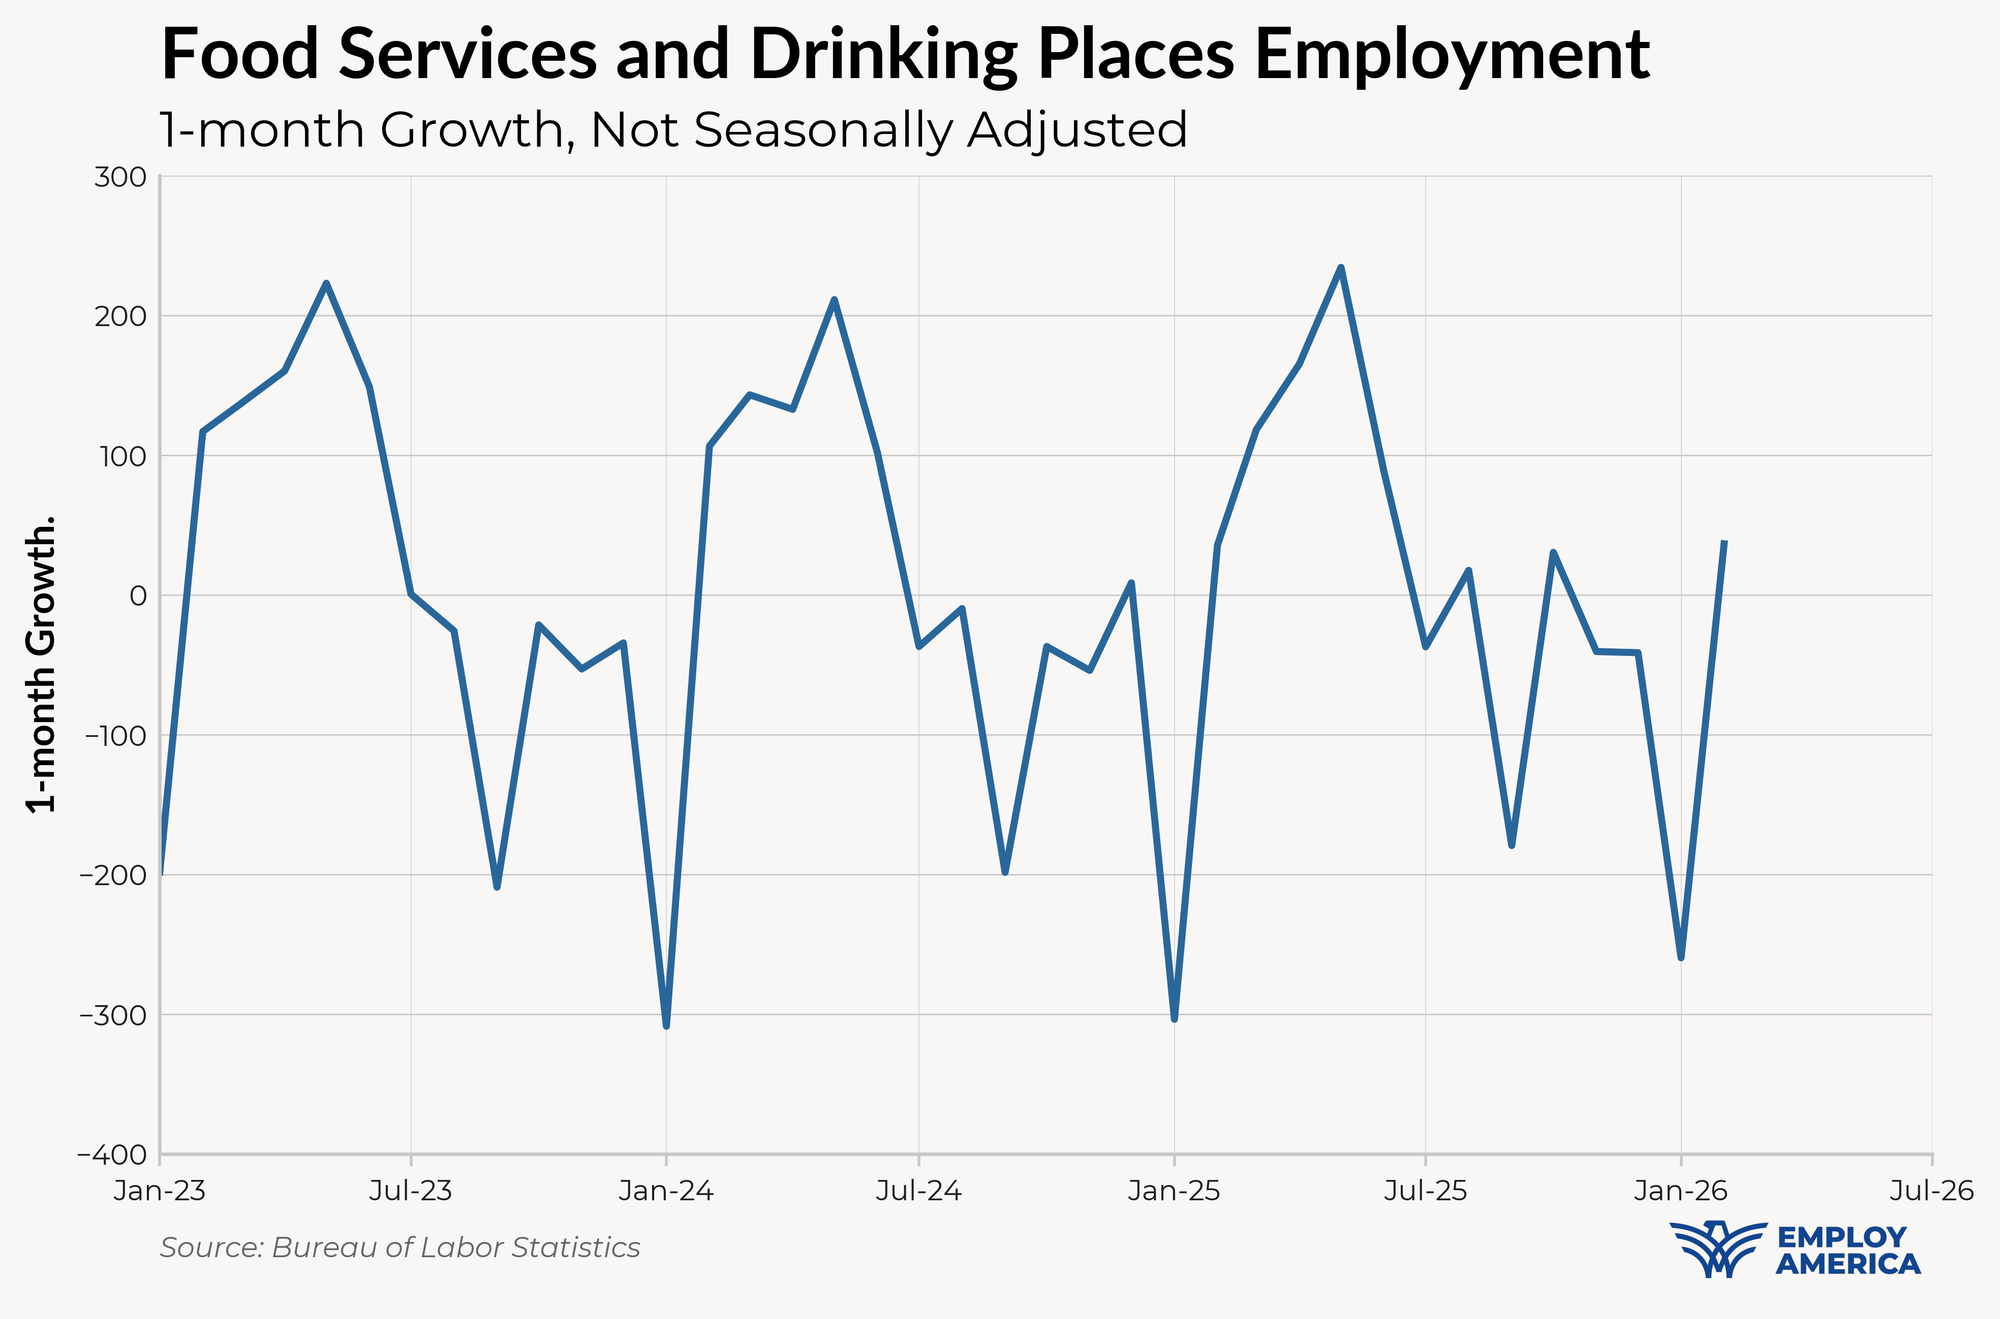
February's jobs day numbers were ugly, with the establishment survey showing a -92k fall in jobs and revisions of -69k to December and January. On the surface this was a bad report, but there were significant methodology changes to the birth-death survey that suggest that the swing between January's huge gain in jobs and February's loss are spurious. Contributing this swing were likely weather-related phenomenon (a relatively warm January and a relatively cold February) that affected sectors like construction and food services.
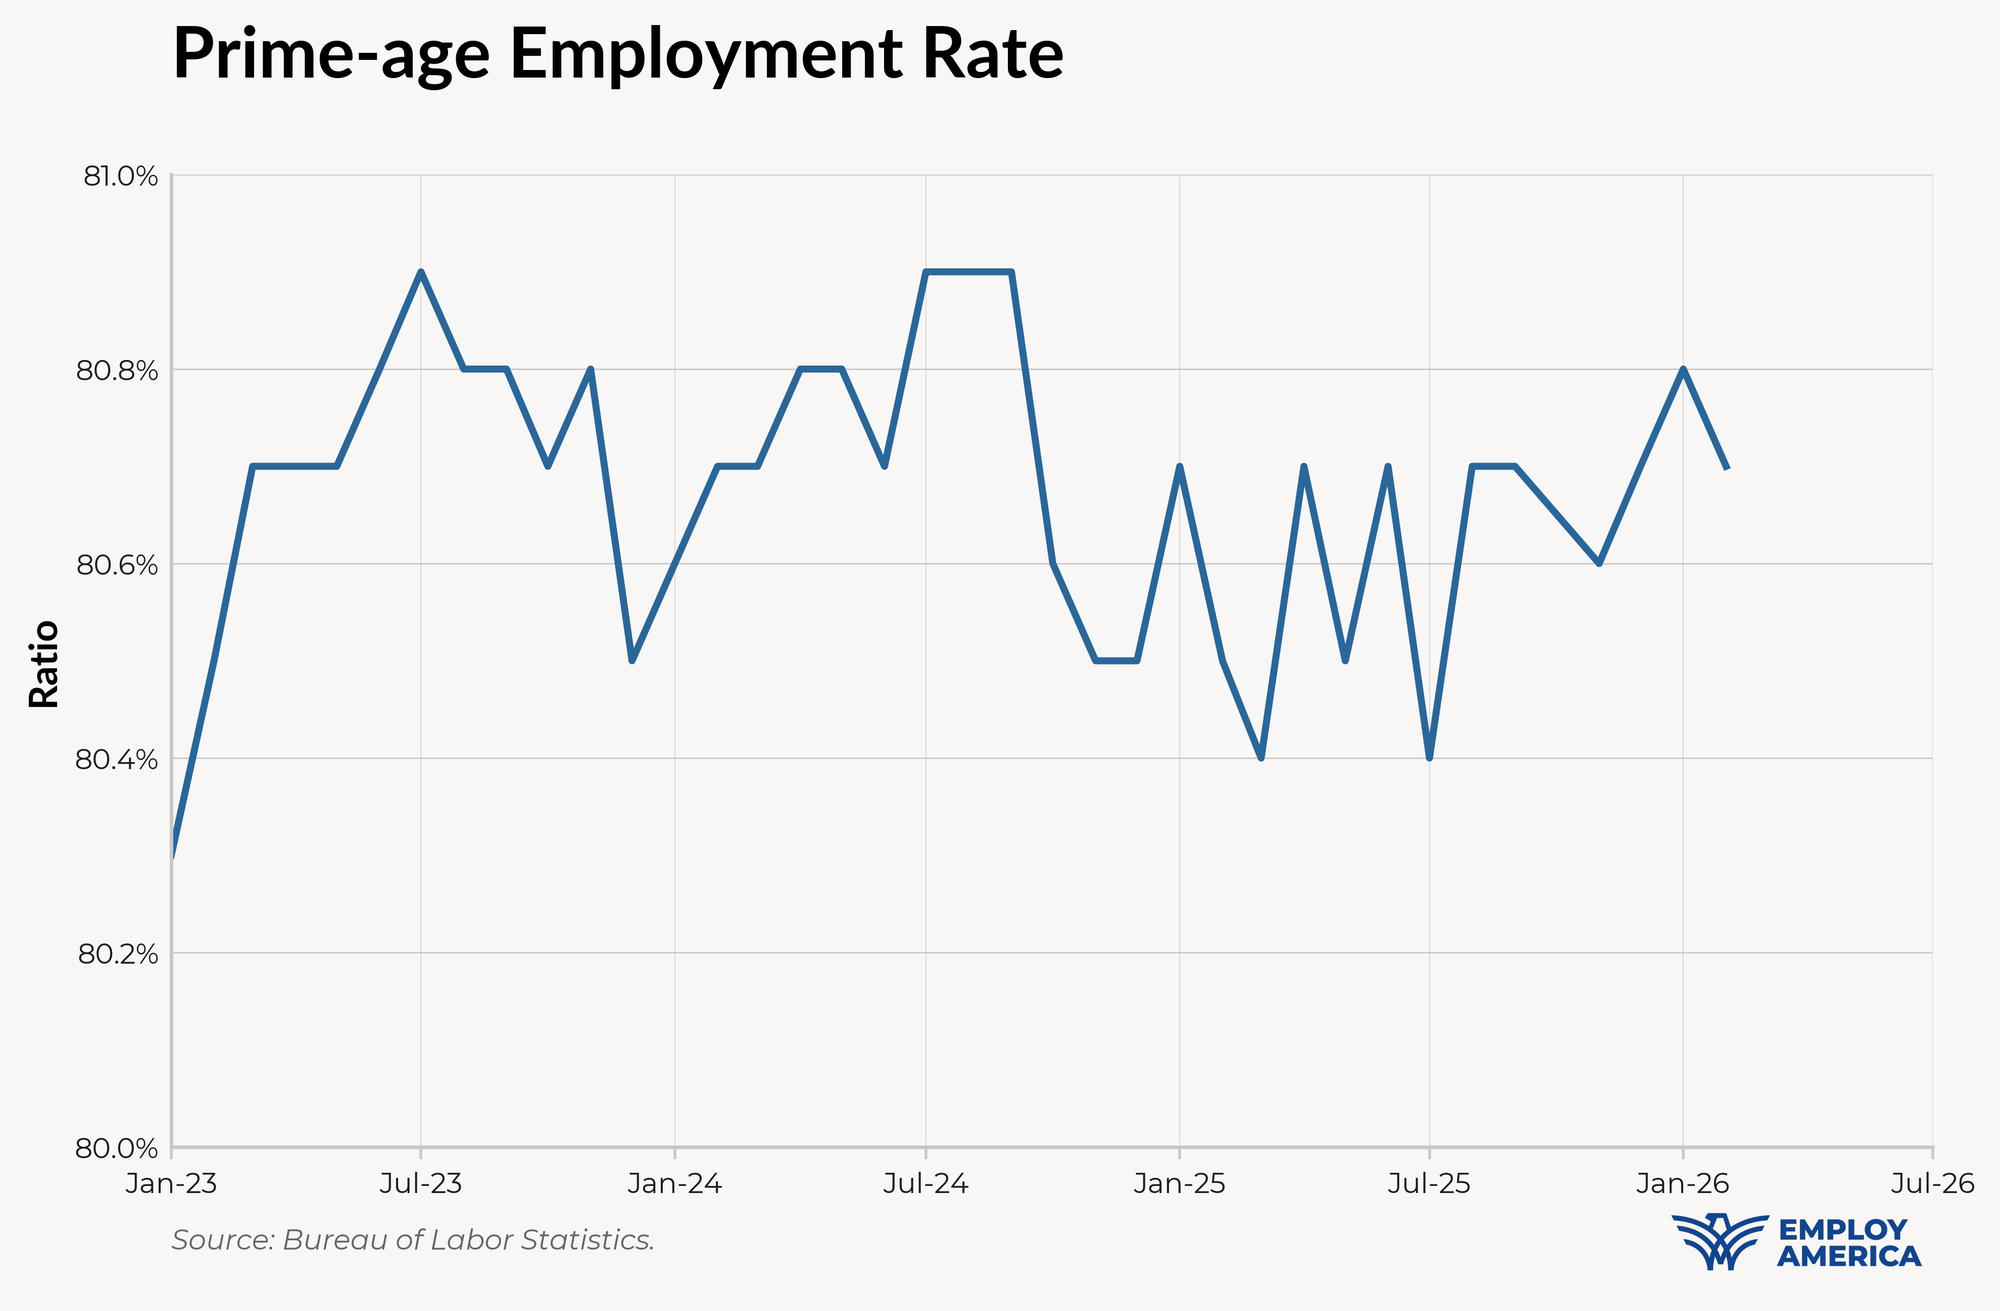
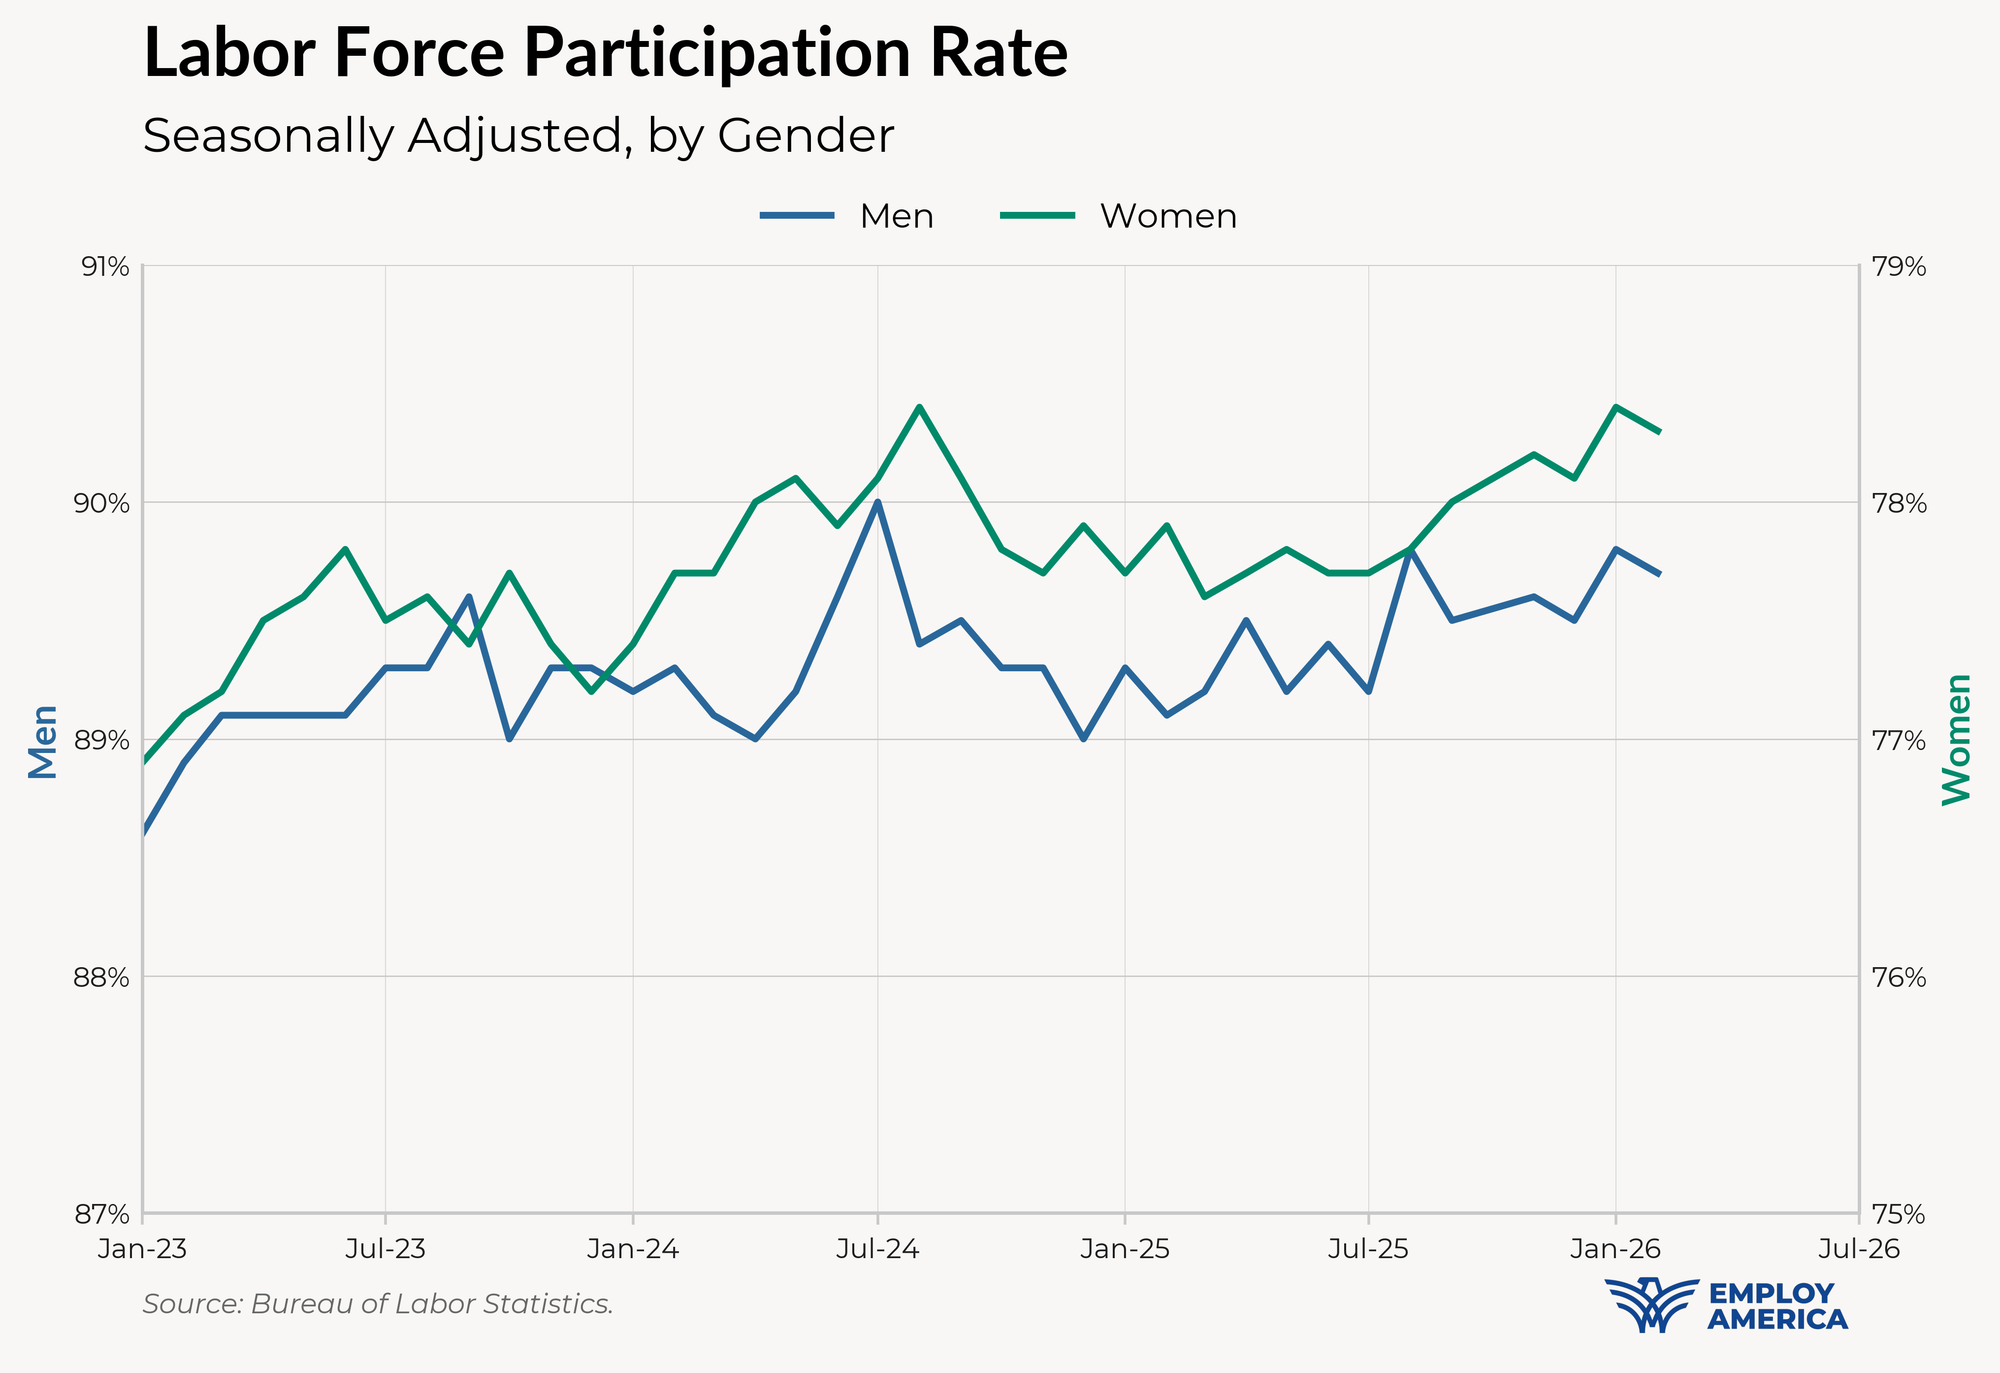
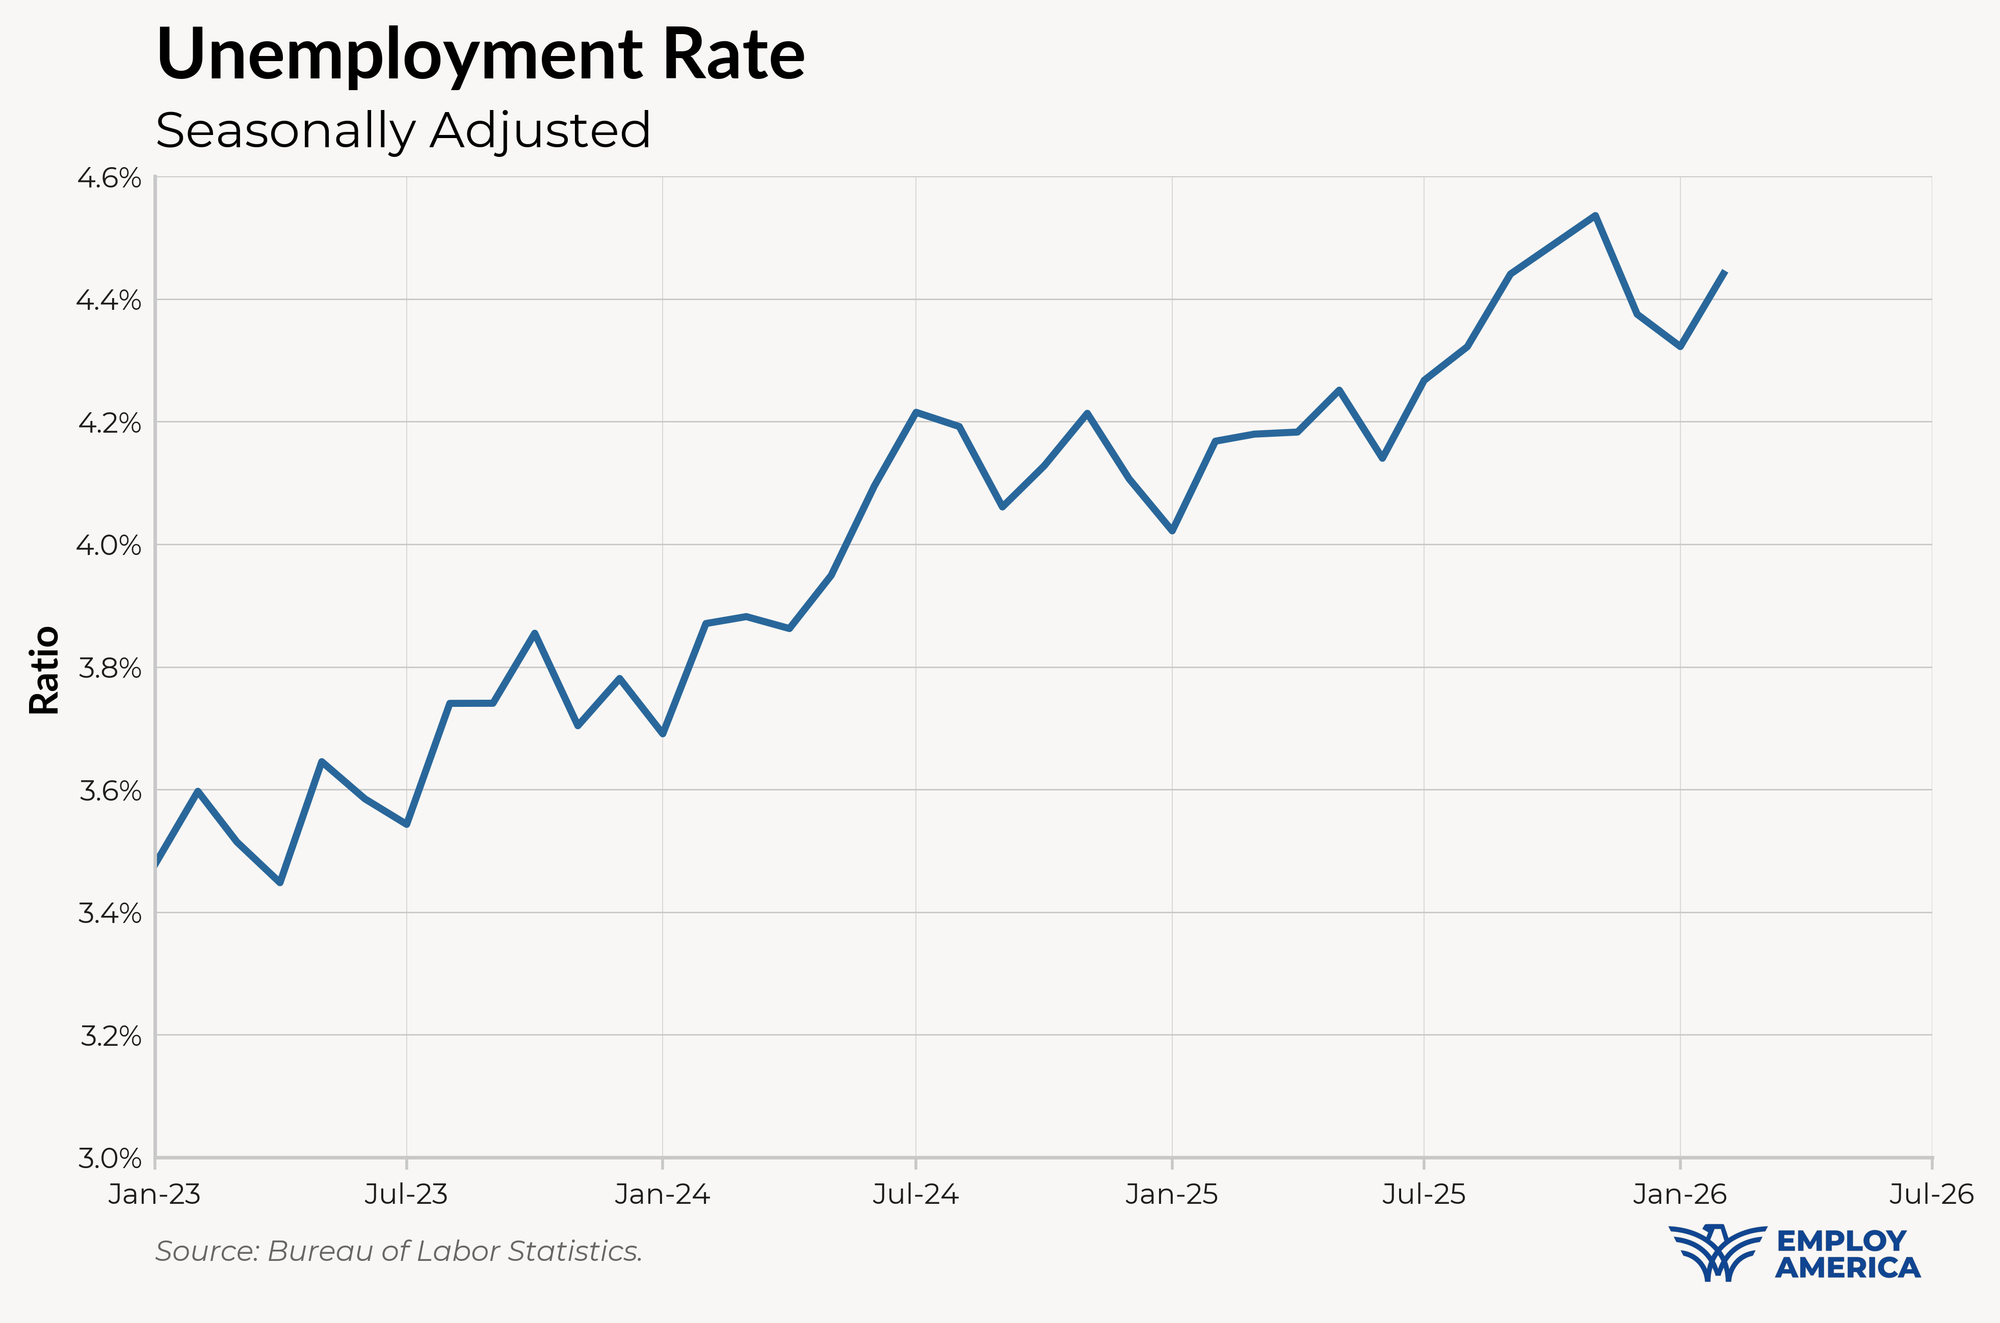
On the other hand, the household survey was relatively quiet. There was some moderate softening: prime-age employment fell 0.1pp, unemployment rose 12 bp to 4.44%, and participation fell slightly. But the household survey is also not immune from methodology changes: the BLS introduced new population figures that put lower weight on the White population and prime-aged men. This may explain some of the softness (lower participation and employment rates) but the effect on the unemployment rate was likely minimal.
All in all, still a soft report. Methodological quirks explain some of the weakness but they only go so far. The Fed won't see this as a reason to cut imminently, but they'll be on guard.
A bad payrolls print
The -92k payroll print is ugly, but there's likely some methodological issues and one-off events that affecting the numbers.
The new birth-death model adjusted jobs by -61k and +90k in January and February 2026, respectively. Those adjustments are far more favorable to January and far less favorable to February than in previous years. There were 52k fewer job losses in January 2026 from birth-death relative to the average of Jan '25 and '24, and 53.5k fewer job gains in February 2026 relative to the average of Feb '25 and '24.
Birth-death adjustments to Nonfarm Payrolls (NSA)
Year
January
February
2026
-61k
+90k
2025
-105k
+136k
2024
-121k
+151k
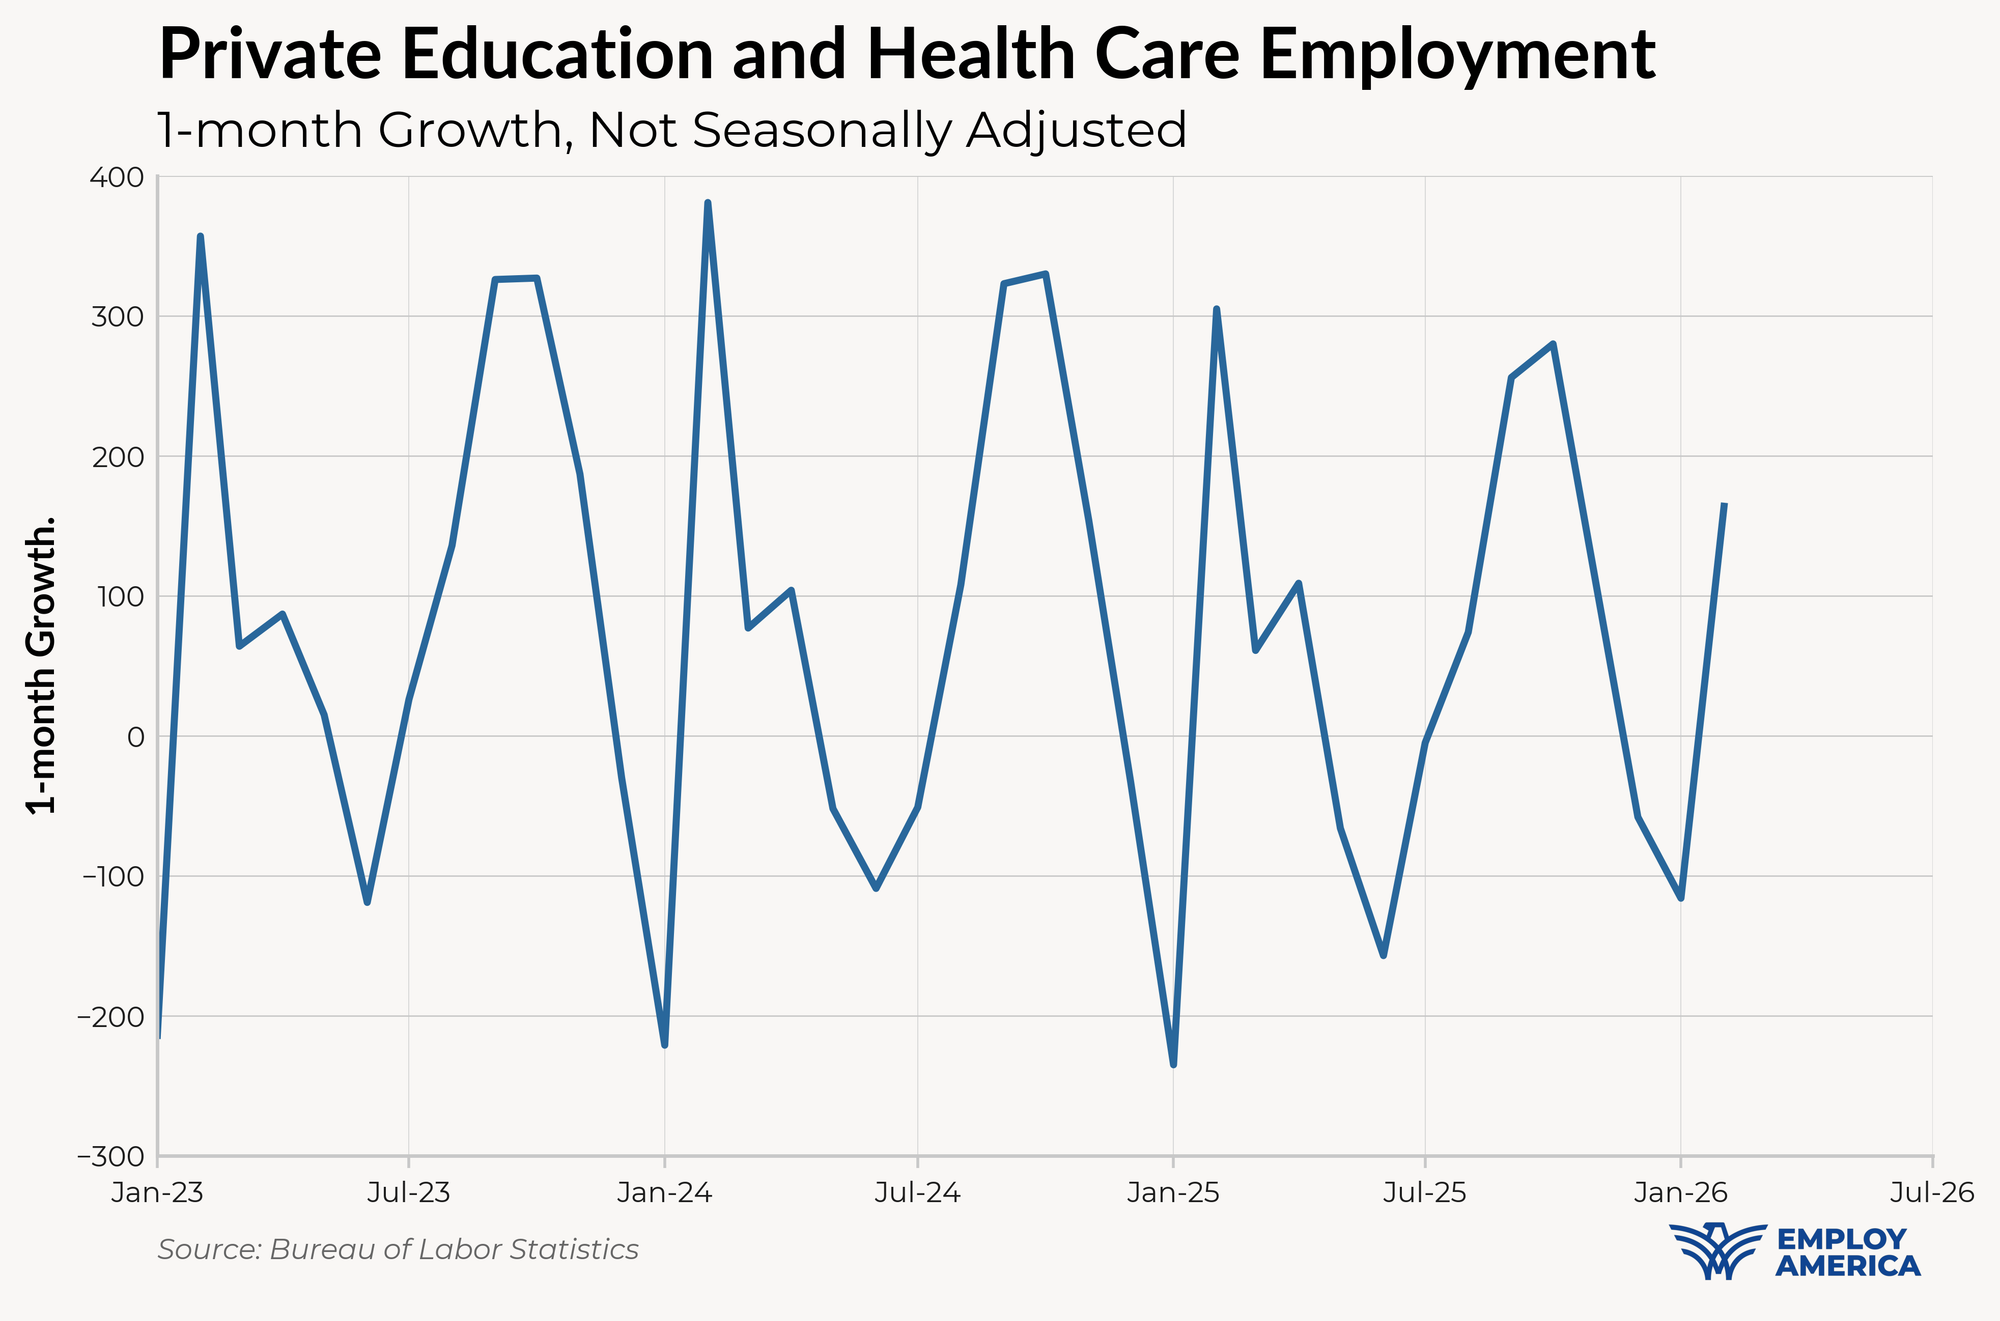
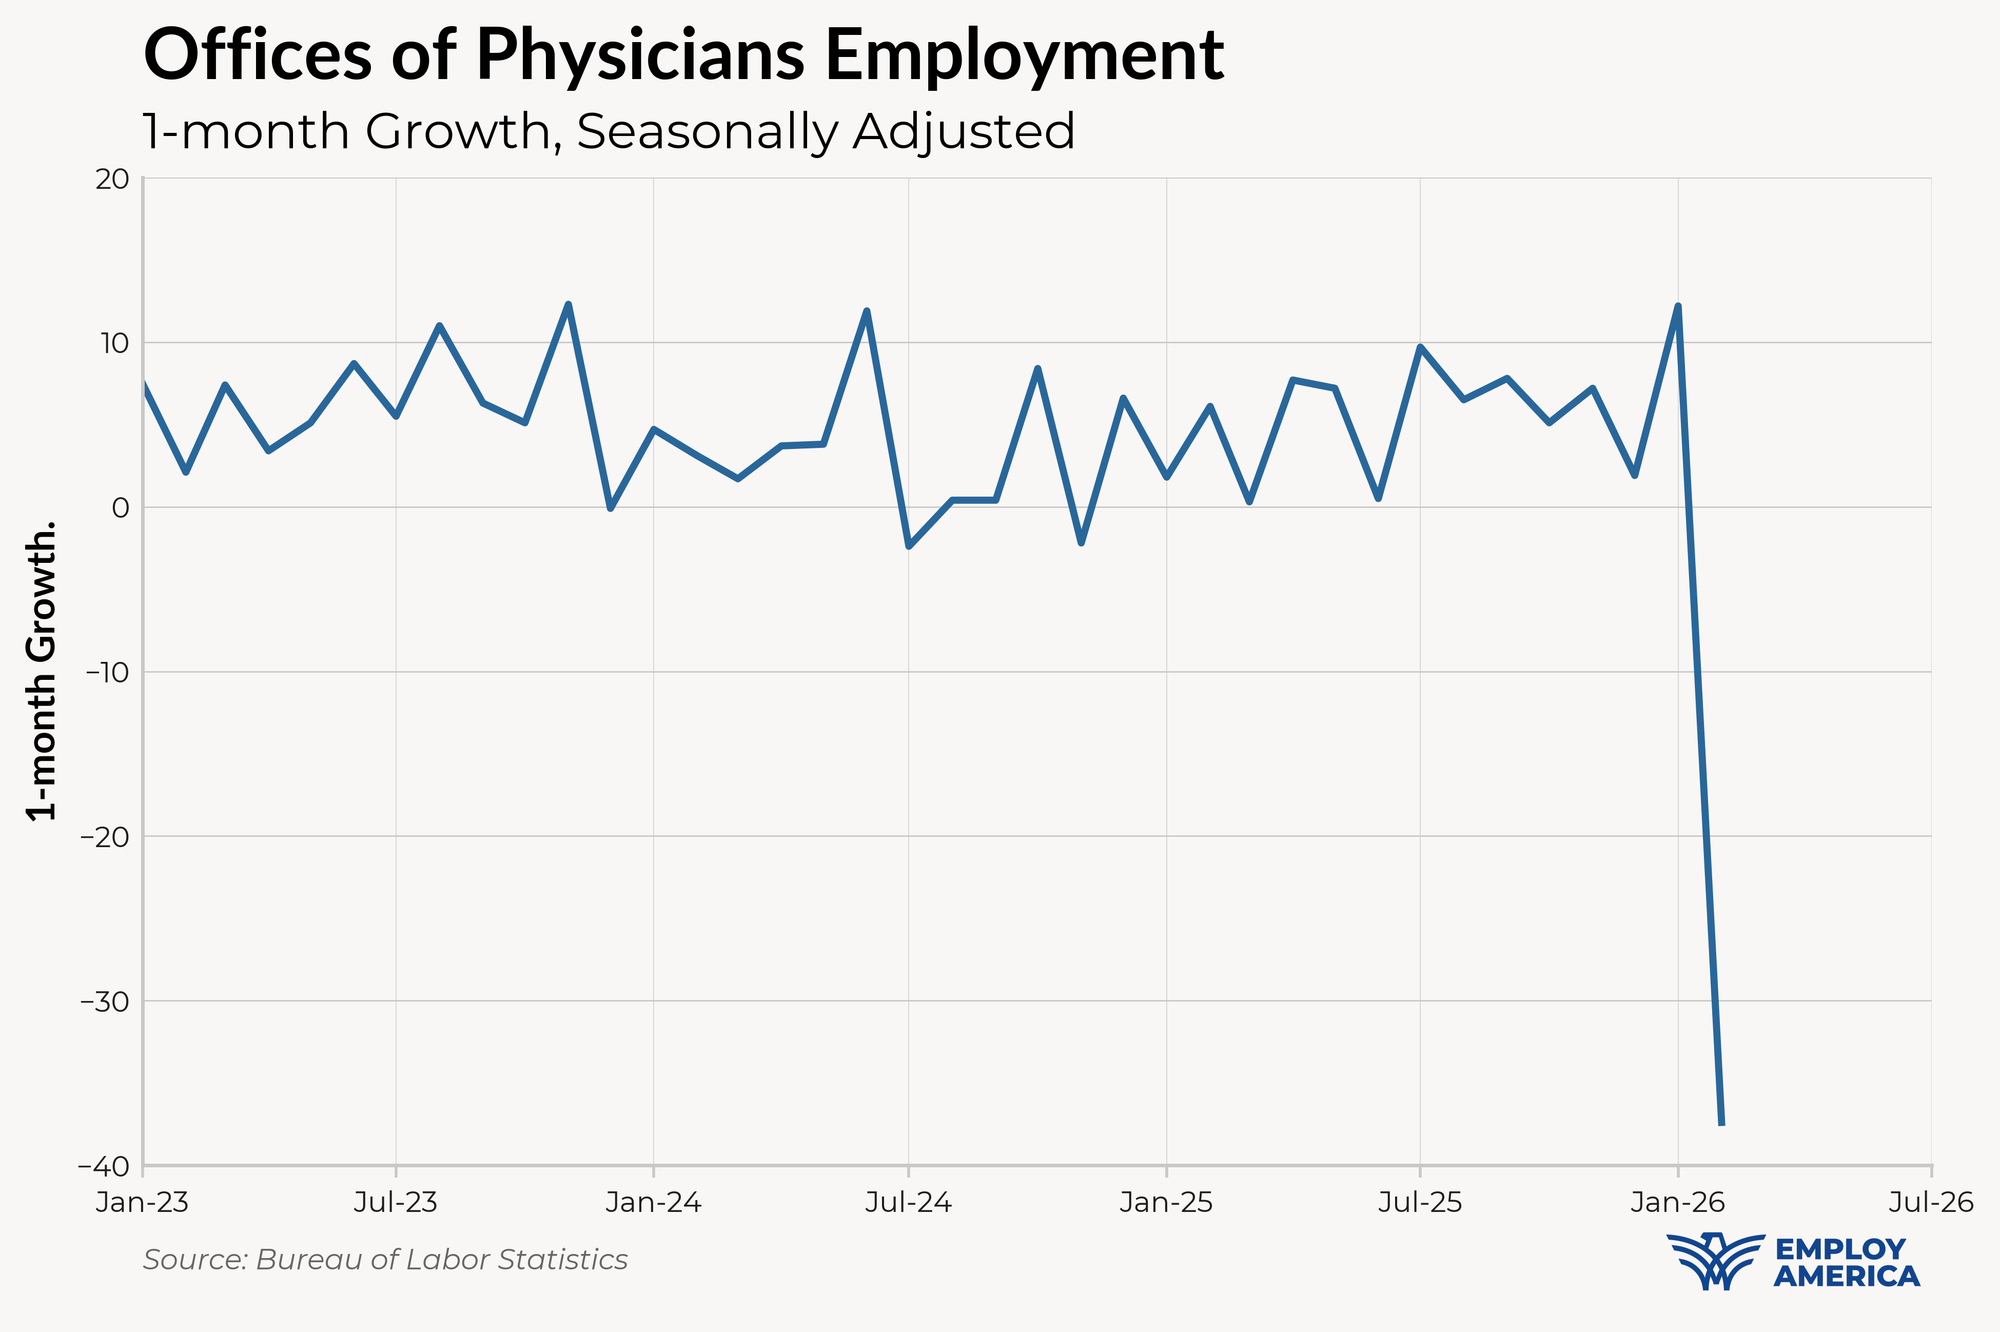
The effect of the new birth-death model is most apparent in private education and healthcare, which saw a seasonally-adjusted gain and losses of +129k in January and -34k in February (in the current release). If we look into the non-seasonally-adjusted data, both the job losses in January and the snapback in February were relatively small compared to previous years.
Also contributing to the February weakness in healthcare was a Kaiser strike involving 33,000 employees in California and Hawaii. This strike recently ended, and we'd expect a payback in health employment in March.
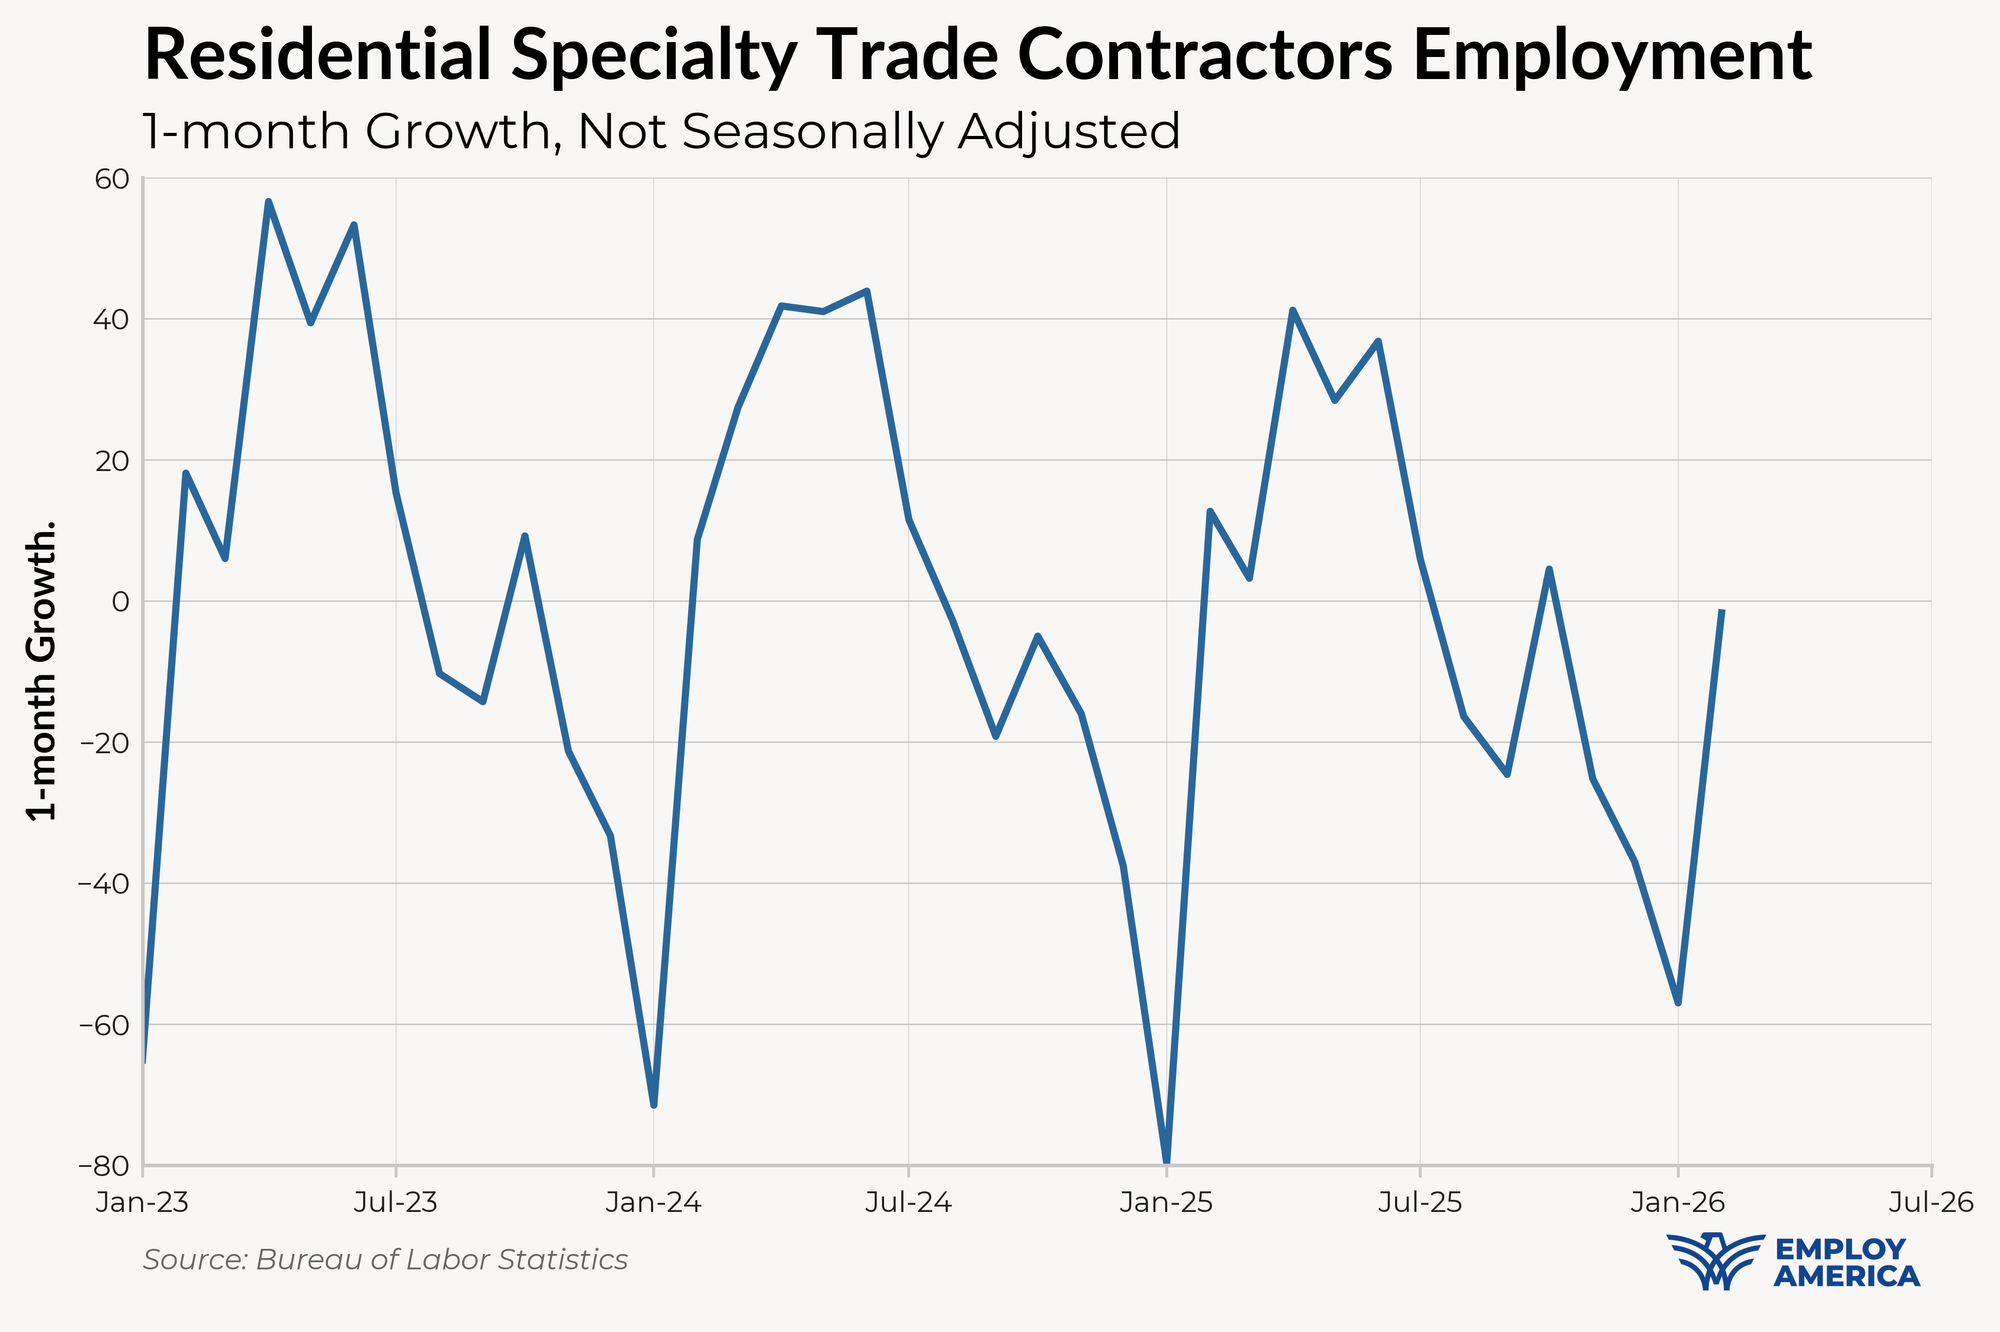
The birth-death model changes could also explain some of the weakness in other sectors this month. The birth-death changes were relatively positive in January for construction and and leisure and hospitality, which saw relatively strong Januaries but sizable losses in February (seasonally adjusted).
Birth-death adjustment to NSA payrolls, relative to average of Jan and Feb '25 and '24
Supersector
Jan
Feb
Mining and logging
-1
0
Construction
+9
-5
Manufacturing
+1
+2
Trade, transportation, and utilities
-1
-4
Wholesale trade
+3
-2
Retail trade
-1
-1
Transportation and warehousing
-3
-2
Utilities
0
0
Information
0
-4
Financial activities
-8
-3
Professional and business services
-2
-9
Private education and health services
+44
-14
Leisure and hospitality
+9
-15
Other services
+1
-3
Total nonfarm
+52
-54
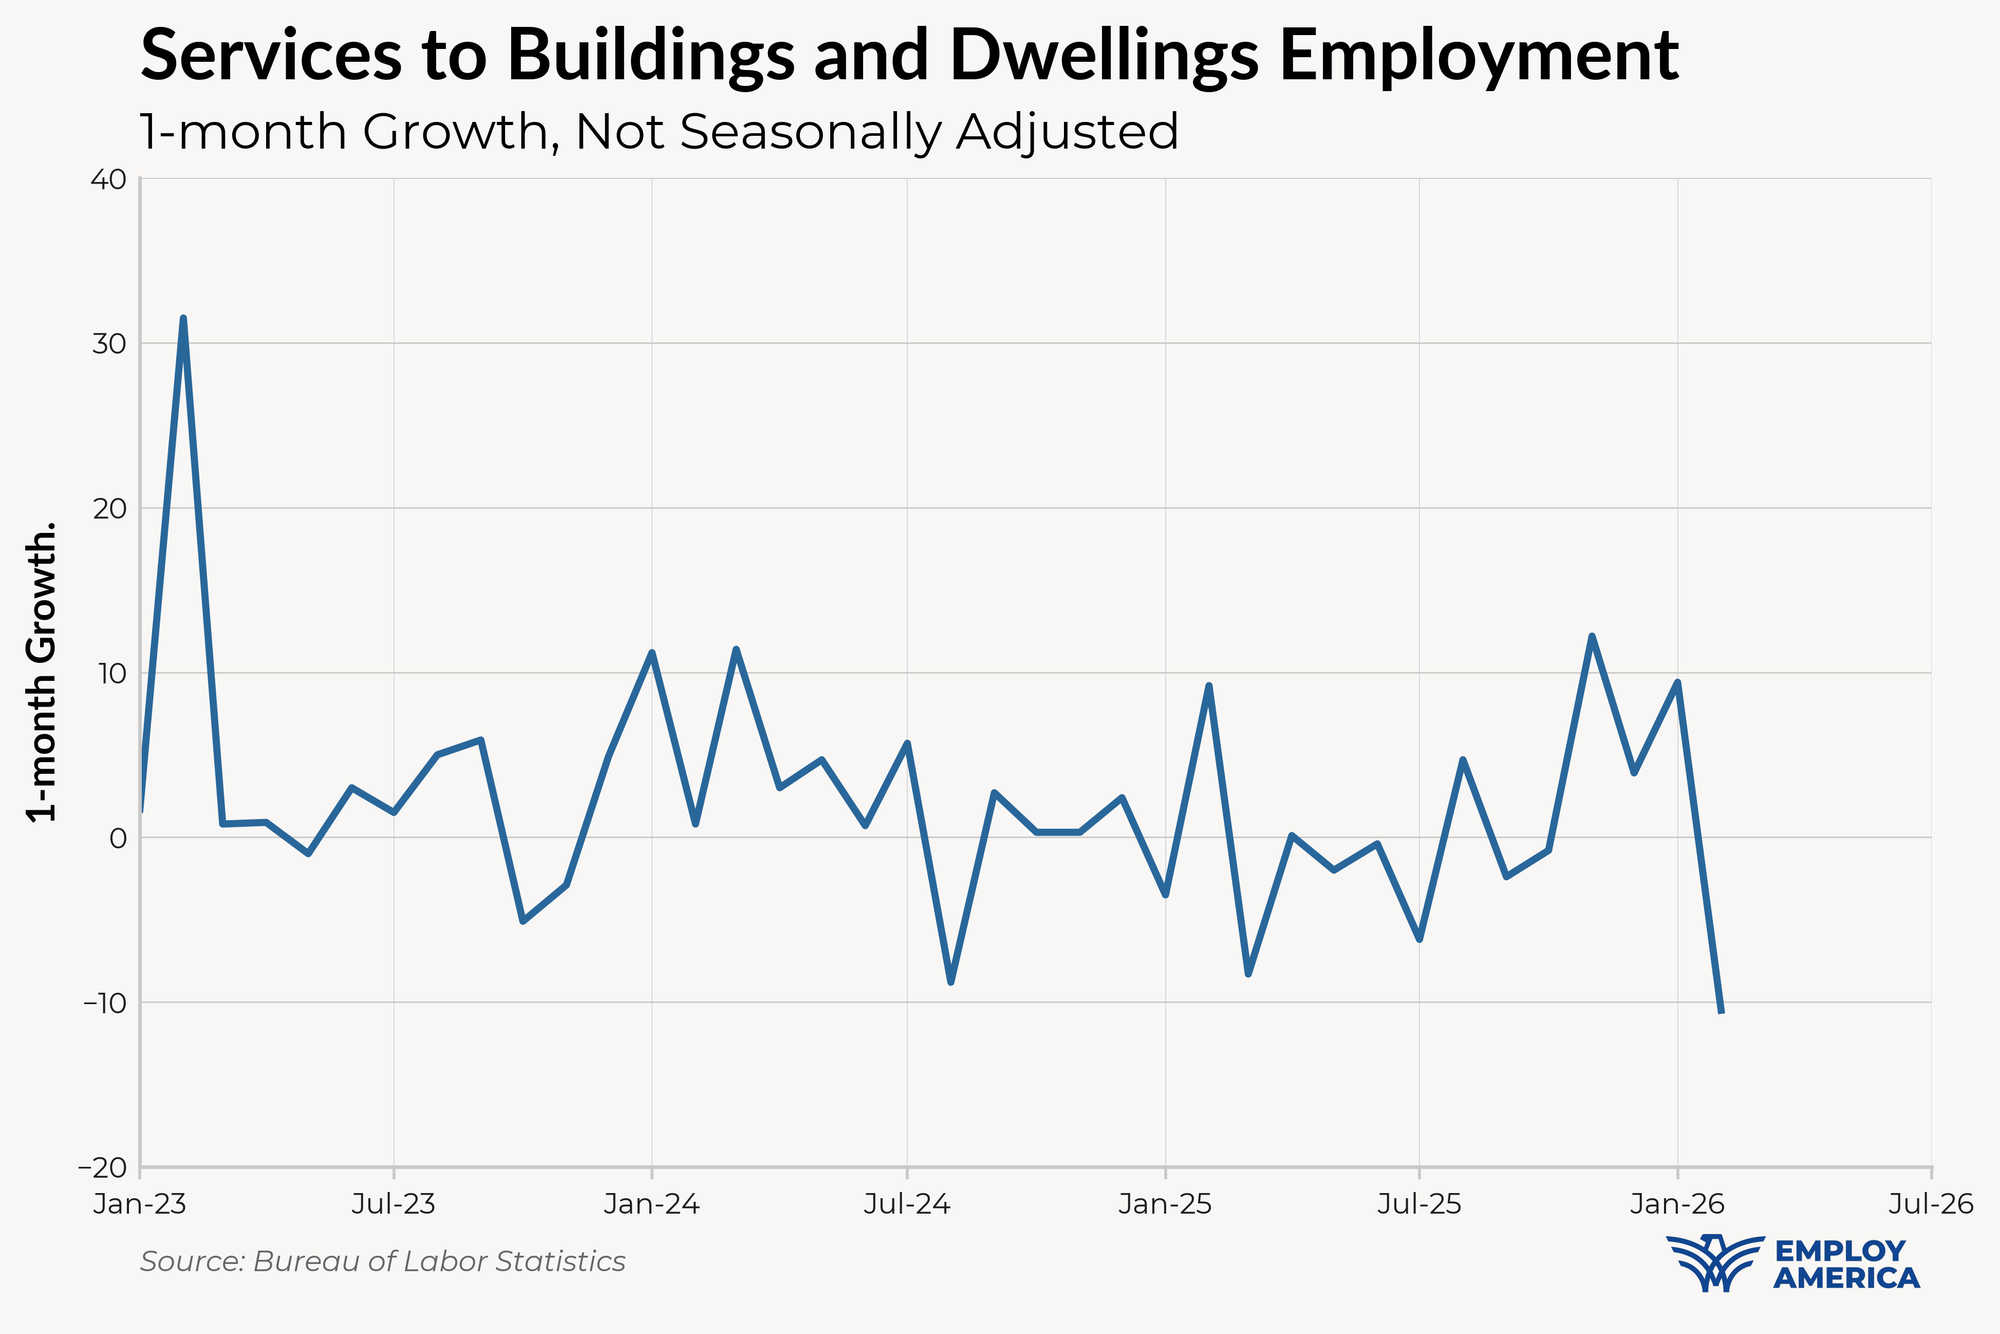
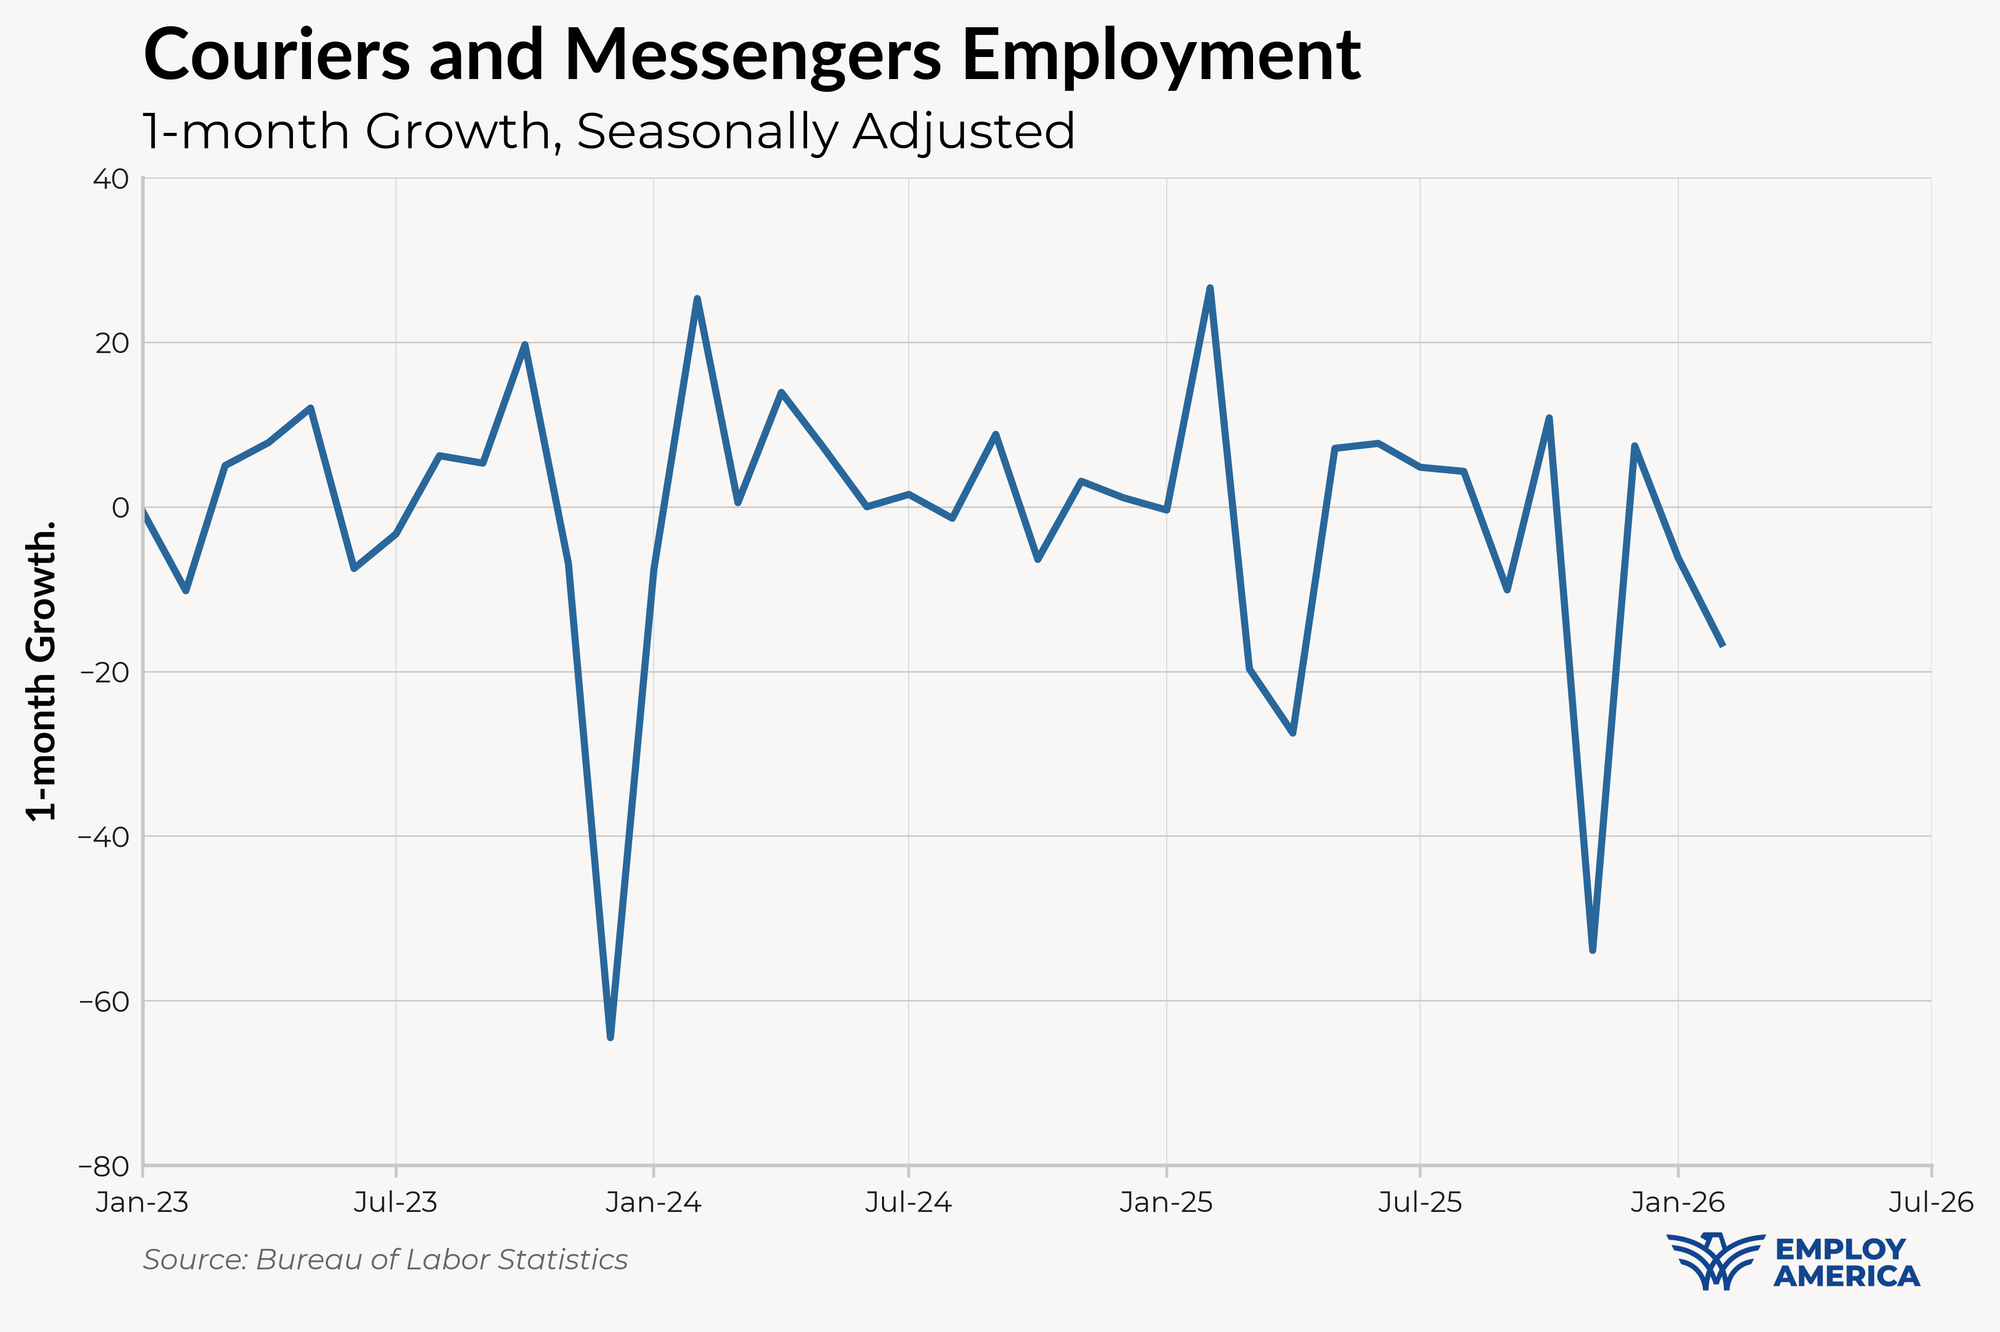
Also exhibiting weak growth in February were Services to Building and Dwellings (half of which are groundskeepers and janitors) as well as couriers and messengers. The cold weather in February may be playing a role here.
Taken altogether, these one-off effects and methodological quirks go part of the way—but not all of the way—towards explaining some of the weak February payroll numbers. To take a heroic assumption: if birth-death adjustments in 2026 were the average of '25 and '24, and the Kaiser strike wasn't happening, employment growth between January and February would still be 75k lower than in 2025 (on a not-seasonally-adjusted basis).
A Soft, but Less Dire Household Survey
The household survey was also soft, but less alarming than the establishment survey. Employment and participation rates both fell marginally, including negative revisions to January 2026.
At least part of what is contributing to softness is another methodological change by the BLS. With the report today, the BLS implemented new "population controls" starting with the January 2026 data based on updated population estimates from the Census Bureau. According to the BLS, these new controls see a higher population level for women, especially older women, and a lower population for prime-aged men. There were also decreases in the White and Black populations, and increases to Asians.
The new controls lower both labor force participation and employment rates, but have minimal effect on the unemployment rate. For that reason, this month the unemployment rate probably carries the strongest signal (although it too has a bit more noise than usual). The unemployment rate rose to 4.44%.
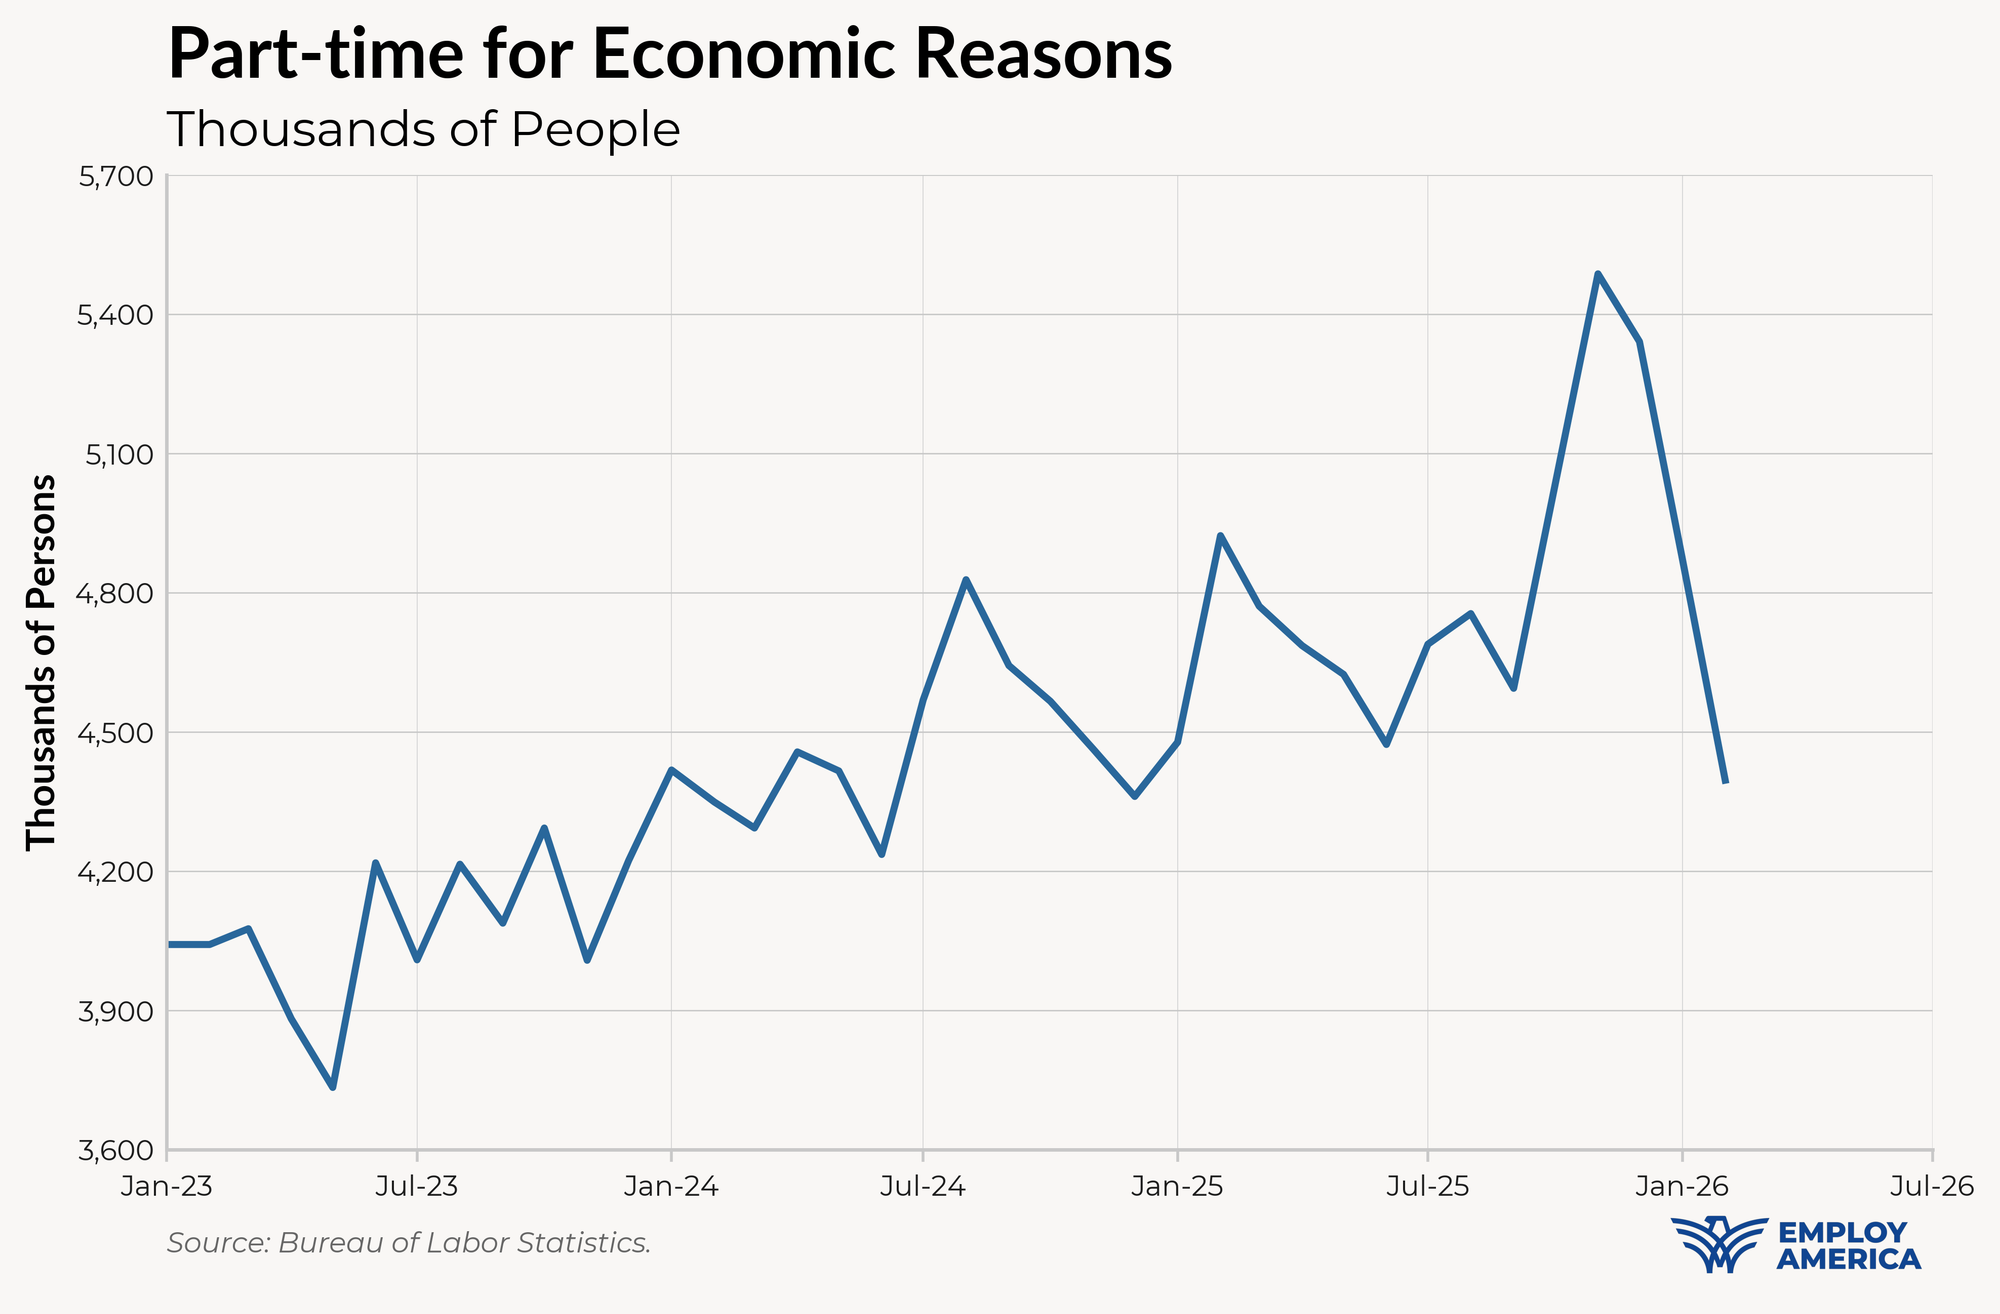
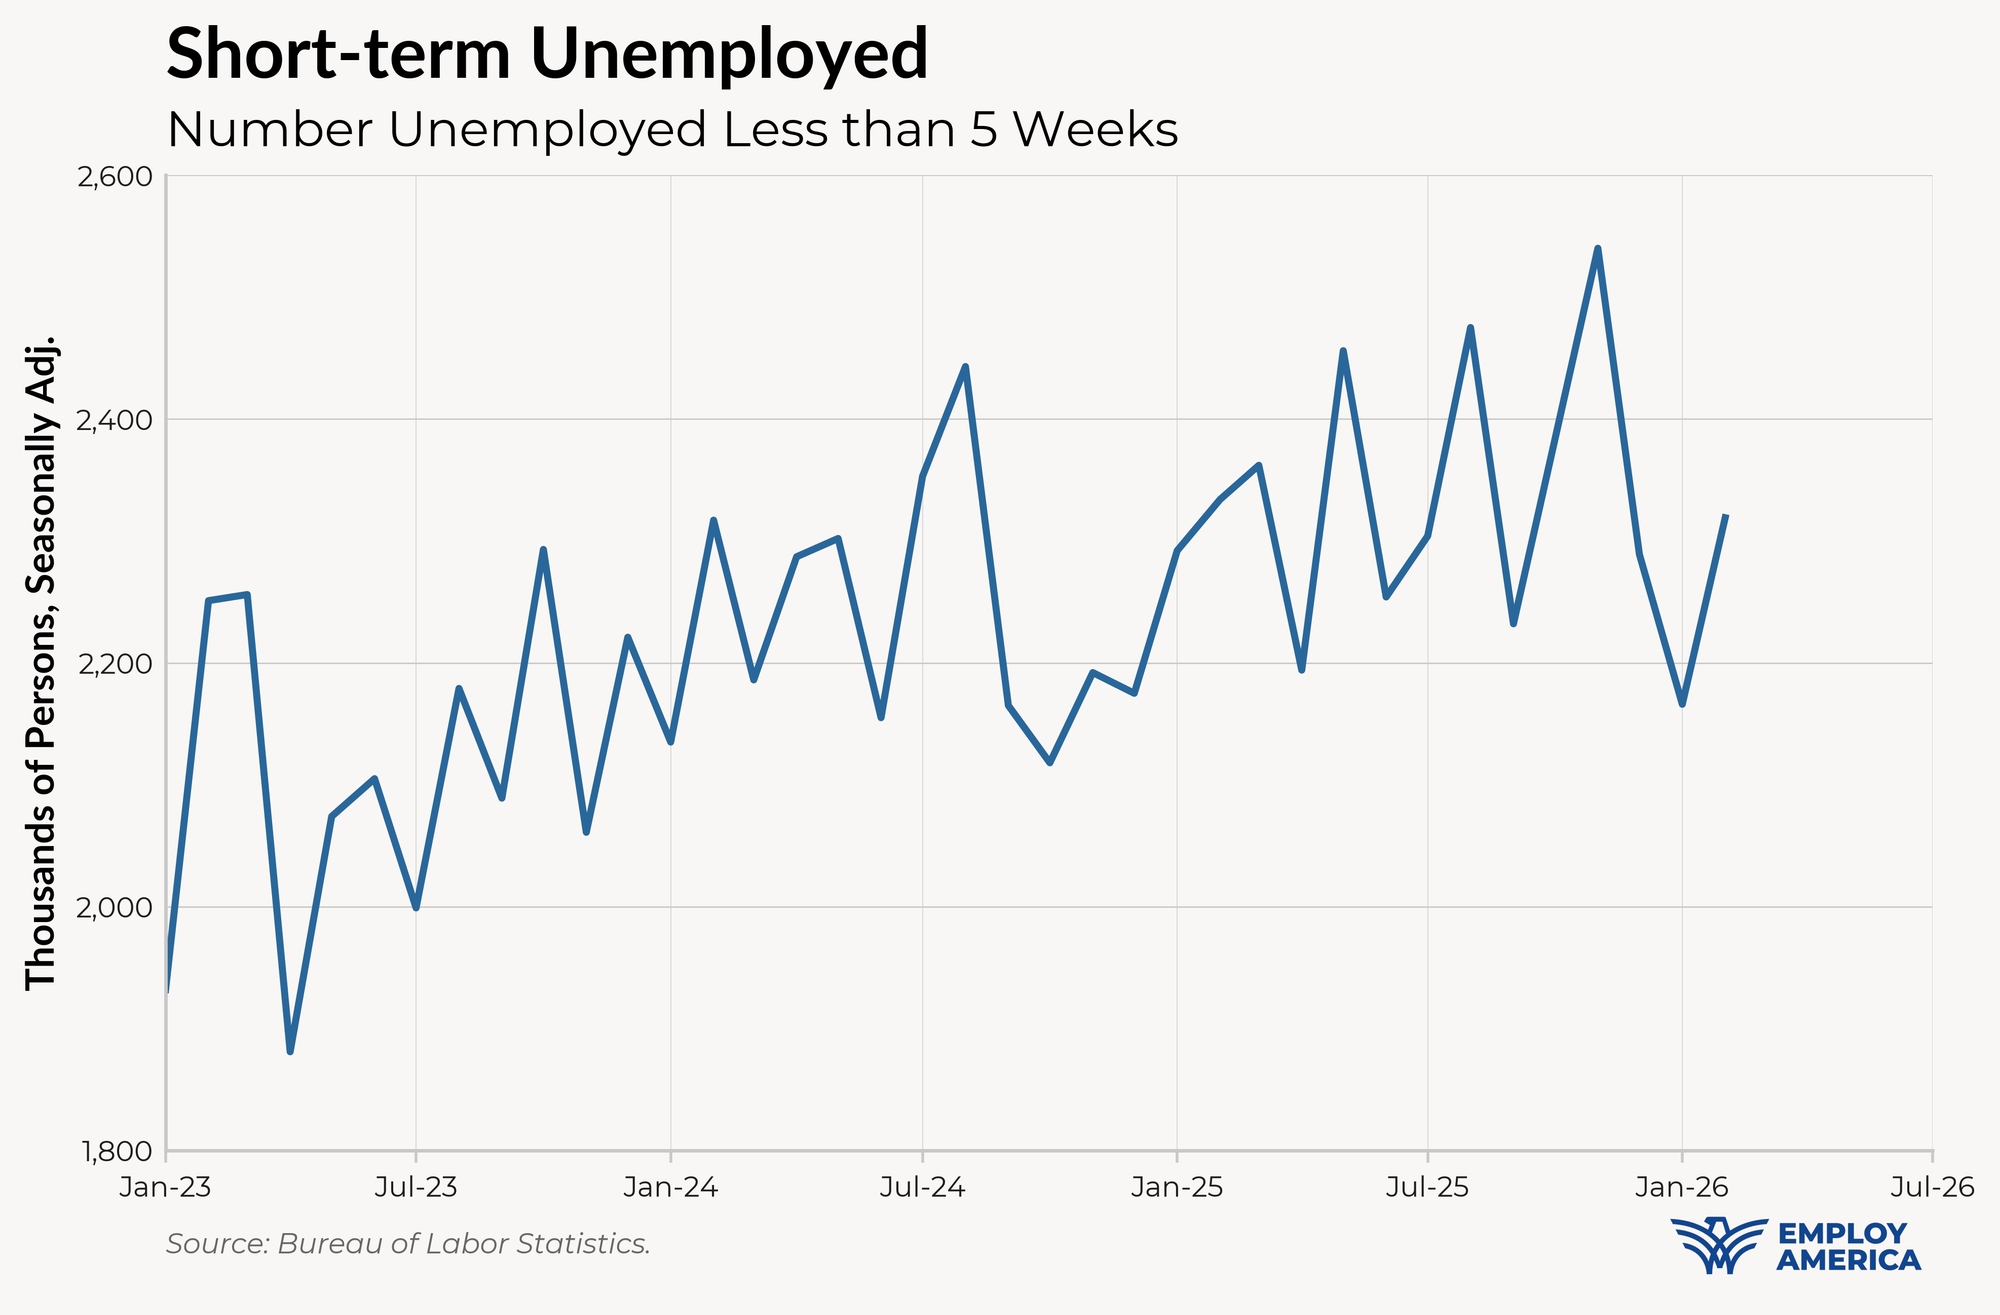
Elsewhere in the household survey, there aren't any red flags. The part-time for economic reason count continued to fall, and short-term unemployed (the CPS proxy for layoffs) remained around the same level it's been for the last year.
Are Rate Cuts Back?
For the last few months, the refrain from the FOMC has (mostly) been that they're willing to stay at 3.63% for an extended period of time so long as the labor market stays in good shape. This month's data opens the door to them changing their assessment of the labor market, but it's still not enough for a cut any time soon. They'll have fully digested the idiosyncratic details of this report by the March meeting, and they'll need a clearer, stronger signal before cutting.
Meanwhile, inflation does not look like it'll come down to 2% any time soon. Market-based core services are off to a hot Q1, due to high healthcare services and airfare pricing. We'll be on the watch for more signs of trouble in the labor market, but for now the FOMC will still be more concerned about inflation.
The link has been copied!
Your link has expired. Please request a new one.
Your link has expired. Please request a new one.
Your link has expired. Please request a new one.
Great! You've successfully signed up.
Great! You've successfully signed up.
Welcome back! You've successfully signed in.
Success! You now have access to additional content.