Labor Market Recap March 2026
This is a solid jobs report, but the confusion over nonfarm payroll prints continues.

This is a solid jobs report, but the confusion over nonfarm payroll prints continues.
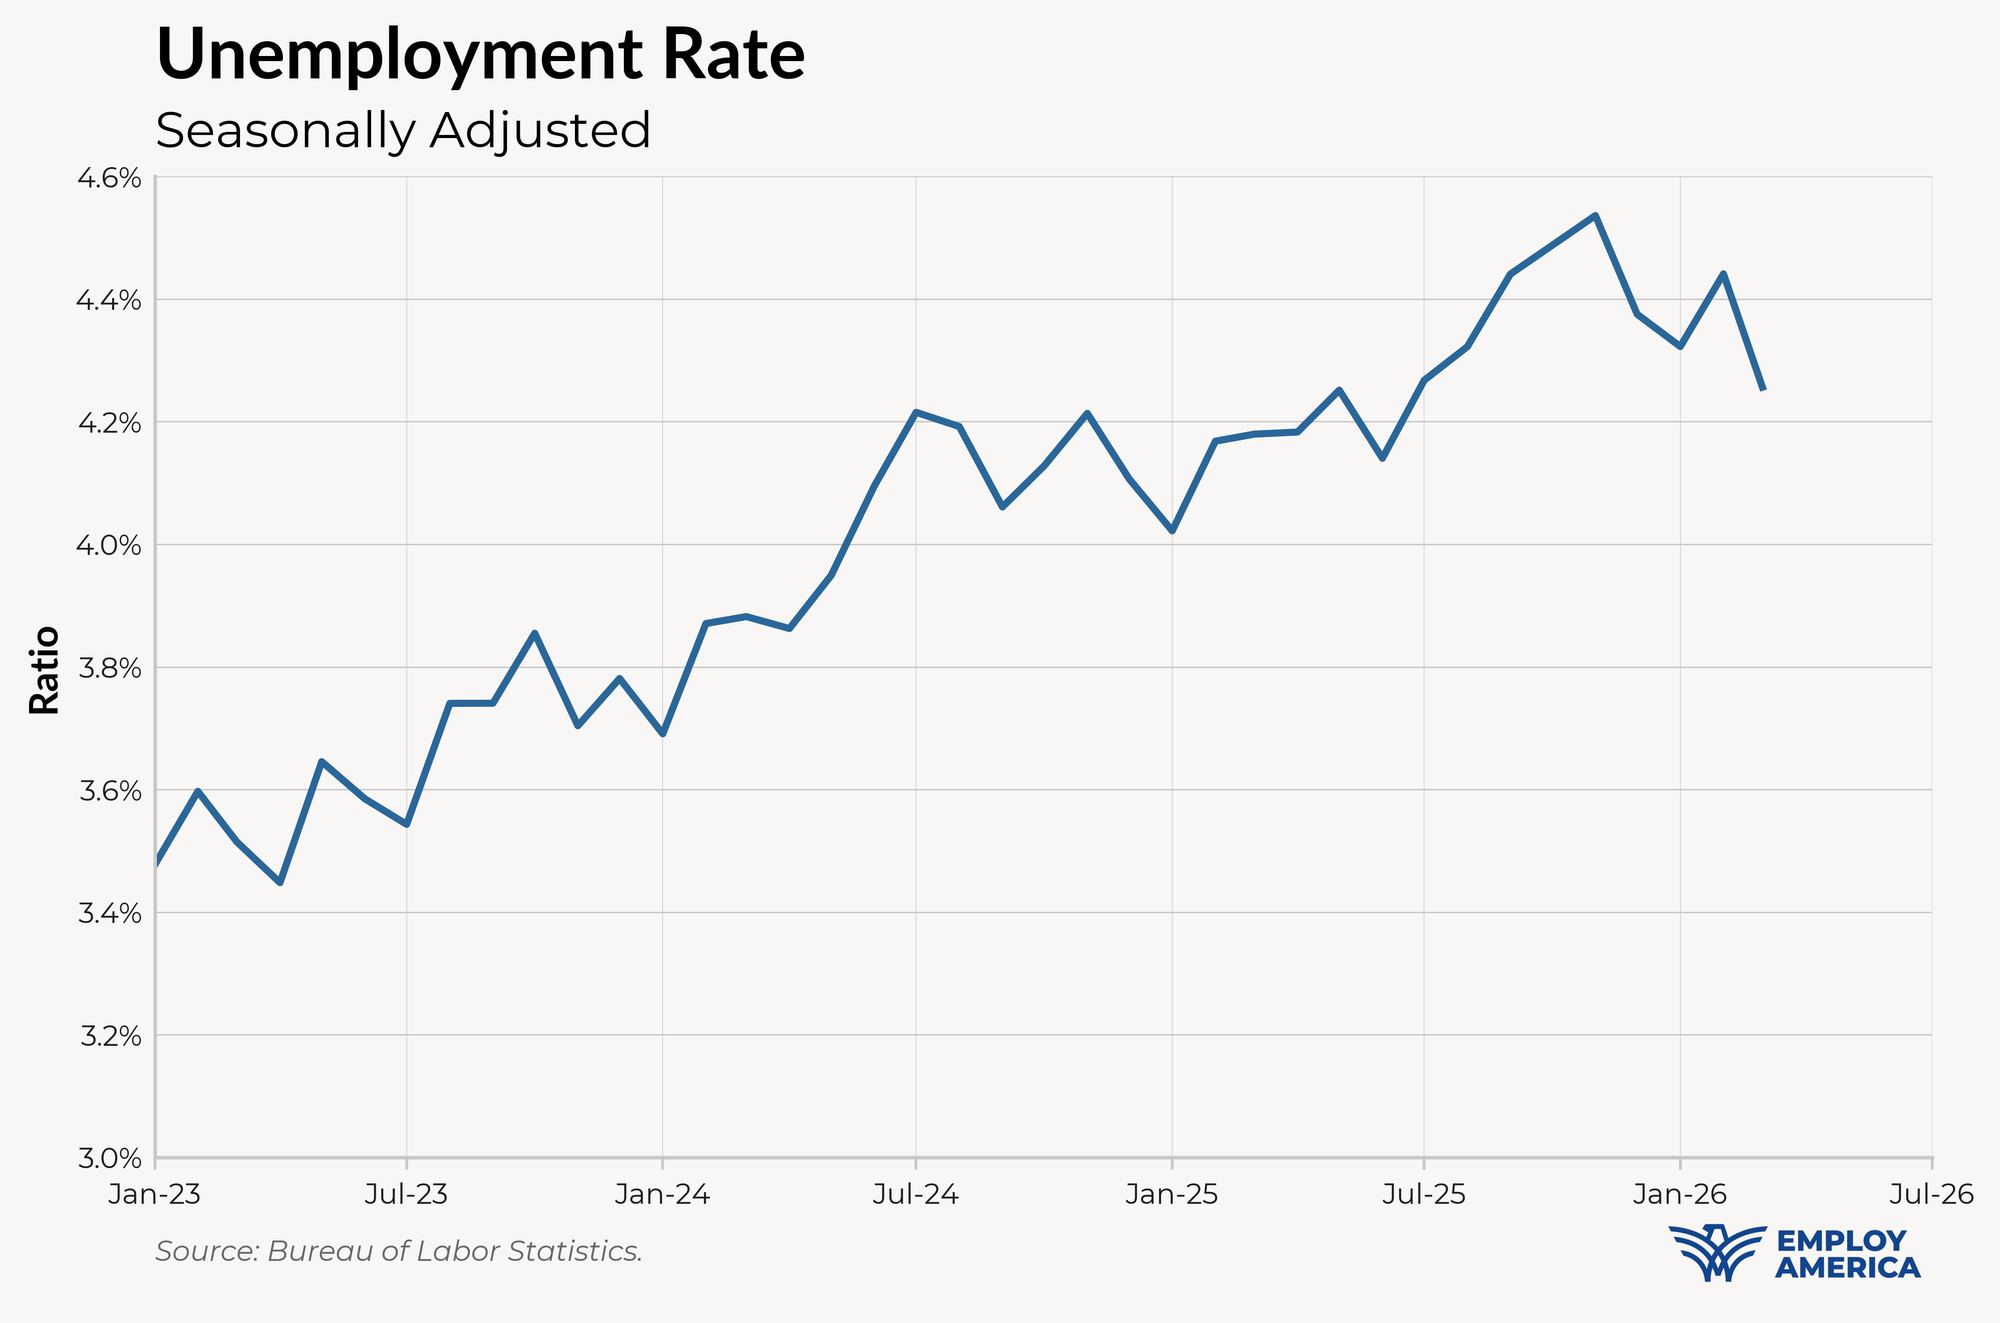
The labor market added 178,000 jobs in March 2026, with nearly-offsetting revisions to the previous two months (upwards for January by 34,000 and downwards for February by 41,000). The unemployment rate fell by 0.18pp to 4.26%, and prime-age employment remained at 80.7%. All signs of layoffs remained low, but the JOLTS hiring rate reached 3.1%, a level last seen in the depths of the COVID and GFC recessions.
As we wrote about yesterday, the Fed will likely take a greater signal from the ratios (unemployment, employment, and participation rates) than the headline payrolls data. They should, as the confusion over nonfarm payroll prints continues with this report. Some of the headline increase in payroll employment in March represents the same quirks that drove February weakness (the changes to the birth-death model and the Kaiser strike depressing February employment also lead to high payroll growth in March), and the revisions represent changes to both underlying payroll estimates and seasonal adjustment factors.
With that in mind, this is a solid jobs report. The decrease in the unemployment rate is likely to give the FOMC comfort about labor market risk. Cuts are probably not coming for a while.
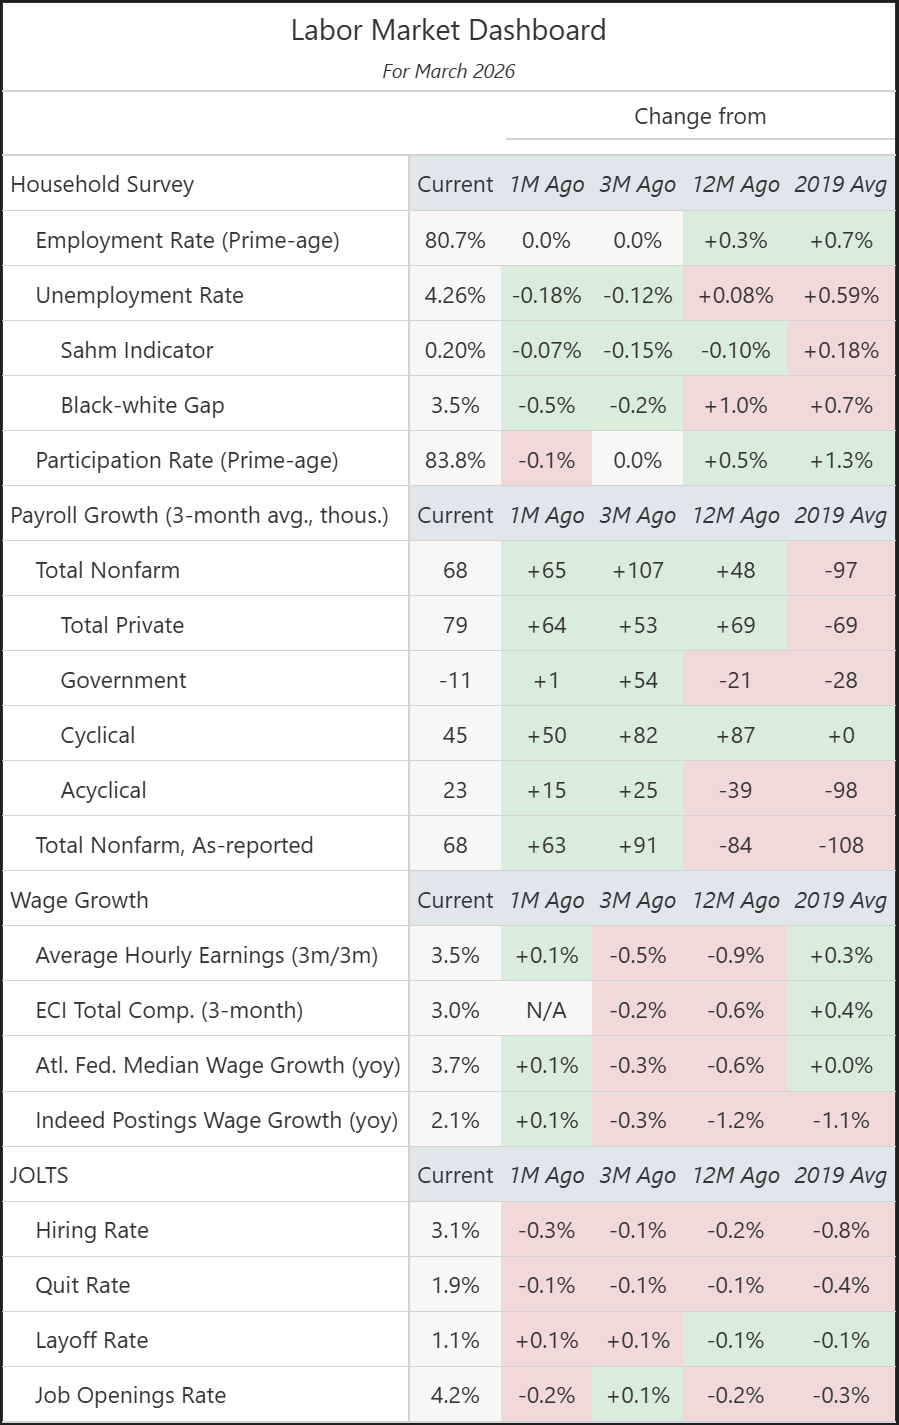
It’s hard to find anything to complain about in the January household survey. The unemployment rate, which peaked at 4.44% in September 2025, has since fallen to 4.26%. Prime-age employment, at 80.7%, is near its cycle high of 80.9% and still above any level seen in the 2010s.
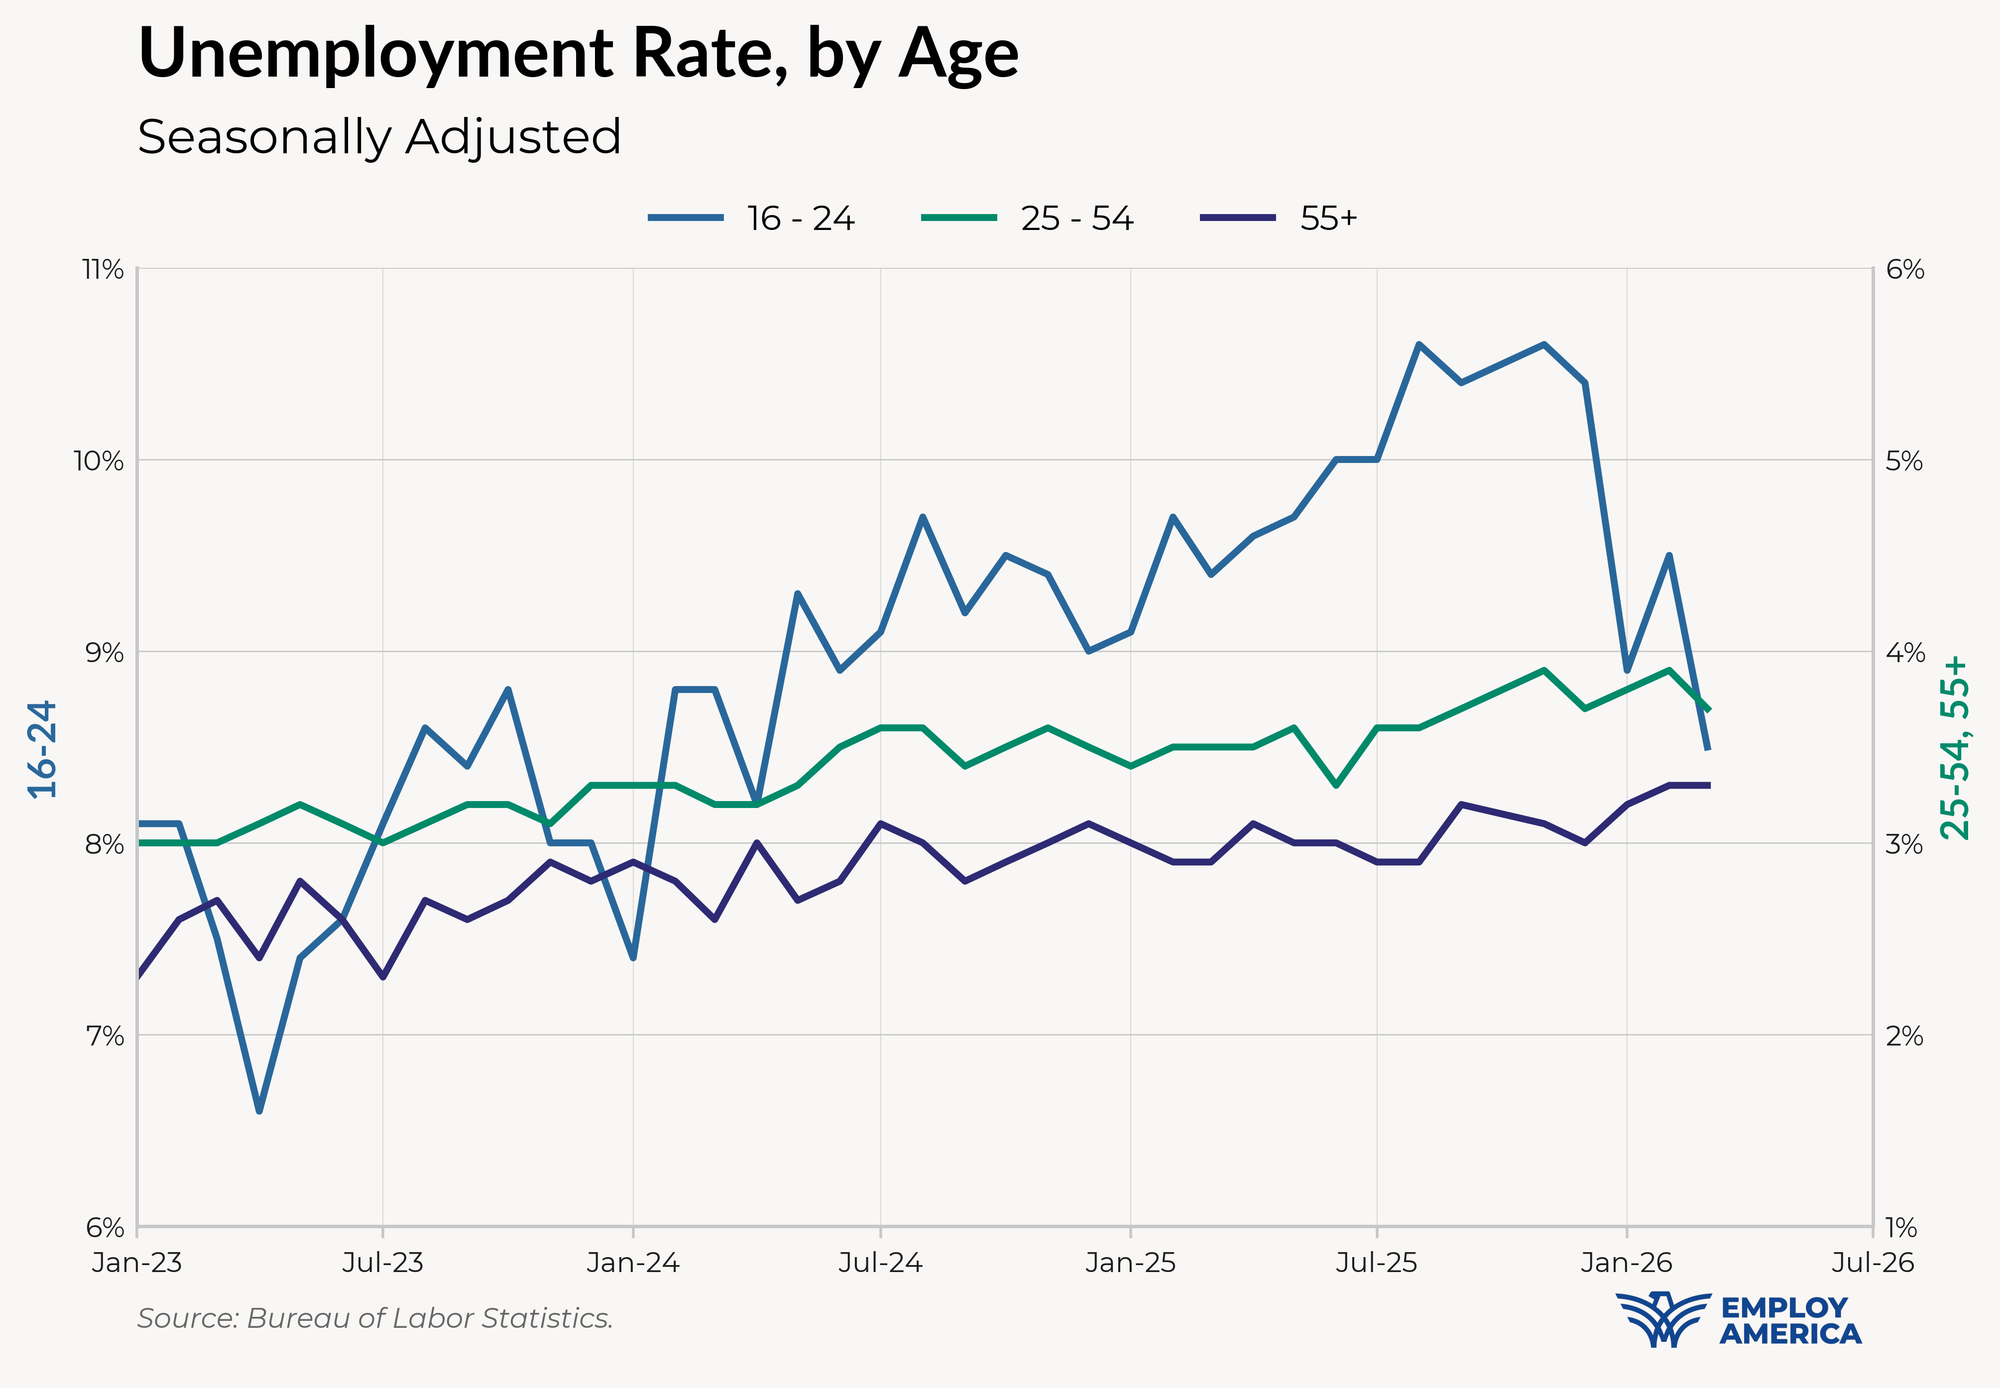
The decline in unemployment is mostly attributable to a decline in youth unemployment, particularly the 20-24 cohort. Youth unemployment, which peaked in August at 10.6%, has fallen to 8.5%. For reference, the prior level is similar to youth unemployment rate levels seen around 2015; the latter level is similar to around 2018.
Notable in this month’s household survey data is the lack of any evidence indicating a wave of layoffs. We already have one signal that layoffs are low from the JOLTS data, where the layoff rate has been slightly lower over the past few months. In the household survey, the composition of unemployment appears to be improving, with a sizable drop in unemployed permanent job losers this month (which would be those facing permanent layoffs).
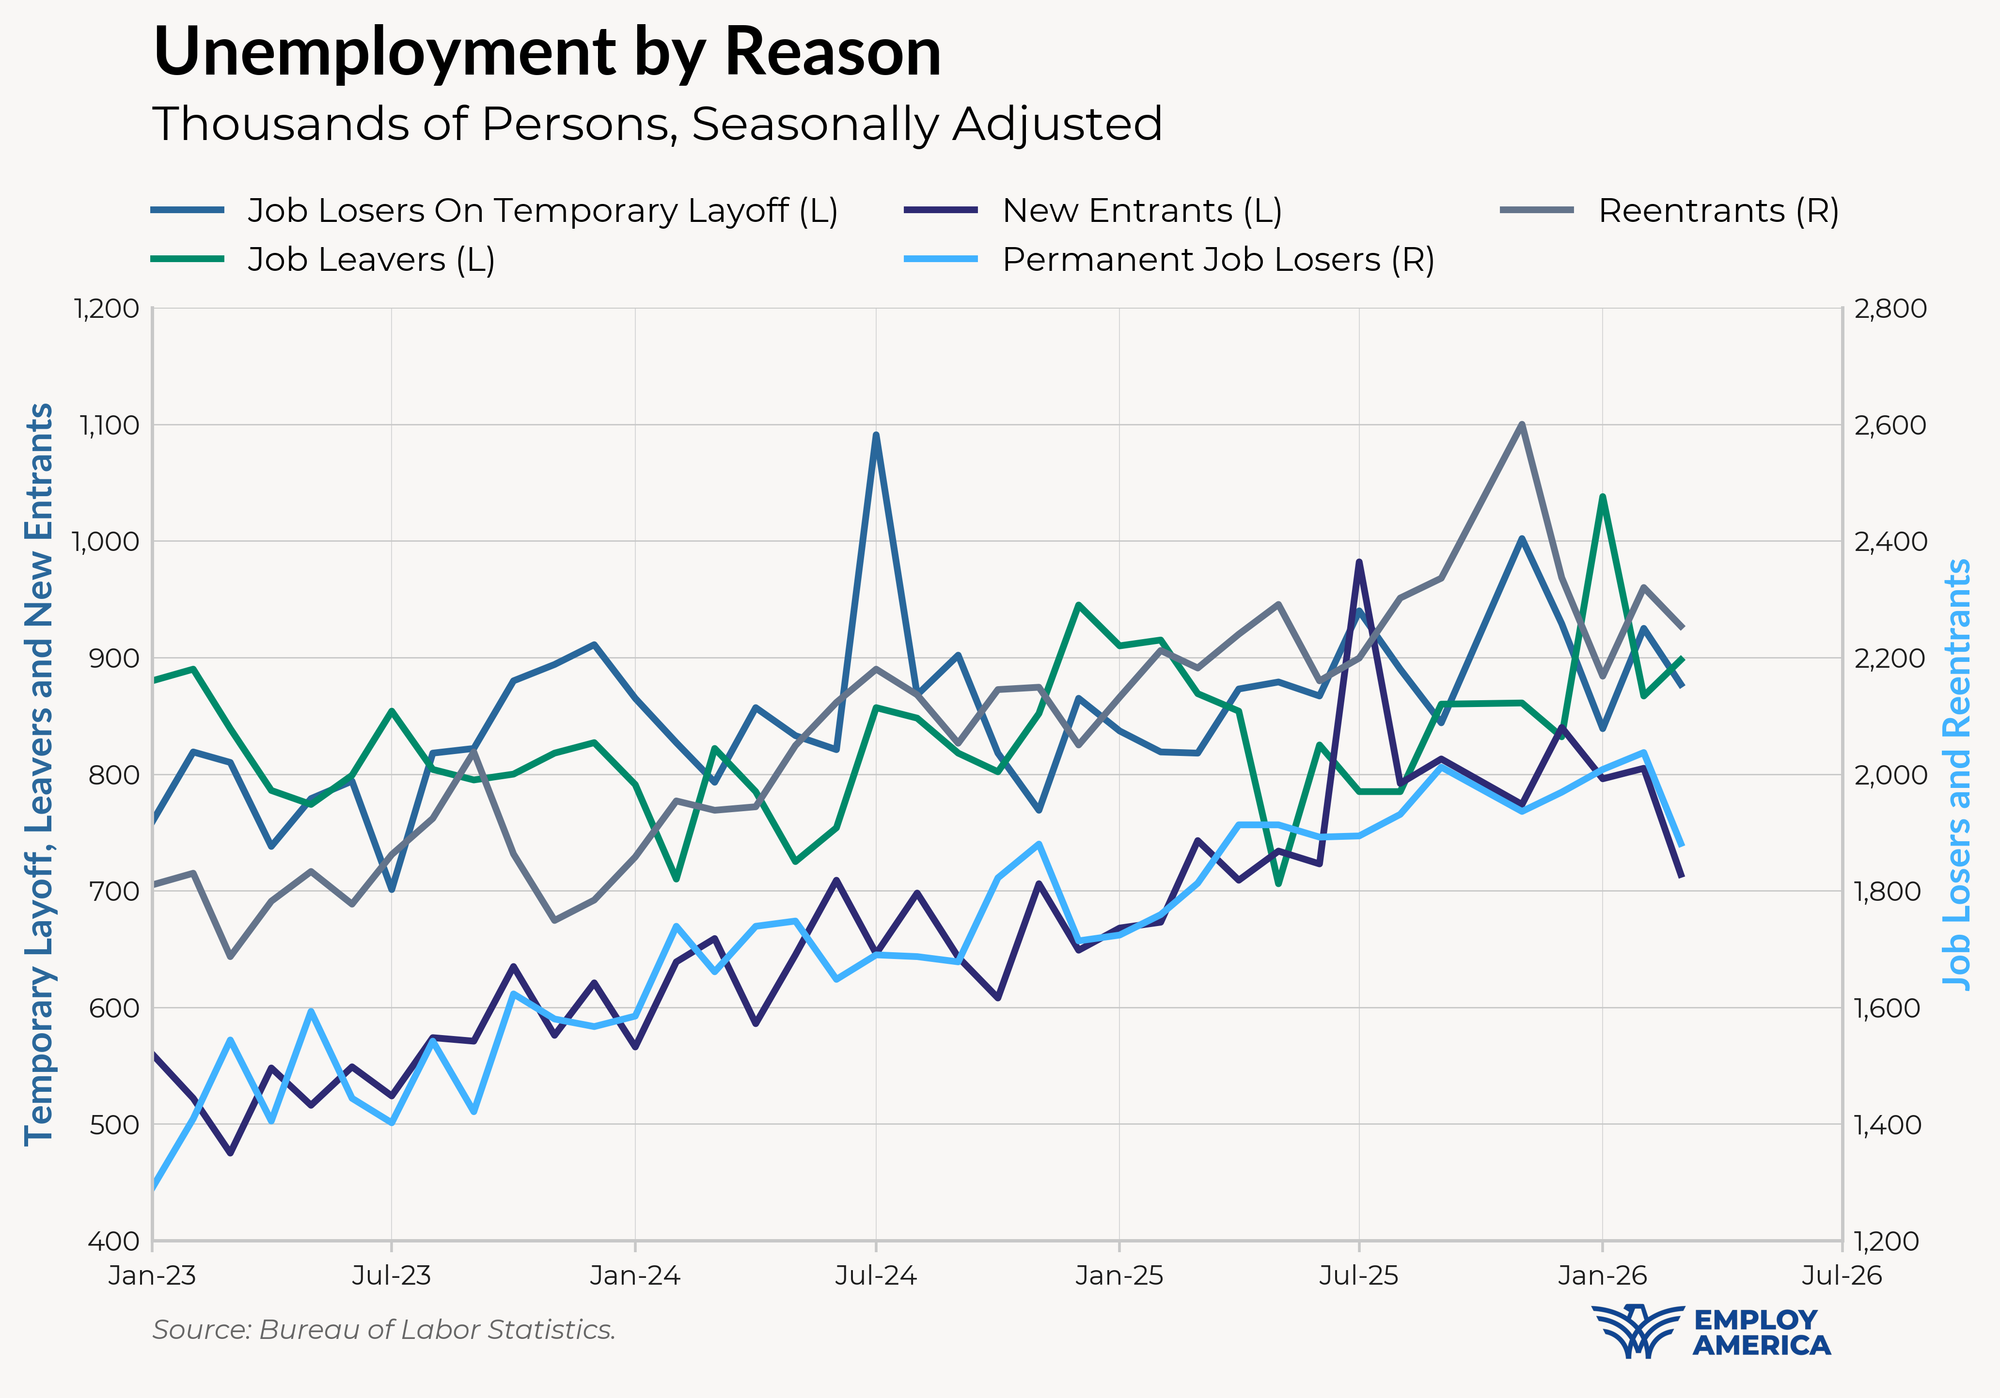
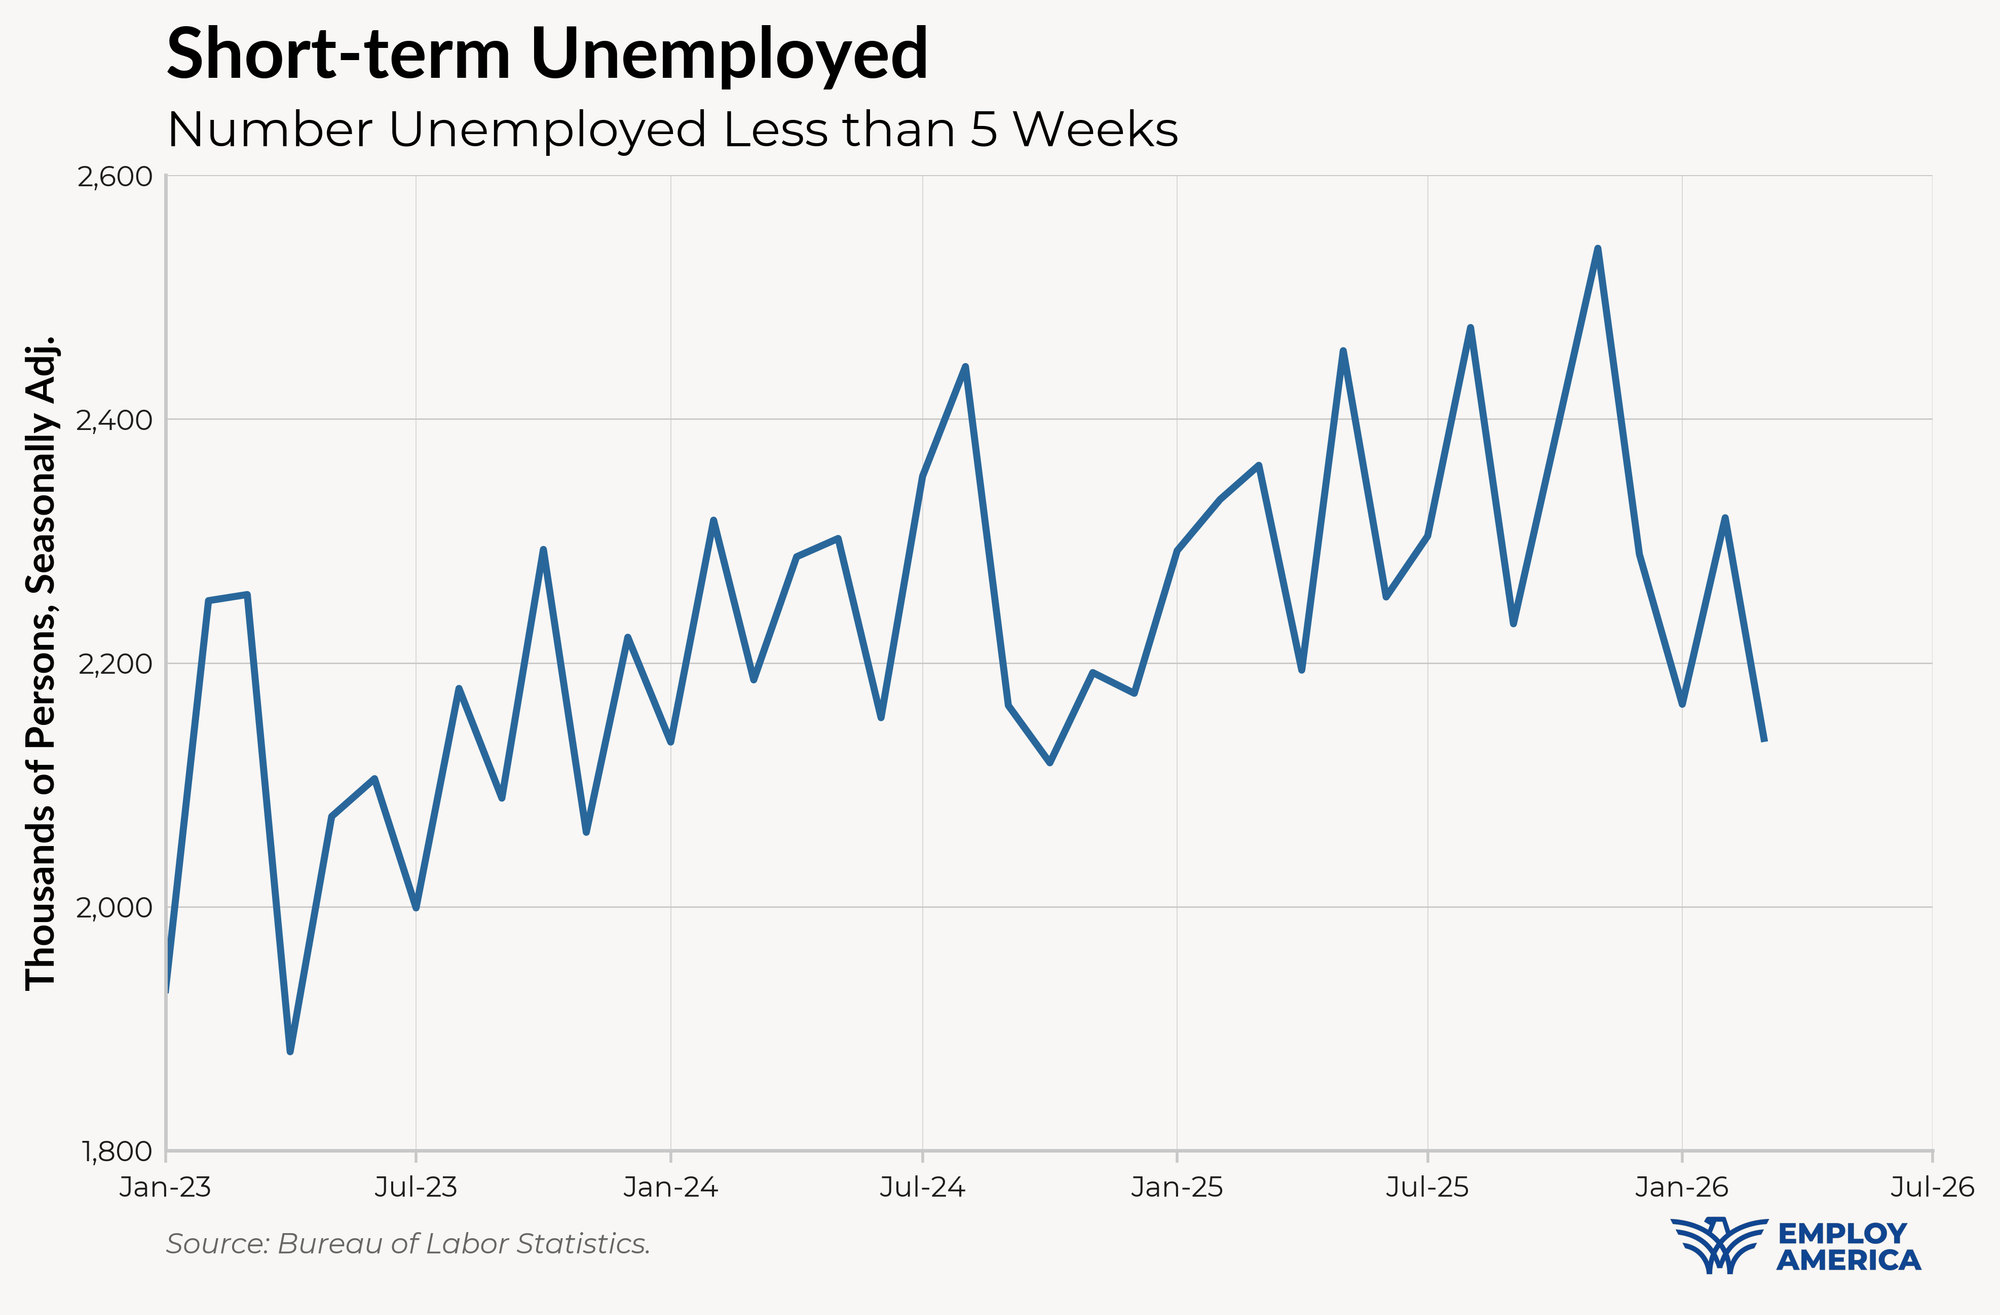
The number of short-term unemployed is now at its lowest level since 2024, and substantially down from its peak earlier in 2025:
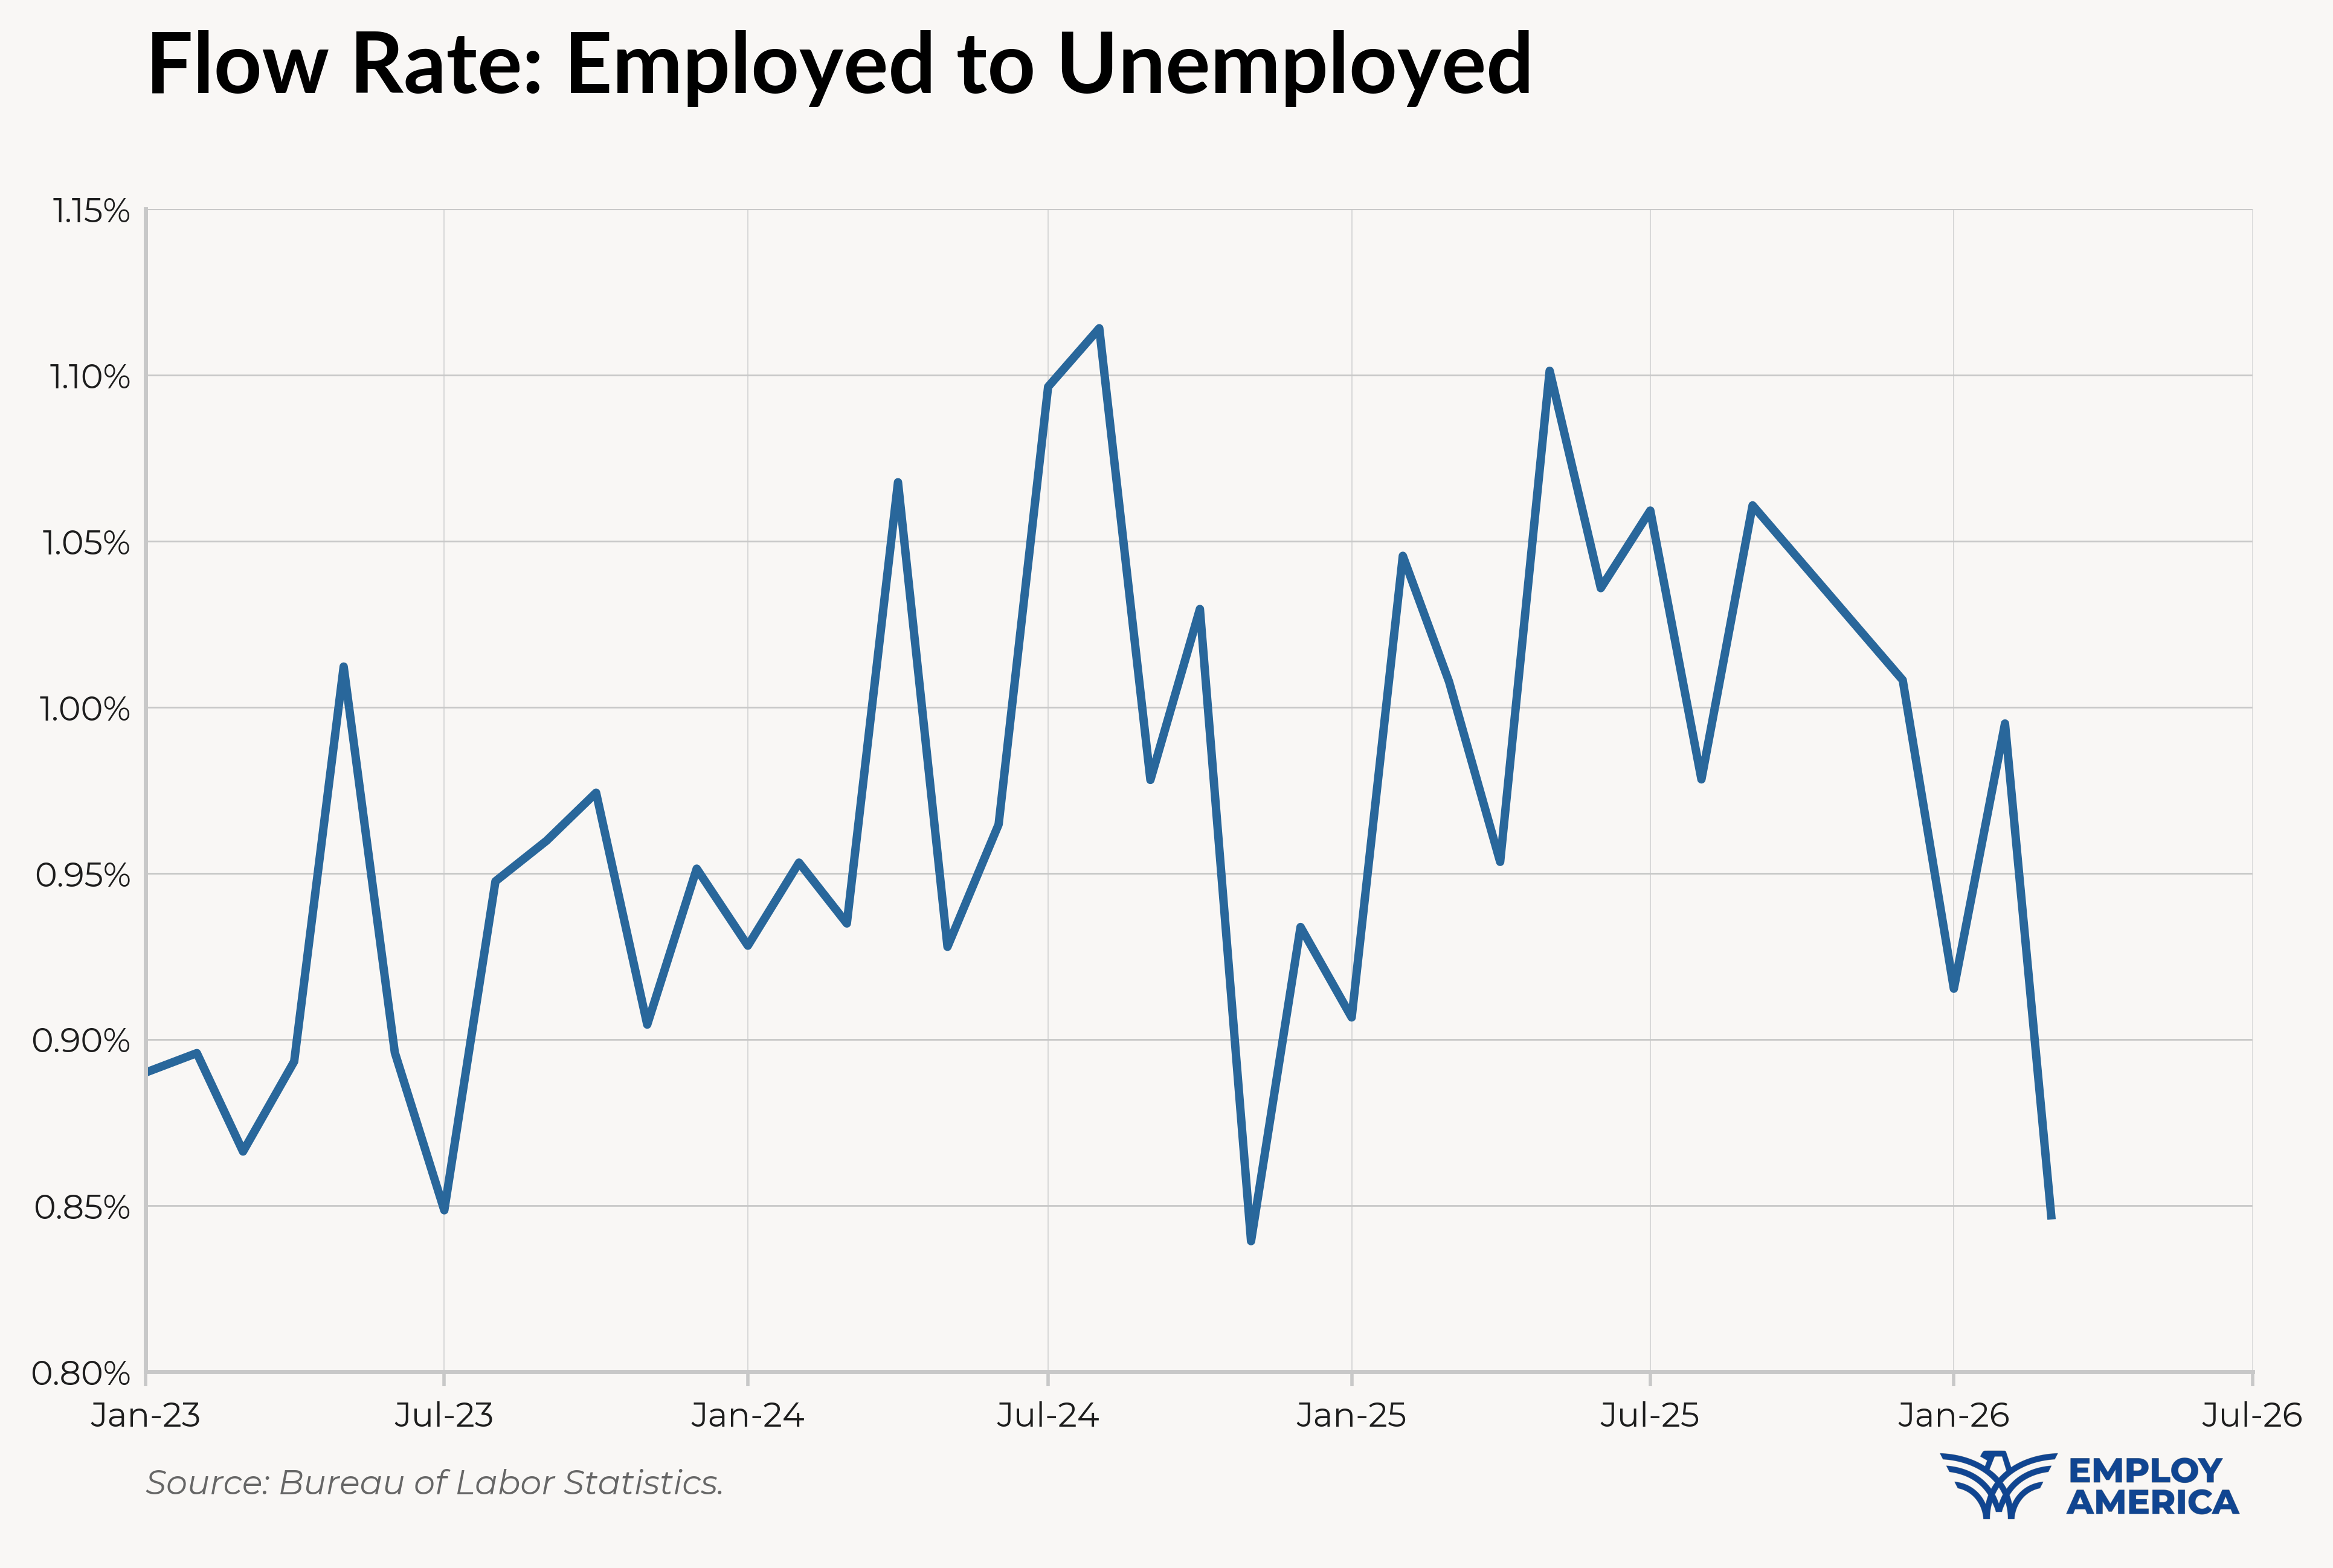
Finally, the flow rate of employed to unemployed workers fell by about 15% in March, continuing a downward trend we’ve been seeing since mid-2025.
We noted last month that the payrolls growth numbers are facing large swings that may not be sending much signal about the labor market. Because those swings affect levels of payroll numbers, the effects on growth rates are felt for multiple months.
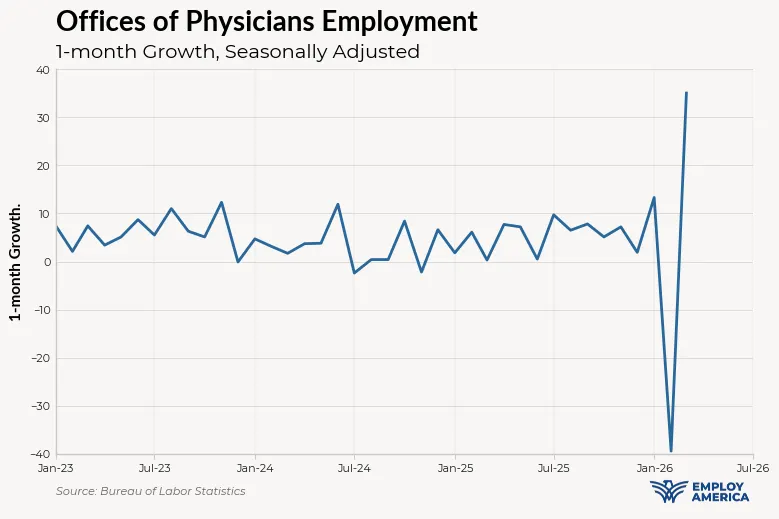
For example, the Kaiser Permanente strike in February ended. After those workers returned to work, the rebound in employment shows up as a particularly large increase in healthcare employment in March.
We may also be experiencing whiplash from the changes to the new firm birth-death model in the payrolls numbers. Birth-death adjustments lowered payroll employment by 53,500 in February 2026, but only by 20,000 in March 2026 (compared to the average of their 2024 and 2025 analogs). To the extent that this is due to spurious changes in the birth-death model, this shows up as larger payrolls growth in March (and a larger payrolls drop in February).
It’s also hard to know how much to take from the revisions to previous months. This month’s report ostensibly comes with a revision of +34,000 to January and -41,000 to February payroll changes. But if one looks to the payroll levels, the story is a bit different. Non-seasonally adjusted payrolls for January were only revised upwards by 5,000 jobs; the rest is changes in seasonal factors. On the other hand, seasonally-adjusted payrolls for February were adjusted down by only 7,000 while non-seasonally-adjusted payrolls were revised downwards by a whopping 82,000 jobs. In short, the payroll picture for February is probably worse than the revisions imply, since the seasonal adjustment change is attenuating some of the underlying revisions that come from additional data.
On top of all of that, changes in demographics and population growth imply a lower breakeven payrolls growth, but the extent to which breakeven has fallen is highly uncertain. One way of approaching this problem is to take projections of population growth from the Census or CBO and calculate the implications for breakeven employment growth, as this FEDS Note recently did. A handful of FOMC officials have leaned on research using this method to infer that breakeven payrolls growth has fallen.
Another way to infer a lower breakeven rate is to look at the relationship between payrolls growth and CPS employment—as Austan Goolsbee said, “the modest aggregate job numbers can't be far from the true break-even point or else the unemployment rate would have been rising.” Taking the spirit of Goolsbee’s comment, we perform the following exercise (we will have more details in a follow-up piece next week):
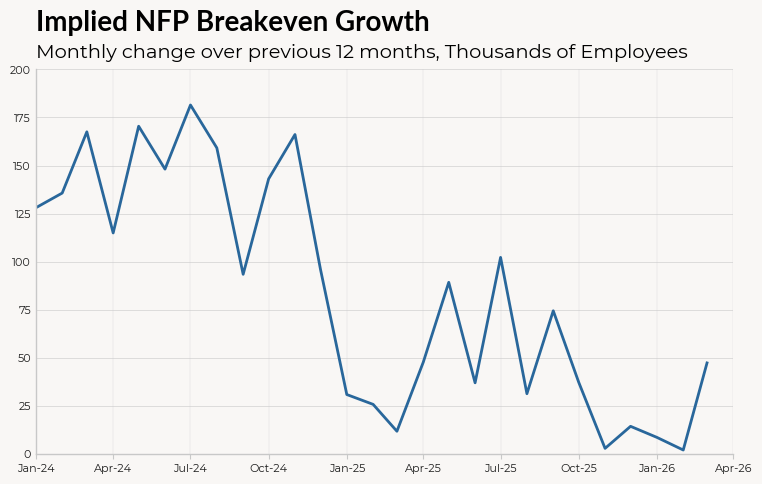
There’s some volatility in month-to-month measures, but our implied breakeven payroll employment growth rate fell from near 150,000 in 2024 to near-zero in recent months. This is consistent with some other population growth-based methodologies; for example, Murray and Vidangos (2026) find that breakeven employment growth could be near-zero in 2026.
If the labor market keeps looking the way it did in March, there’s virtually no chance of the Fed cutting any time soon. Most FOMC members already see risks skewed towards the inflation side, and this month’s data is likely to provide the hawks with the confidence that monetary policy isn’t unduly pressuring the labor market—perhaps enough that they’ll be comfortable calling for cuts if inflation gets out of control.
But that doesn’t mean there aren’t downside risks ahead. The fallout of the War with Iran is still yet to be felt, and real retail consumption has been contracting in Q1. We see a real possibility that real GDP growth in Q2 is negative. It may be fair for the Fed to downplay expectations of cuts in the near future—just don’t take them off the table.