Labor Market Recap, September 2025 (ish)
Given the lack of data between now and the next meeting, unemployment claims and soft data may determine the tiebreak.

Given the lack of data between now and the next meeting, unemployment claims and soft data may determine the tiebreak.
The labor market added 119,000 net jobs in August, with negative revisions of -7,000 and -26,000 to the previous two months. The unemployment rate rose to an unrounded 4.44%, up 12bp from last month and 0.32bp from three months ago. Prime-age employment held steady at 80.7%. Average hourly earnings came in at 3.8%.
The data for September is already stale, but we have a few more recent data points. Unemployment claims, which were also released today, showed a slight rise in continuing claims but no rise initial claims over the past few weeks. Wage growth in the Indeed job postings data grew by just 2.4% year-on-year, the lowest in the cycle.
| Labor Market Dashboard | |||||
| For September 2025 | |||||
| Change from | |||||
|---|---|---|---|---|---|
| Household Survey | Current | 1M Ago | 3M Ago | 12M Ago | 2019 Avg |
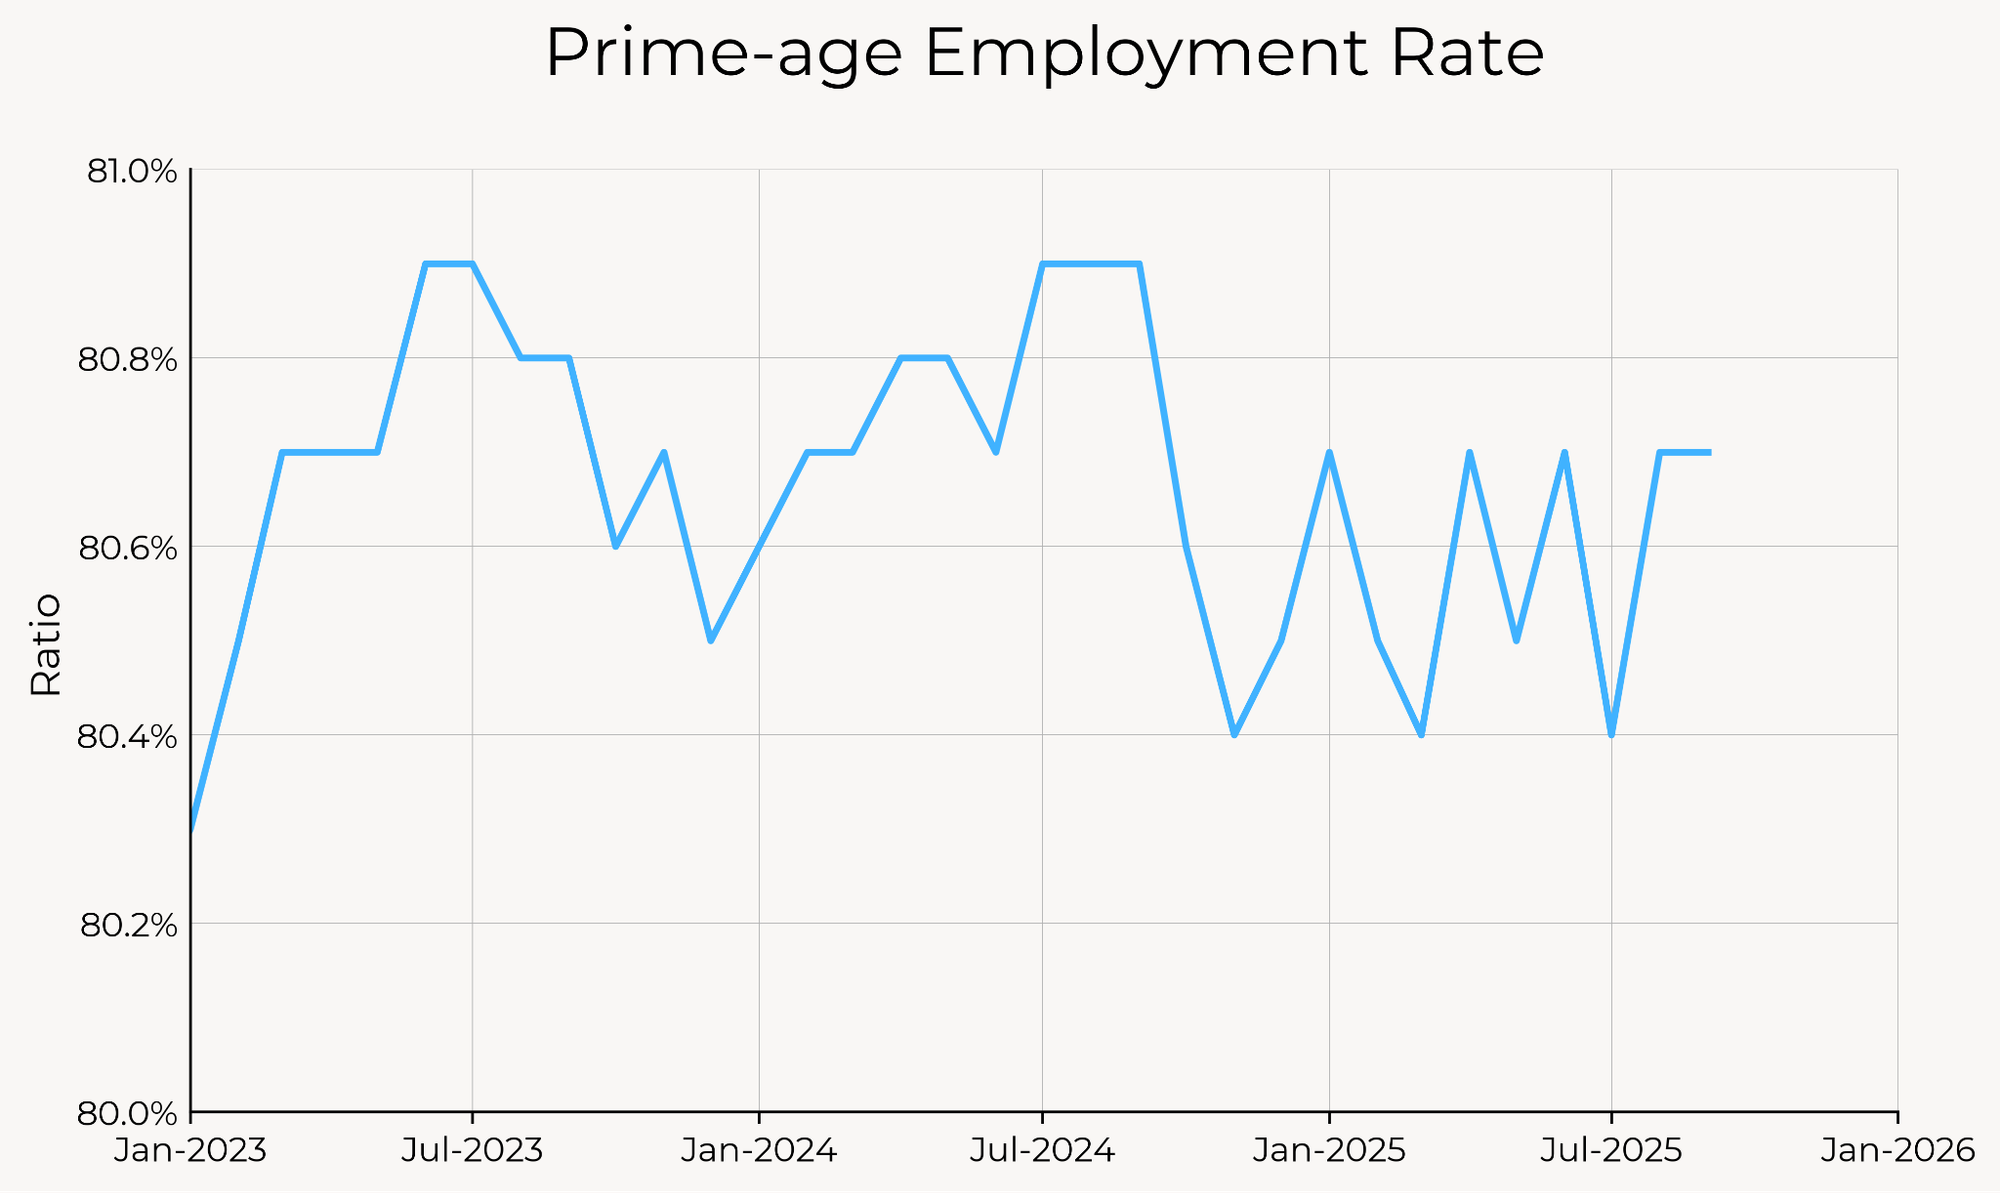
| Employment Rate (Prime-age) | 80.7% | 0.0% | 0.0% | -0.2% | +0.7% |
| Unemployment Rate | 4.44% | +0.12% | +0.32% | +0.35% | +0.77% |
| Sahm Indicator | 0.23% | +0.10% | +0.07% | -0.27% | +0.22% |
| Black-white Gap | 3.7% | -0.1% | +0.5% | +1.7% | +0.9% |
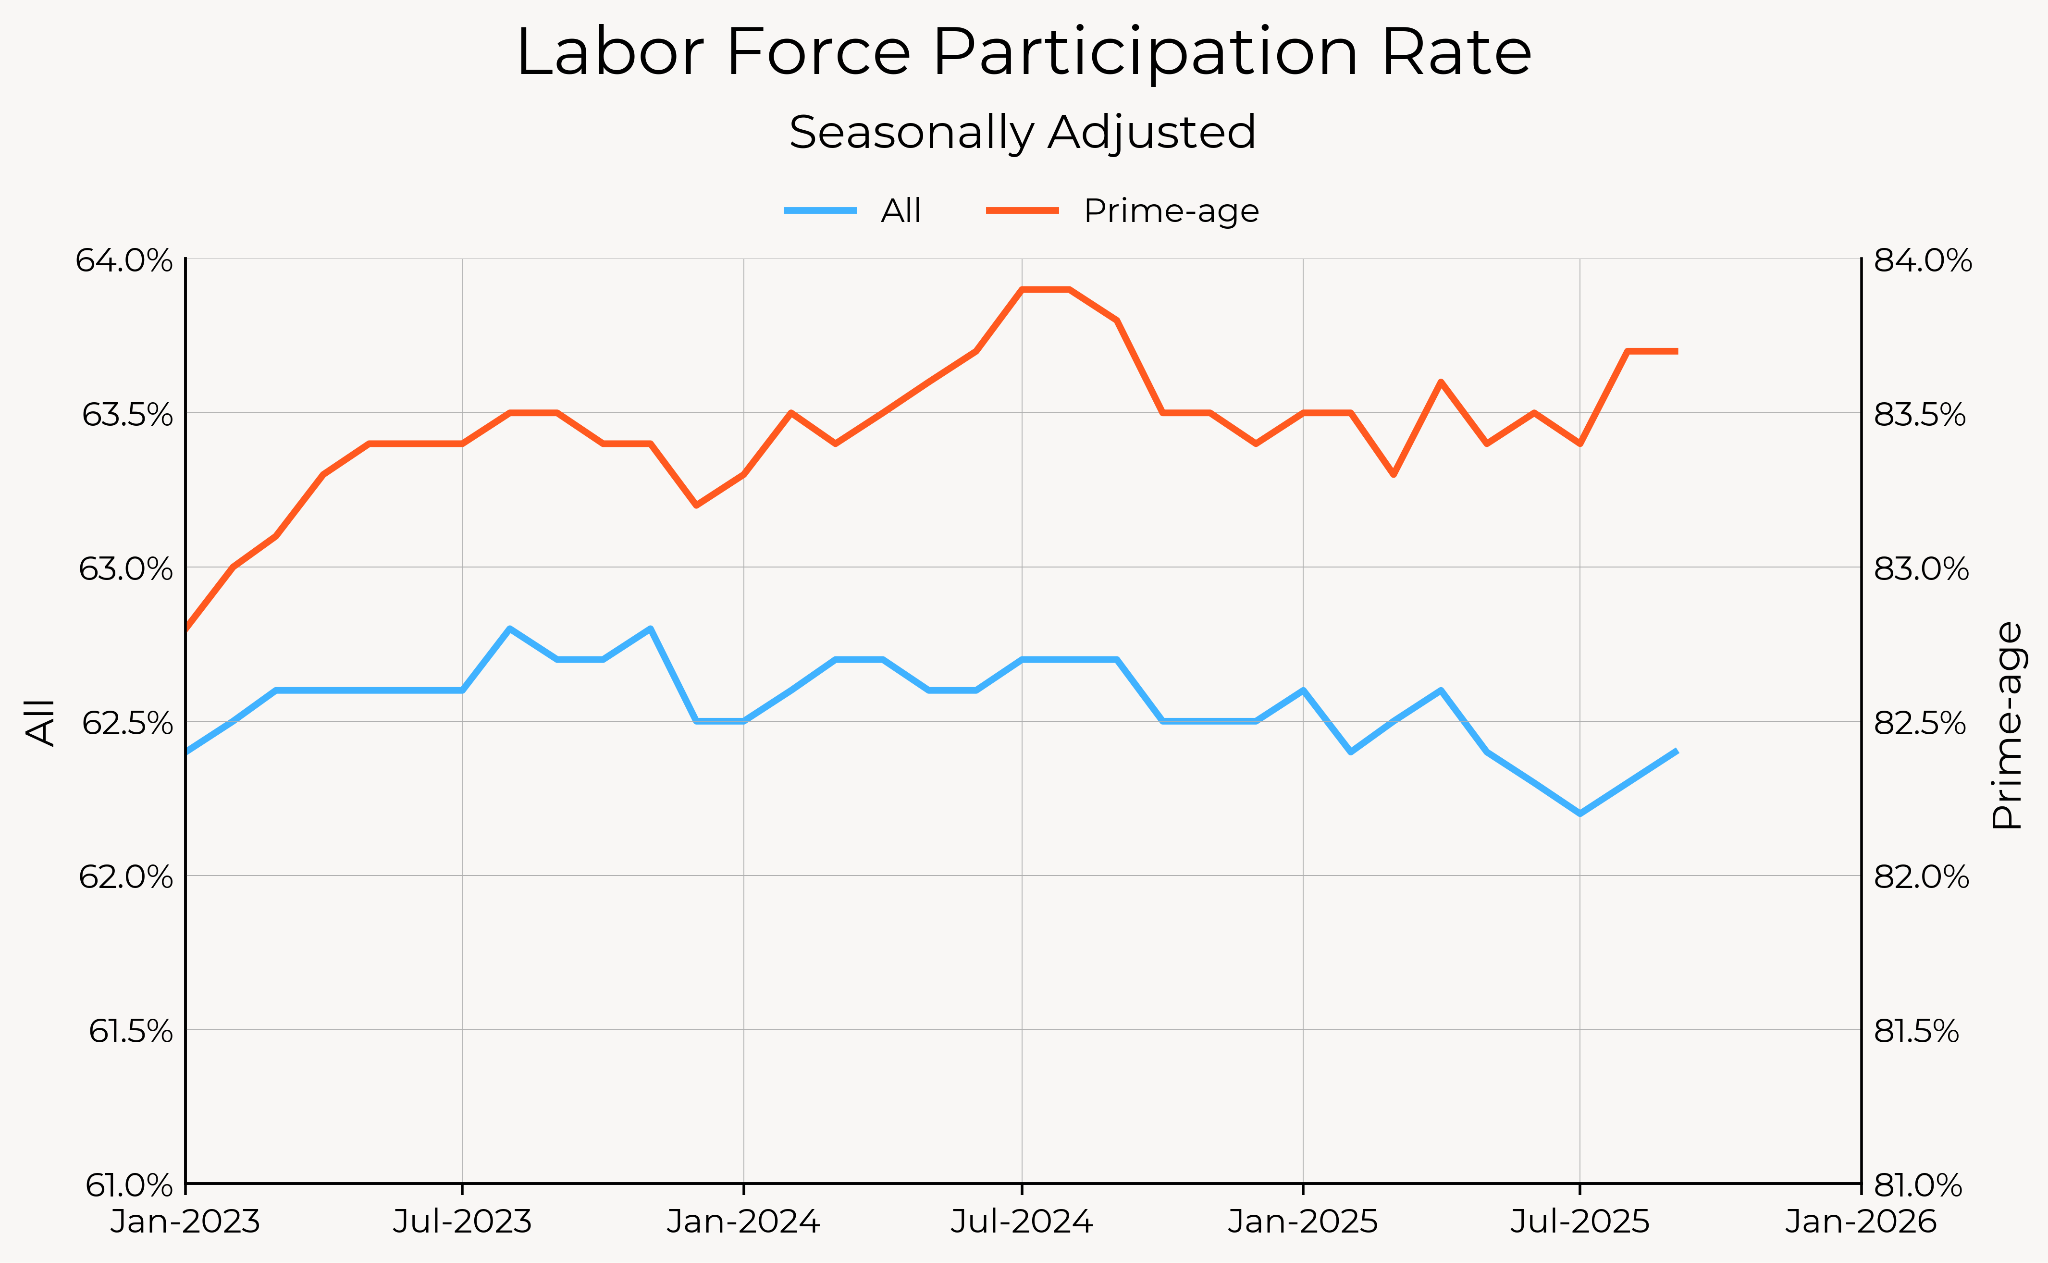
| Participation Rate (Prime-age) | 83.7% | 0.0% | +0.2% | -0.1% | +1.2% |
| Payroll Growth (3-month avg., thous.) | Current | 1M Ago | 3M Ago | 12M Ago | 2019 Avg |
| Total Nonfarm | 62 | +44 | +8 | -71 | -104 |
| Total Private | 57 | +41 | -1 | -37 | -91 |
| Government | 5 | +3 | +9 | -34 | -12 |
| Cyclical | -32 | +15 | -6 | -25 | -77 |
| Acyclical | 95 | +29 | +14 | -45 | -26 |
| Wage Growth | Current | 1M Ago | 3M Ago | 12M Ago | 2019 Avg |
| Average Hourly Earnings (3m/3m) | 4.0% | +0.3% | +0.7% | +0.1% | +0.8% |
| ECI Total Comp. (3-month) | 3.8% | N/A | +0.2% | +0.4% | +1.1% |
| Atl. Fed. Median Wage Growth (yoy) | 4.1% | 0.0% | -0.2% | -0.5% | +0.4% |
| Indeed Postings Wage Growth (yoy) | 2.4% | -0.2% | -0.1% | -1.1% | -0.9% |
| JOLTS | Current | 1M Ago | 3M Ago | 12M Ago | 2019 Avg |
| Hiring Rate | 3.2% | -0.1% | -0.2% | -0.1% | -0.7% |
| Quit Rate | 1.9% | -0.1% | -0.1% | -0.1% | -0.4% |
| Layoff Rate | 1.1% | 0.0% | +0.1% | 0.0% | -0.1% |
| Job Openings Rate | 4.3% | 0.0% | -0.3% | -0.3% | -0.2% |
Source: Bureau of Labor Statistics, Author’s Calculations. Red indicates weaker labor market development; green indicates stronger. JOLTS and Atlanta Fed data cover August 2025.
The jobs data this month leave ample room for hawks and doves alike to find support for their narratives. The most worrying sign in the household survey is the unemployment rate, which increased from 4.32% to 4.44%. The unemployment rate is now not far from the 4.5% median projection in the Fed’s September SEP.

Not all angles of the household survey are so dire. The prime-age employment rate held steady, and remains at the upper end of the range it's been fluctuating in for the last year. Participation rates are up in the last couple of months, suggesting that the increase in the unemployment rate since July is due to “good” reasons (higher supply, rather than lower demand).
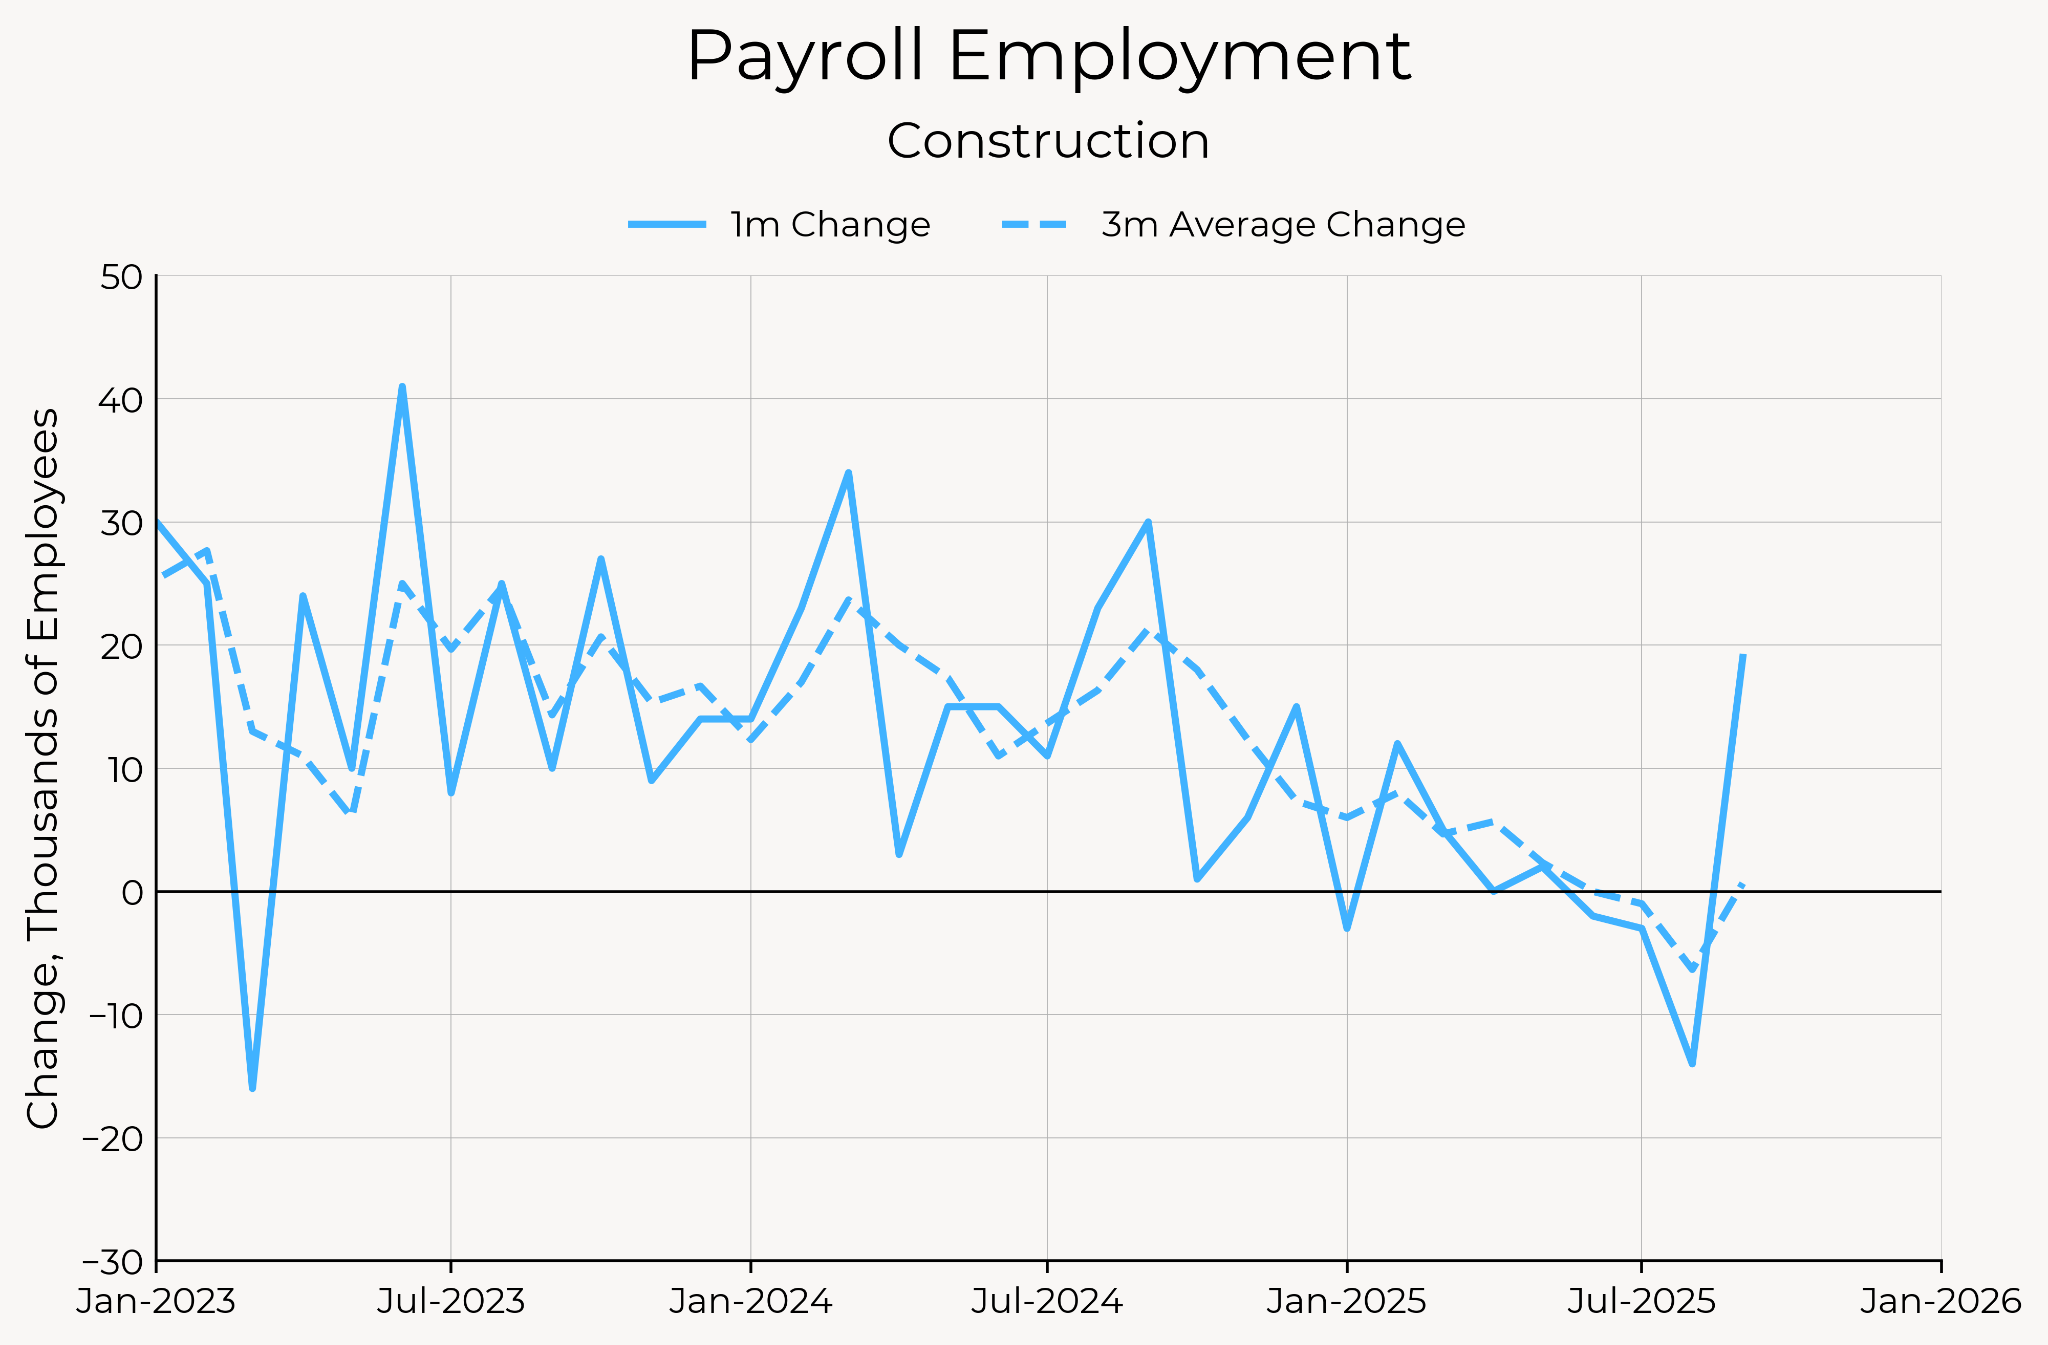
Turning to the payroll numbers, a payroll number of above 100k is certainly impressive, even if it did come with modest downward revision to previous numbers. Average monthly payroll growth over the last three months is around 60,000, solidly within Fed estimates of breakeven employment growth. A large part of the beat in payrolls this month was due to construction employment, a notoriously cyclical employment measure which had been declining.

One key argument from Fed hawks is that breakeven payroll growth has fallen given the decline in net migration this year. That may be the case, but the labor market is not acting like there is only a negative supply shock happening.
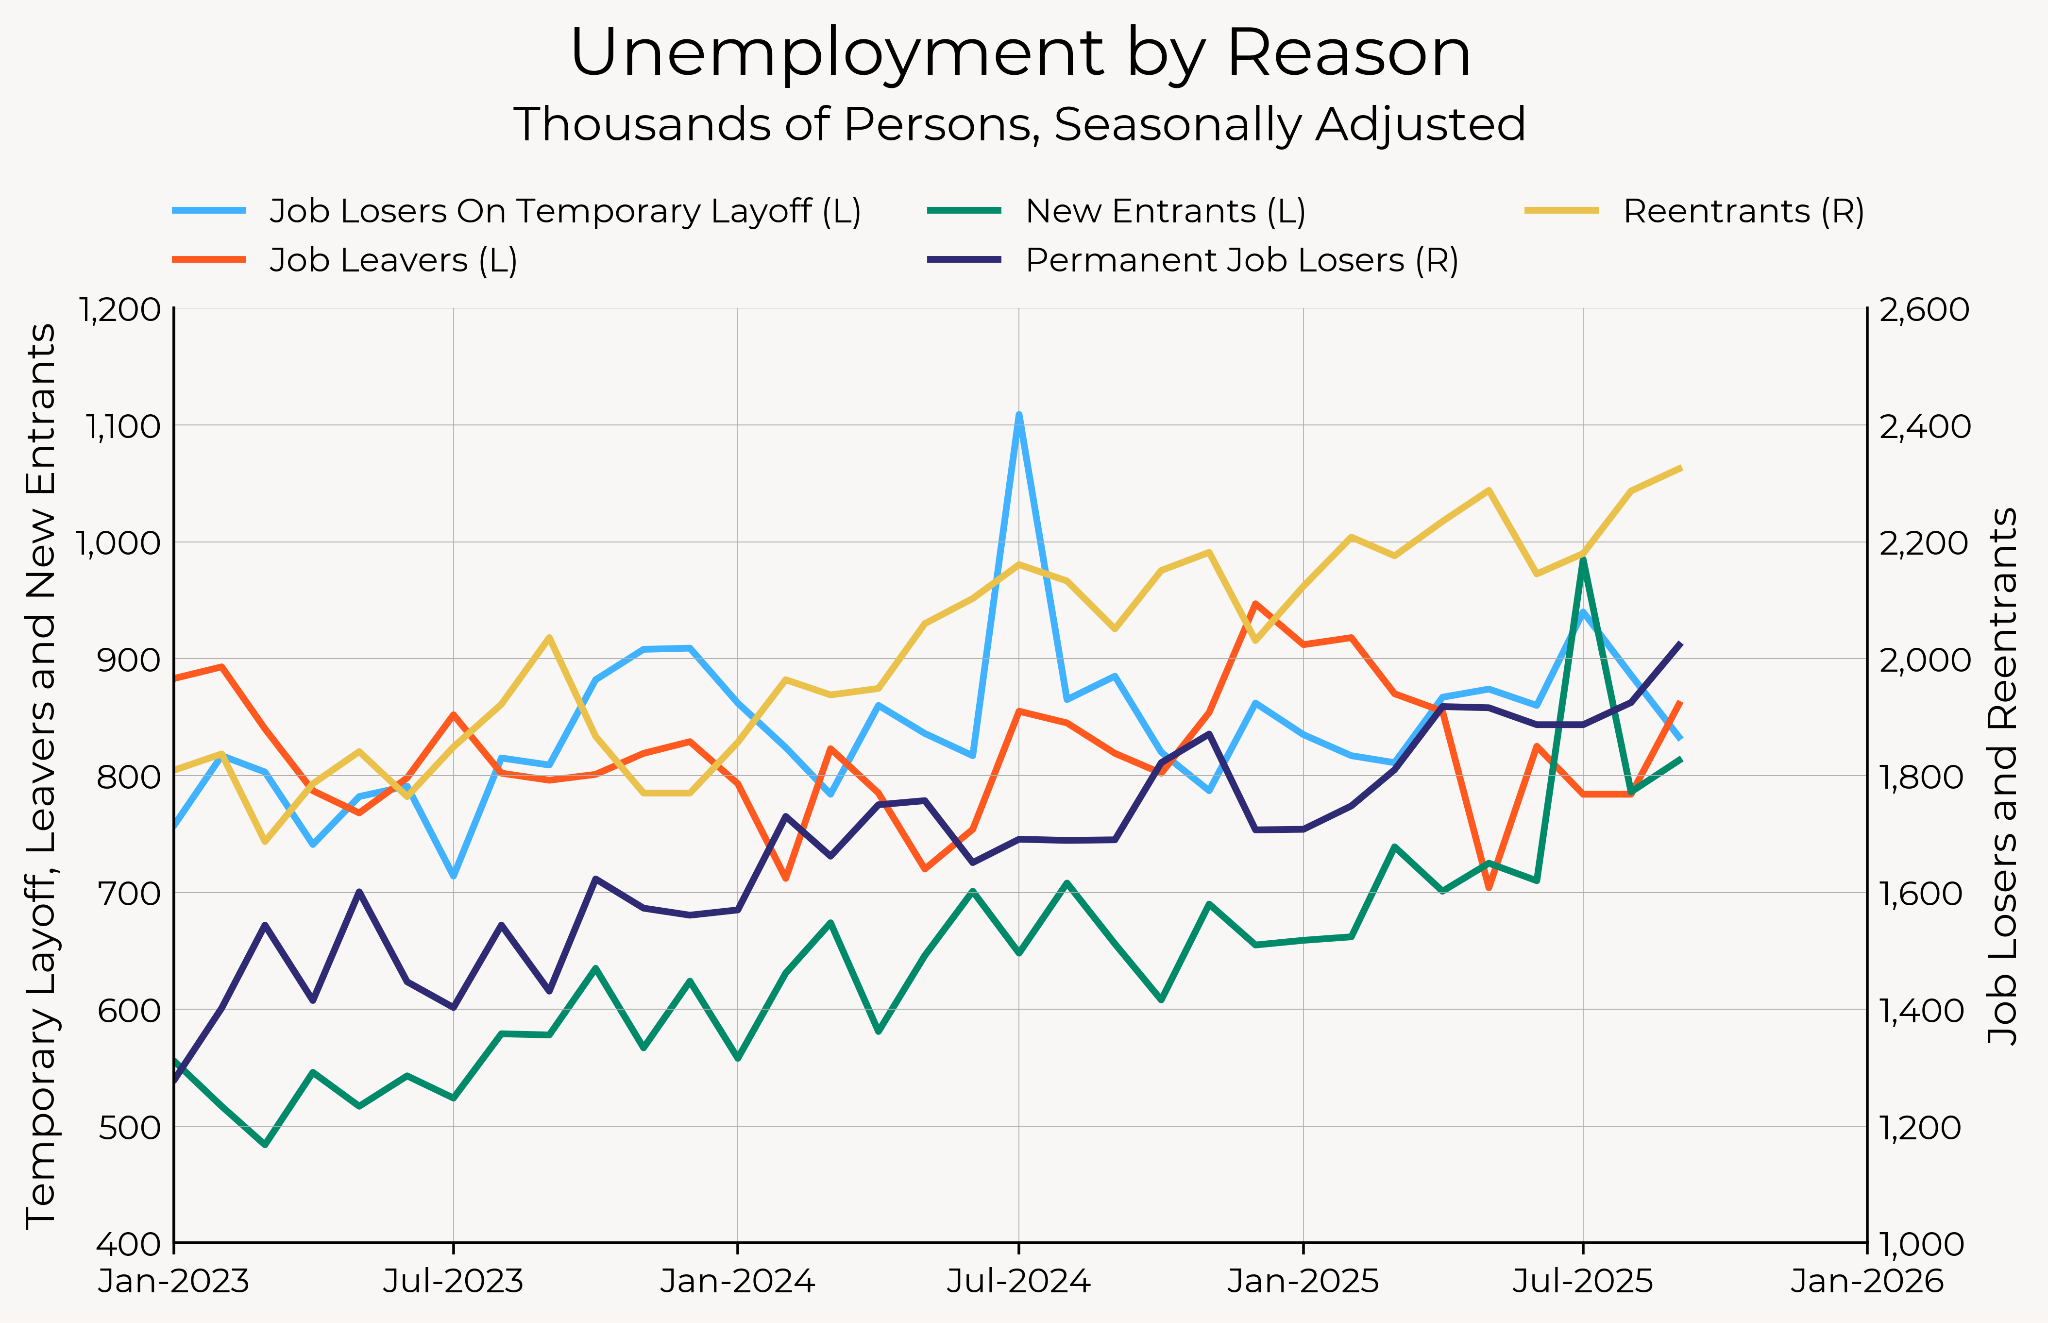
Looking at the composition of unemployed, the number of unemployed new entrants, reentrants, and permanent job losers have been steadily rising this year. That’s the opposite of what one would expect if labor supply were diminishing, but what one would see with lower labor demand. Meanwhile, the number of unemployed job leavers has actually fallen, this year, consistent with workers feeling less comfortable quitting jobs into a low-demand labor market.
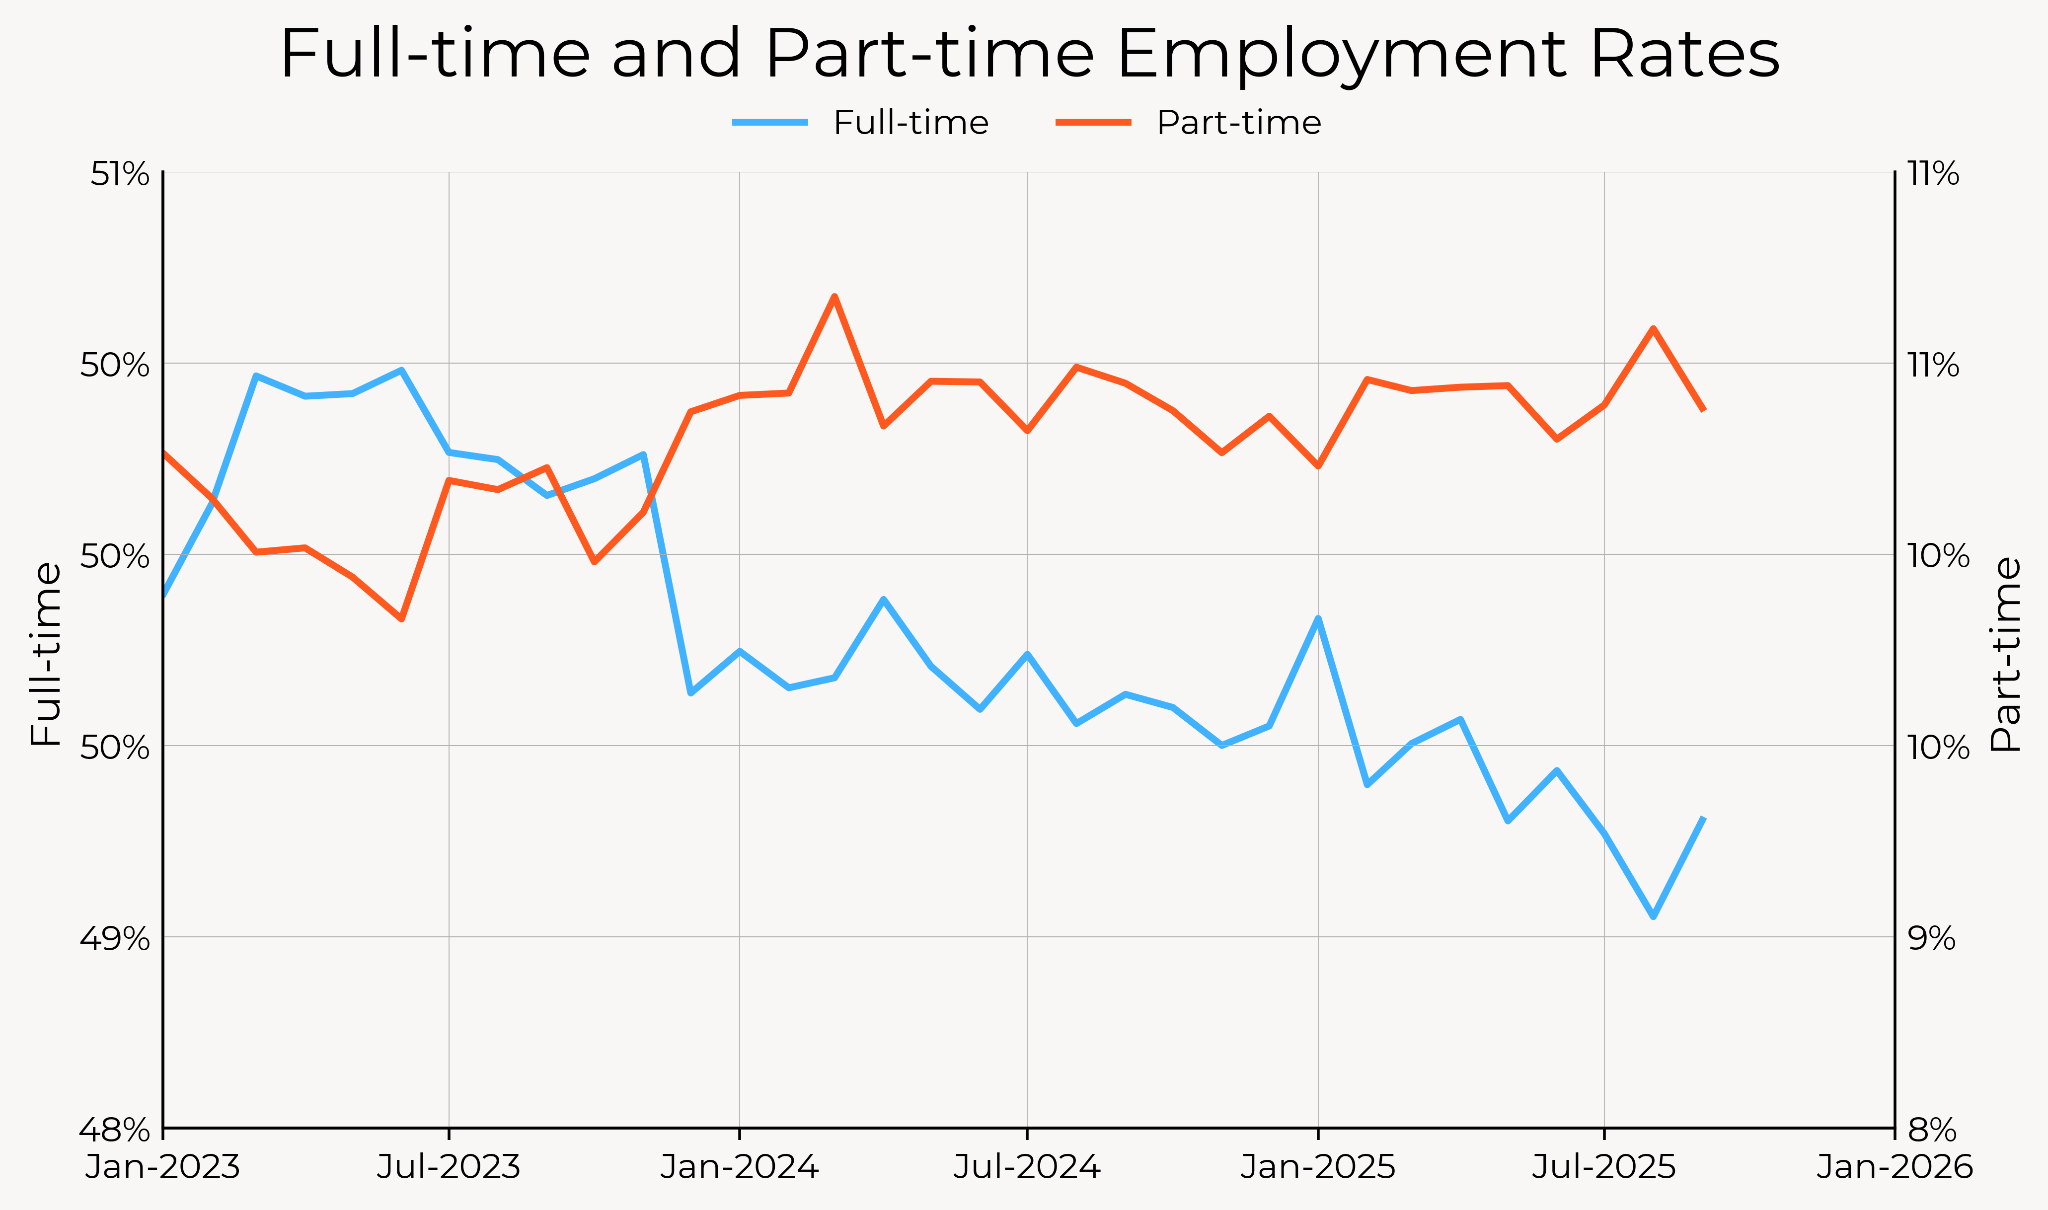
The composition of employment has been steadily trending away from full-time employment. Part-time employment has barely moved, but full-time employment has fallen by over half a percentage point this year.
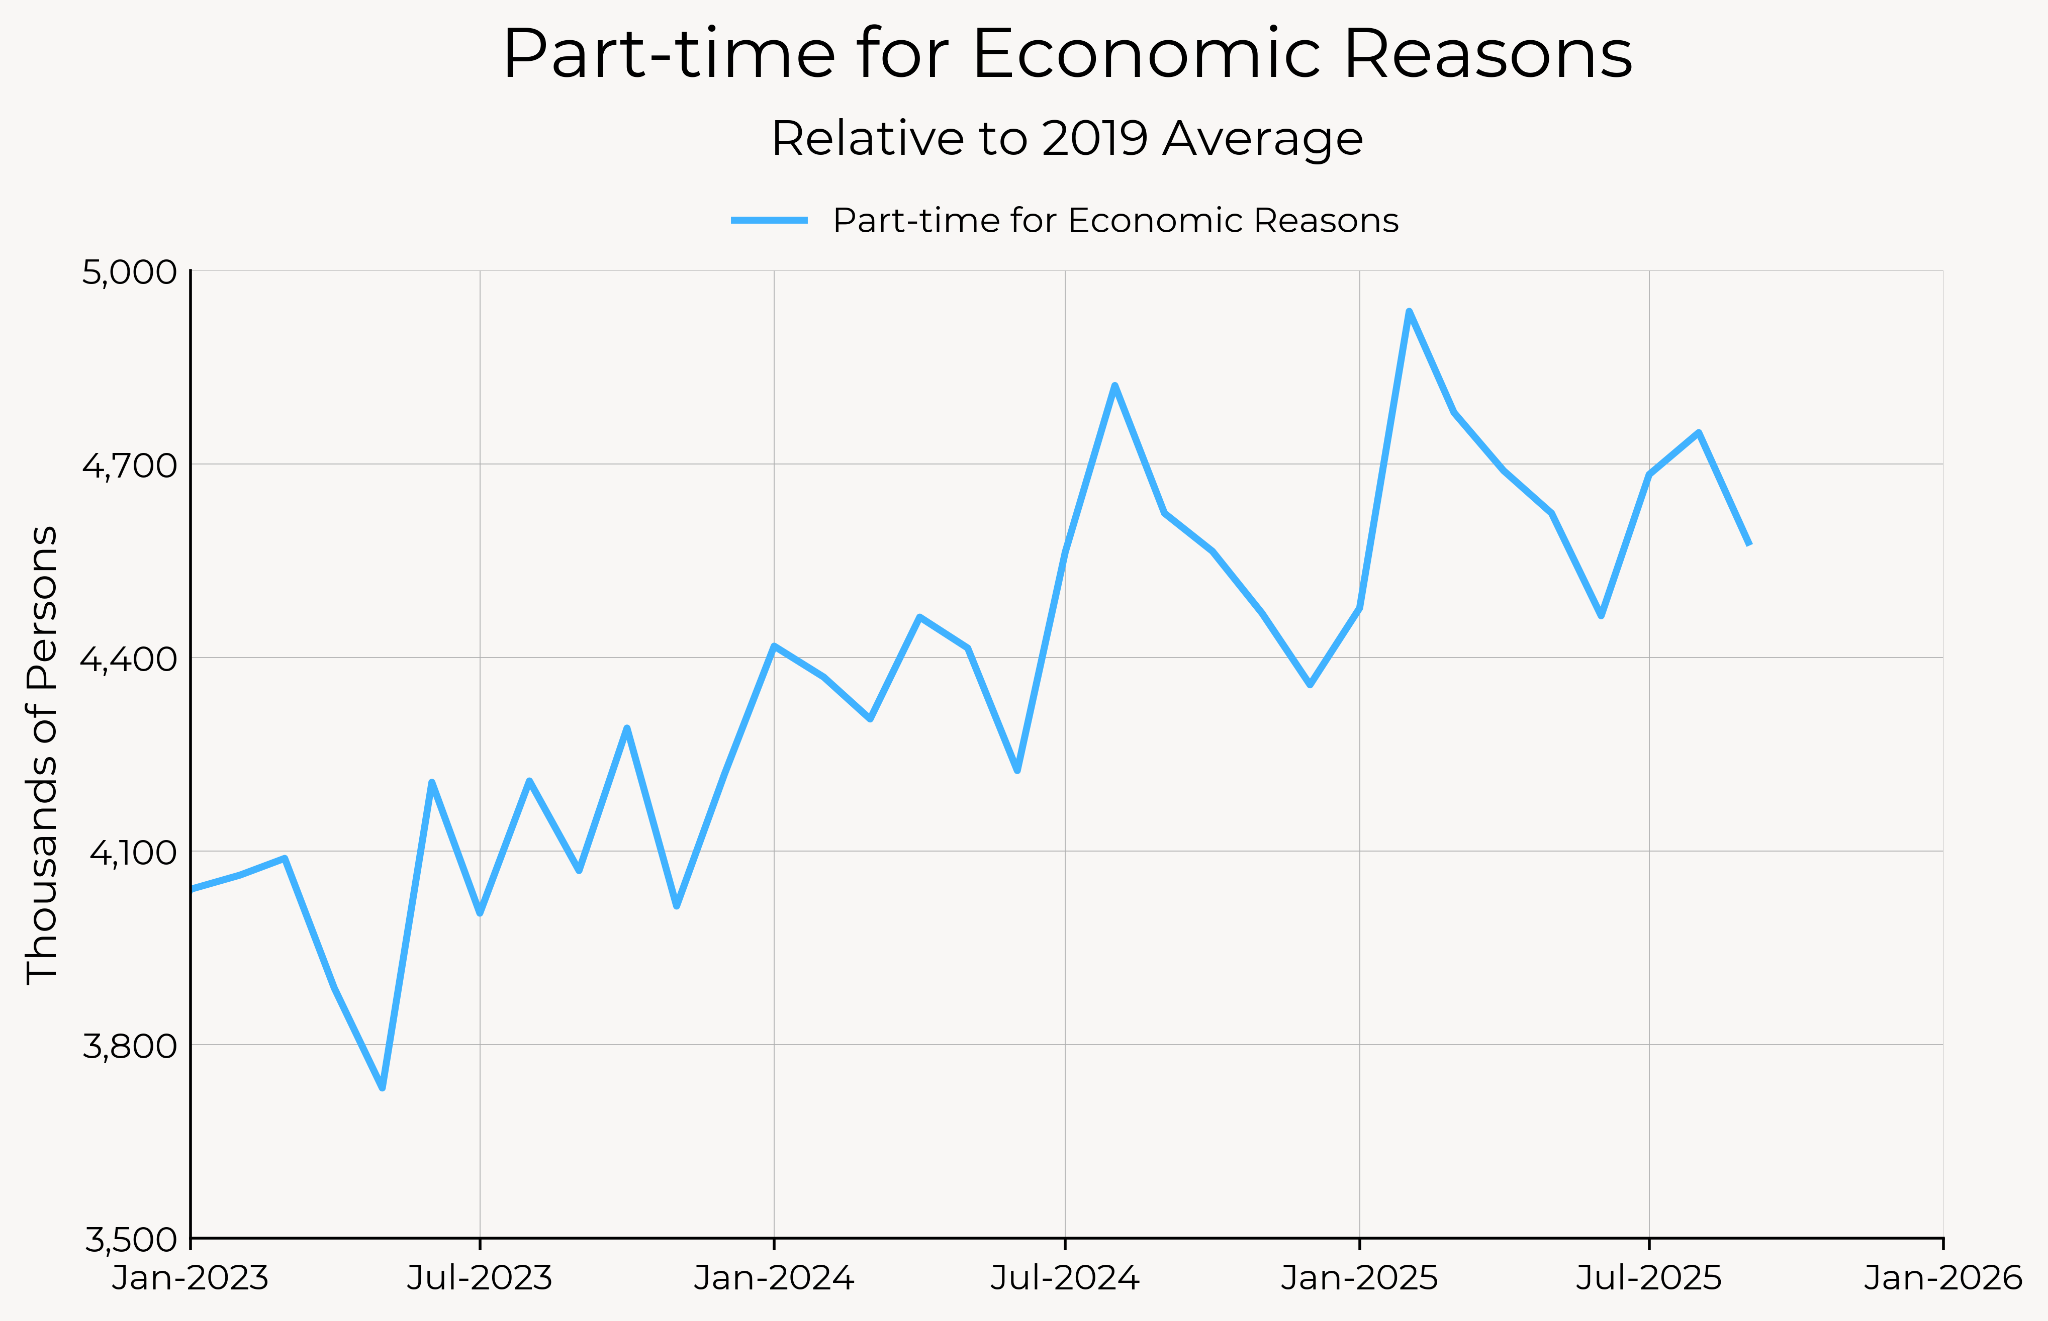
Measures of unemployment numbers this granular are noisy, but there is a clear and steady upwards trend in the number of part-time employees that wanted full-time work but could not due to slack demand.
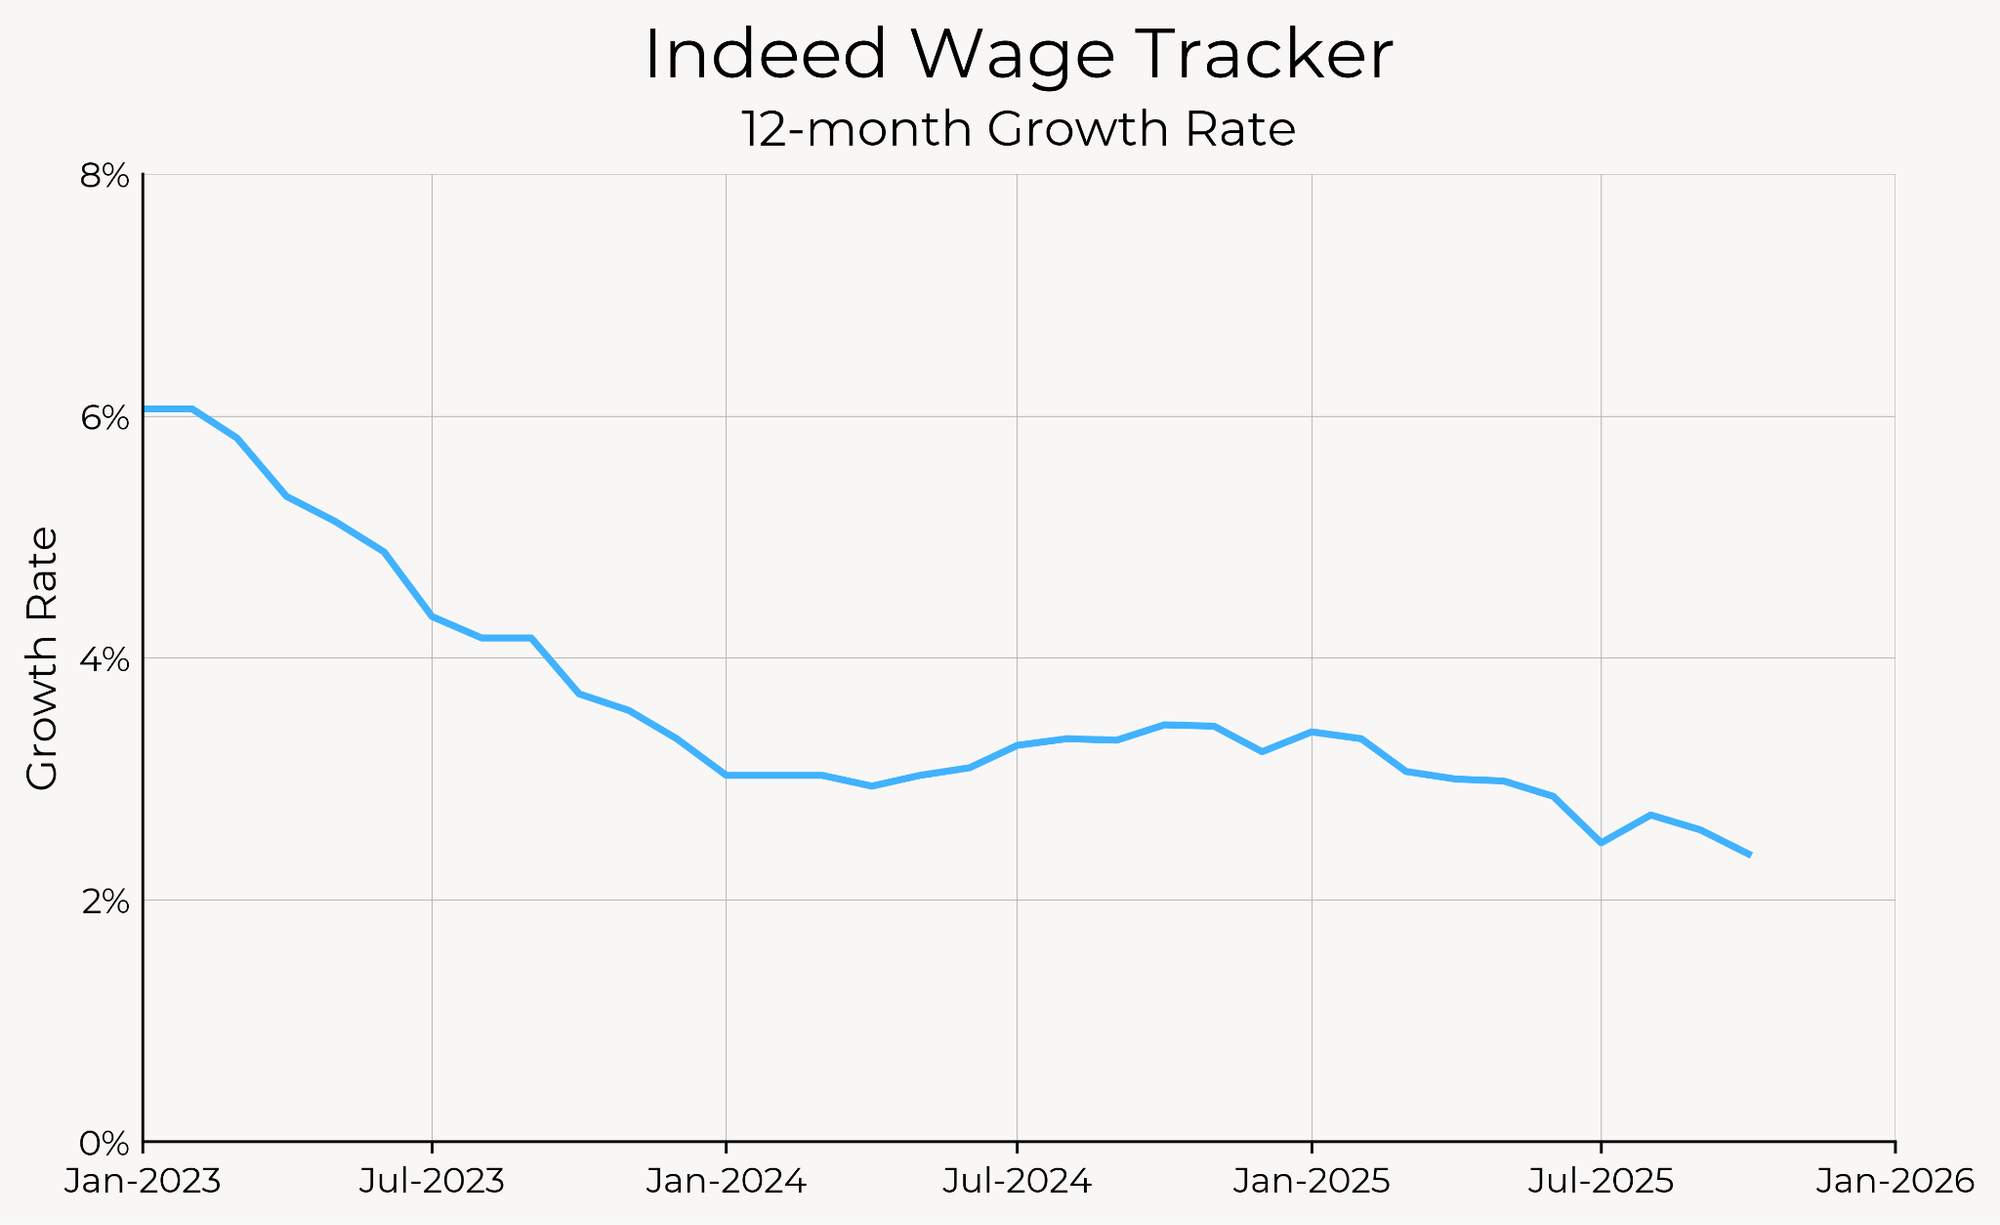
Finally, posted wage growth—a forward-looking indicator of the labor market—continued to decline. The Indeed Wage Tracker for October was released this week, and shows posted wage growth at just 2.4%, its lowest reading in this cycle and well below current and near-term expected rates of inflation.
It may be the case that lower labor supply growth means that breakeven payrolls growth is going to be lower going forward, but there is plenty of corroborating evidence that labor demand is declining just as much as labor supply.
Regardless of what takeaways you have on the September labor market data, it’s already stale. We were supposed to get this data more than 6 weeks ago.
Between now and the next FOMC meeting, we’re going to miss October jobs data, and November jobs data won’t come out until after the meeting. In lieu of employment situation report data, the best available data we have is unemployment claims, which also came out today. Continuing claims rose to a new cycle high, and are about 5% than they were earlier this year. Initial claims remained steady, and show no signs of sharp deterioration.
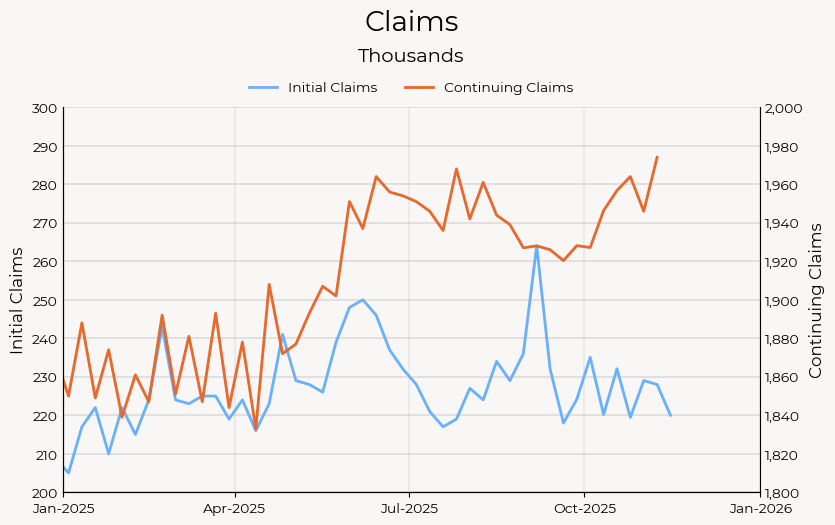
We’re not seeing the feared spike in initial claims from firing (aside from the government shutdown), but the rise in continuing claims points towards a continued slowdown in hiring and the broader labor market. With this data in hand, it’s hard not to see the unemployment rate ending the year at or above 4.5%.
This jobs report puts a December cut back in play—market odds of a cut rose approximately ten percentage points, to 40%. The rise in the unemployment rate is going to bolster the case of Doves like Waller: if the unemployment rate was already 4.44% in September, it’s likely to be above 4.5% in December.
However, there’s enough in this report that the hawks will still feel comfortable holding. Strong payroll growth and high employment rates are likely to keep members like Hammack, Schmid and Bostic convinced that the weakening in the labor market is insufficient to warrant another cut this year. Just after the release of today’s data, Beth Hammack reiterated her view that monetary policy is “barely” restrictive.
The question is whether the core of the Committee—including Powell, Williams, Jefferson—will be worried about the increase in the unemployment rate. Given the lack of data between now and the next meeting, unemployment claims and soft data may determine the tiebreak.