“The modest aggregate job numbers can't be far from the true break-even point or else the unemployment rate would have been rising. That's basically the definition of what the break-even point is." Austan Goolsbee, 2/24/26
Non-farm payrolls (NFP) employment has increased by an average of just 22,000 a month over the last twelve months, after increasing by an average of over 100,000 a month in 2024 (in the current release). And yet, the prime-age (25-54) employment rate, at 80.7% in March 2026, is exactly where it averaged in 2024. Labor supply is simply growing more slowly due to the ongoing aging of the population and a historic decline in immigration, requiring fewer jobs to maintain unemployment and employment rates. But real-time data on immigration is hard to come by, and interpreting non-farm payrolls growth is difficult when labor supply is changing so much.
There’s been a number of recent Fed research notes that use estimates of immigration and population trends to derive estimates of breakeven employment growth (e.g. Murray and Vidangos, 2026; Bick, 2026, and Cheremukhin, Wilson and Zhou, 2026). FOMC members are certainly paying attention, with St. Louis Fed President Alberto Musalem and San Francisco President Mary Daly citing this research, which finds that breakeven employment growth has fallen to near-zero. In his last press conference, Fed Chair Jay Powell said “you can say the breakeven [rate of jobs growth] is zero.”
In this note, we take another approach to estimating (a version of) the breakeven NFP growth rate by taking Goolsbee’s remark above seriously. What rate of growth in NFP would be required to keep employment rates steady, based on the actual observed evolution of both NFP and employment in the CPS?
The methodology is fairly straightforward (we provide a more precise write-up at the end of this post). We take 12-month non-farm payrolls growth rate and rewrite it as the sum of:
Growth in CPS total employment, which is further decomposed into:
Growth in employment rates at the demographic group level, holding population levels constant; that is, increases in employment that come from increases in employment rates within demographic groups, not changes in the population of those groups;
Growth in population at the demographic group level, holding employment rates constant;
An adjustment for changes in rates of multiple jobholders, self-employed, furloughed workers, and other definitional differences between CPS and CES employment;
A term that captures all other changes that affect the difference between CPS and CES employment, such as sampling error, job-switching, issues with the birth-death model, etc.
Then, we take actual growth in NFP employment and net out the CPS measurements of (1)(a) and (2). What’s left is the growth in NFP required to keep up with (1)(b), demographic changes, and (3), changes in any remaining errors, keeping employment rates at the demographic group level the same.
Let's call this the Constant-Employment-Rate NFP series, or CER-NFP for short, to differentiate it from other breakeven NFP estimates. It is the implied path of NFP required to keep the employment-population ratio steady over the past 12 months (net of any changes in the adjustment term that changes in multiple jobholding, etc.). Importantly, (1)(a) relies on group-level employment-population ratios in the CPS, not raw employment counts which are more susceptible to issues with estimating population growth. It is also important to use group-level employment-population ratios, rather than a single overall employment-population ratio, because the employment-population ratio has resumed its steady, secular decline that is the result of the aging of the population.
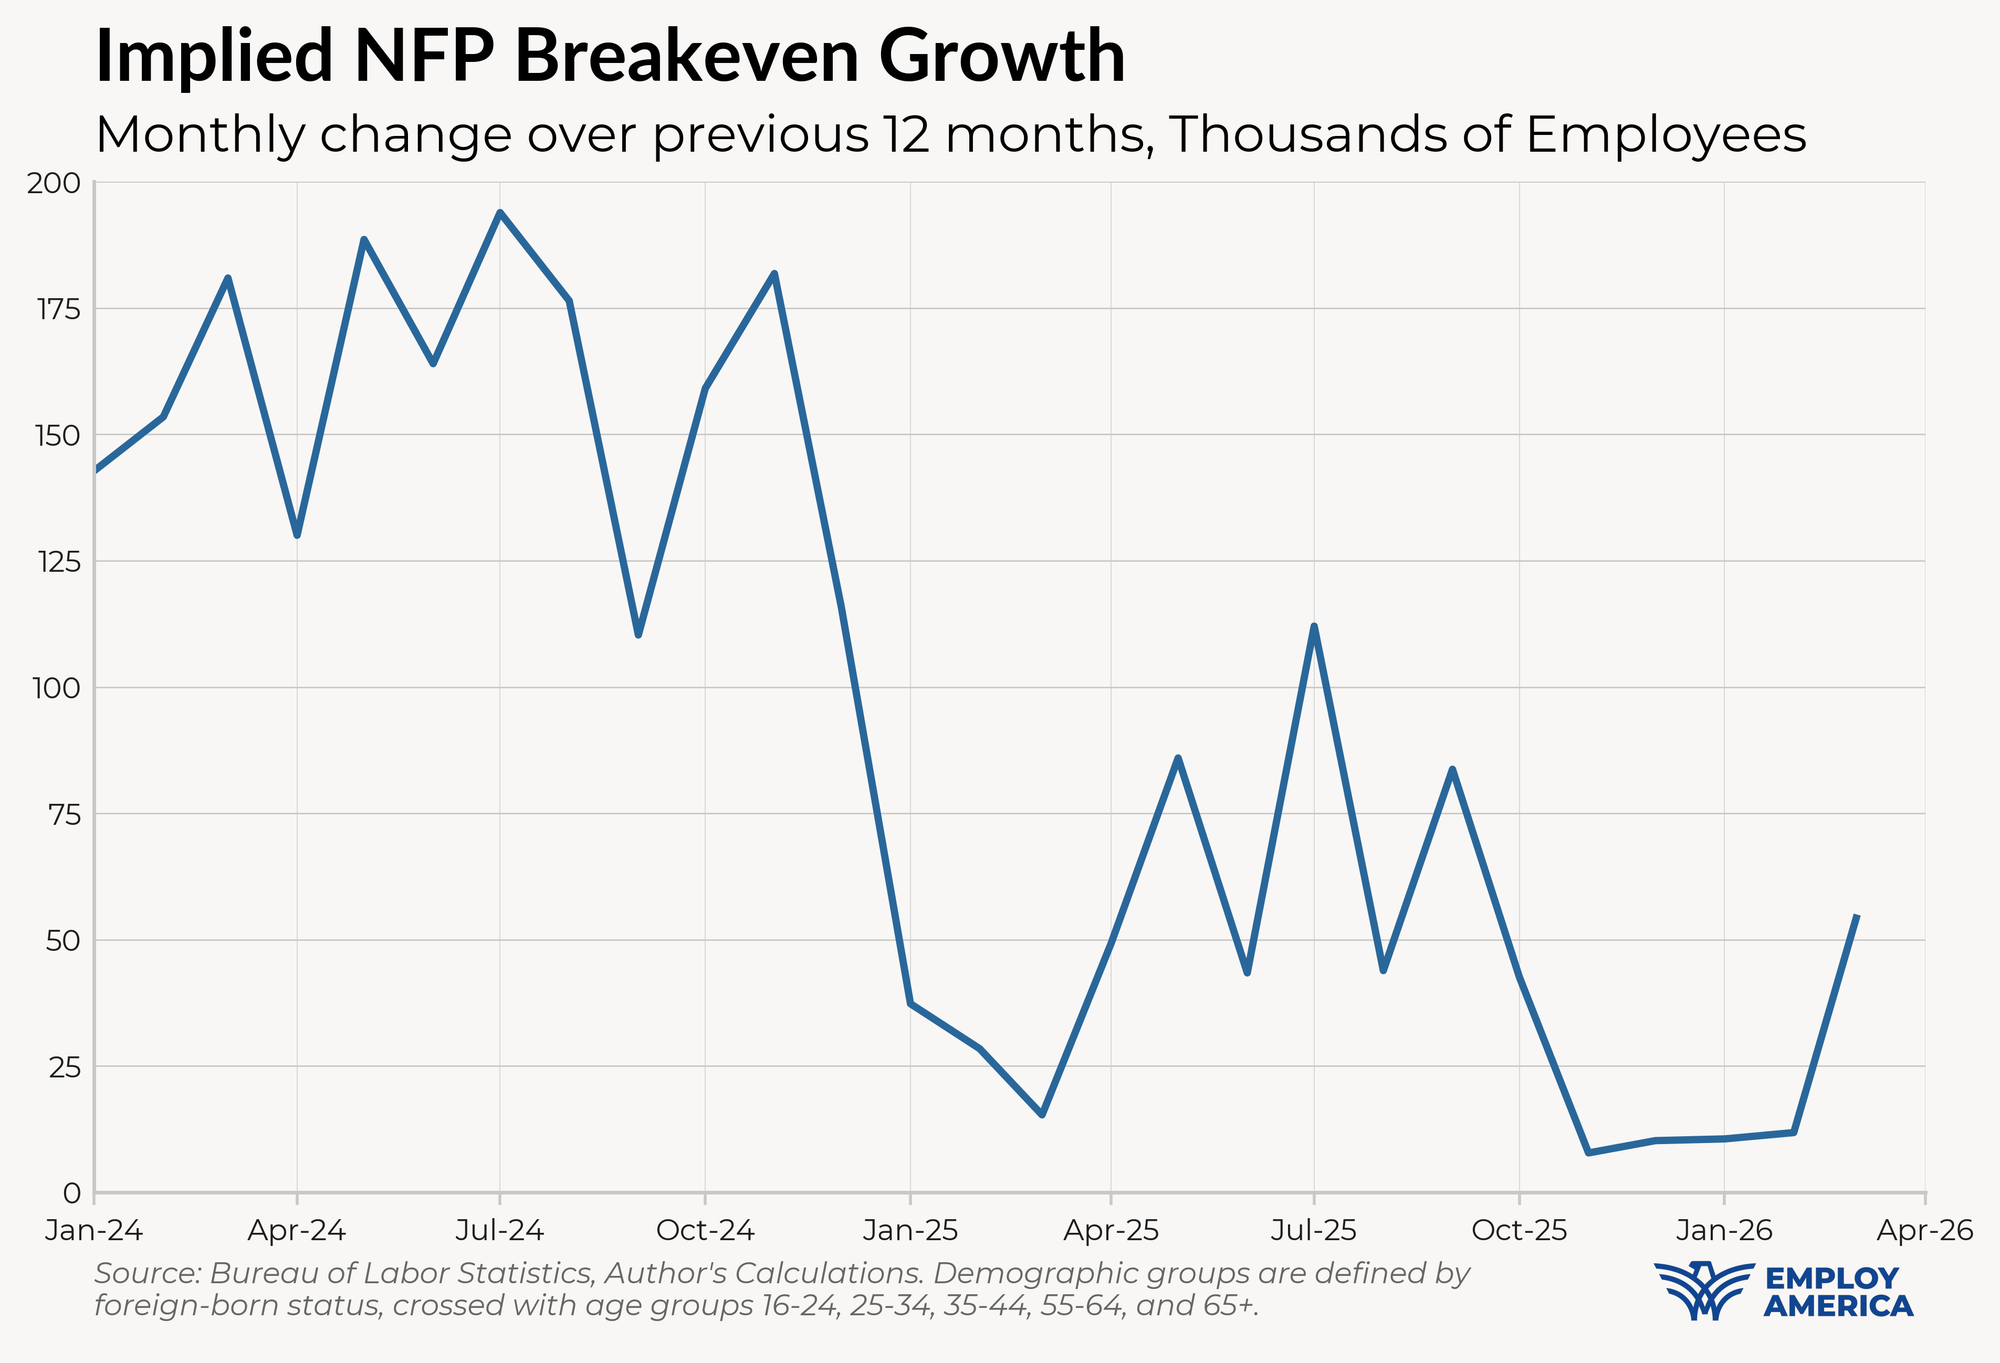
We plot the growth rate of CER-NFP below. The monthly growth in CER-NFP was solidly in the range of 100,000 to 200,000 jobs a month up until 2025, when it dropped to below 100,000. The CER-NFP growth rate fell to around 10,000 jobs a month late last year.
In short, the observed decline in the growth of NFP employment, combined with the relative stability of employment rates in the household survey, is telling us that the breakeven rate of NFP employment growth has fallen substantially since 2024.
In CER-NFP, we netted out both the weighted growth rate of employment-population ratios as well as adjustments for changes in rates of multiple jobholders and other employment measures that may be counted in one survey but not the other. It turns out that those differences matter to the breakeven rate.
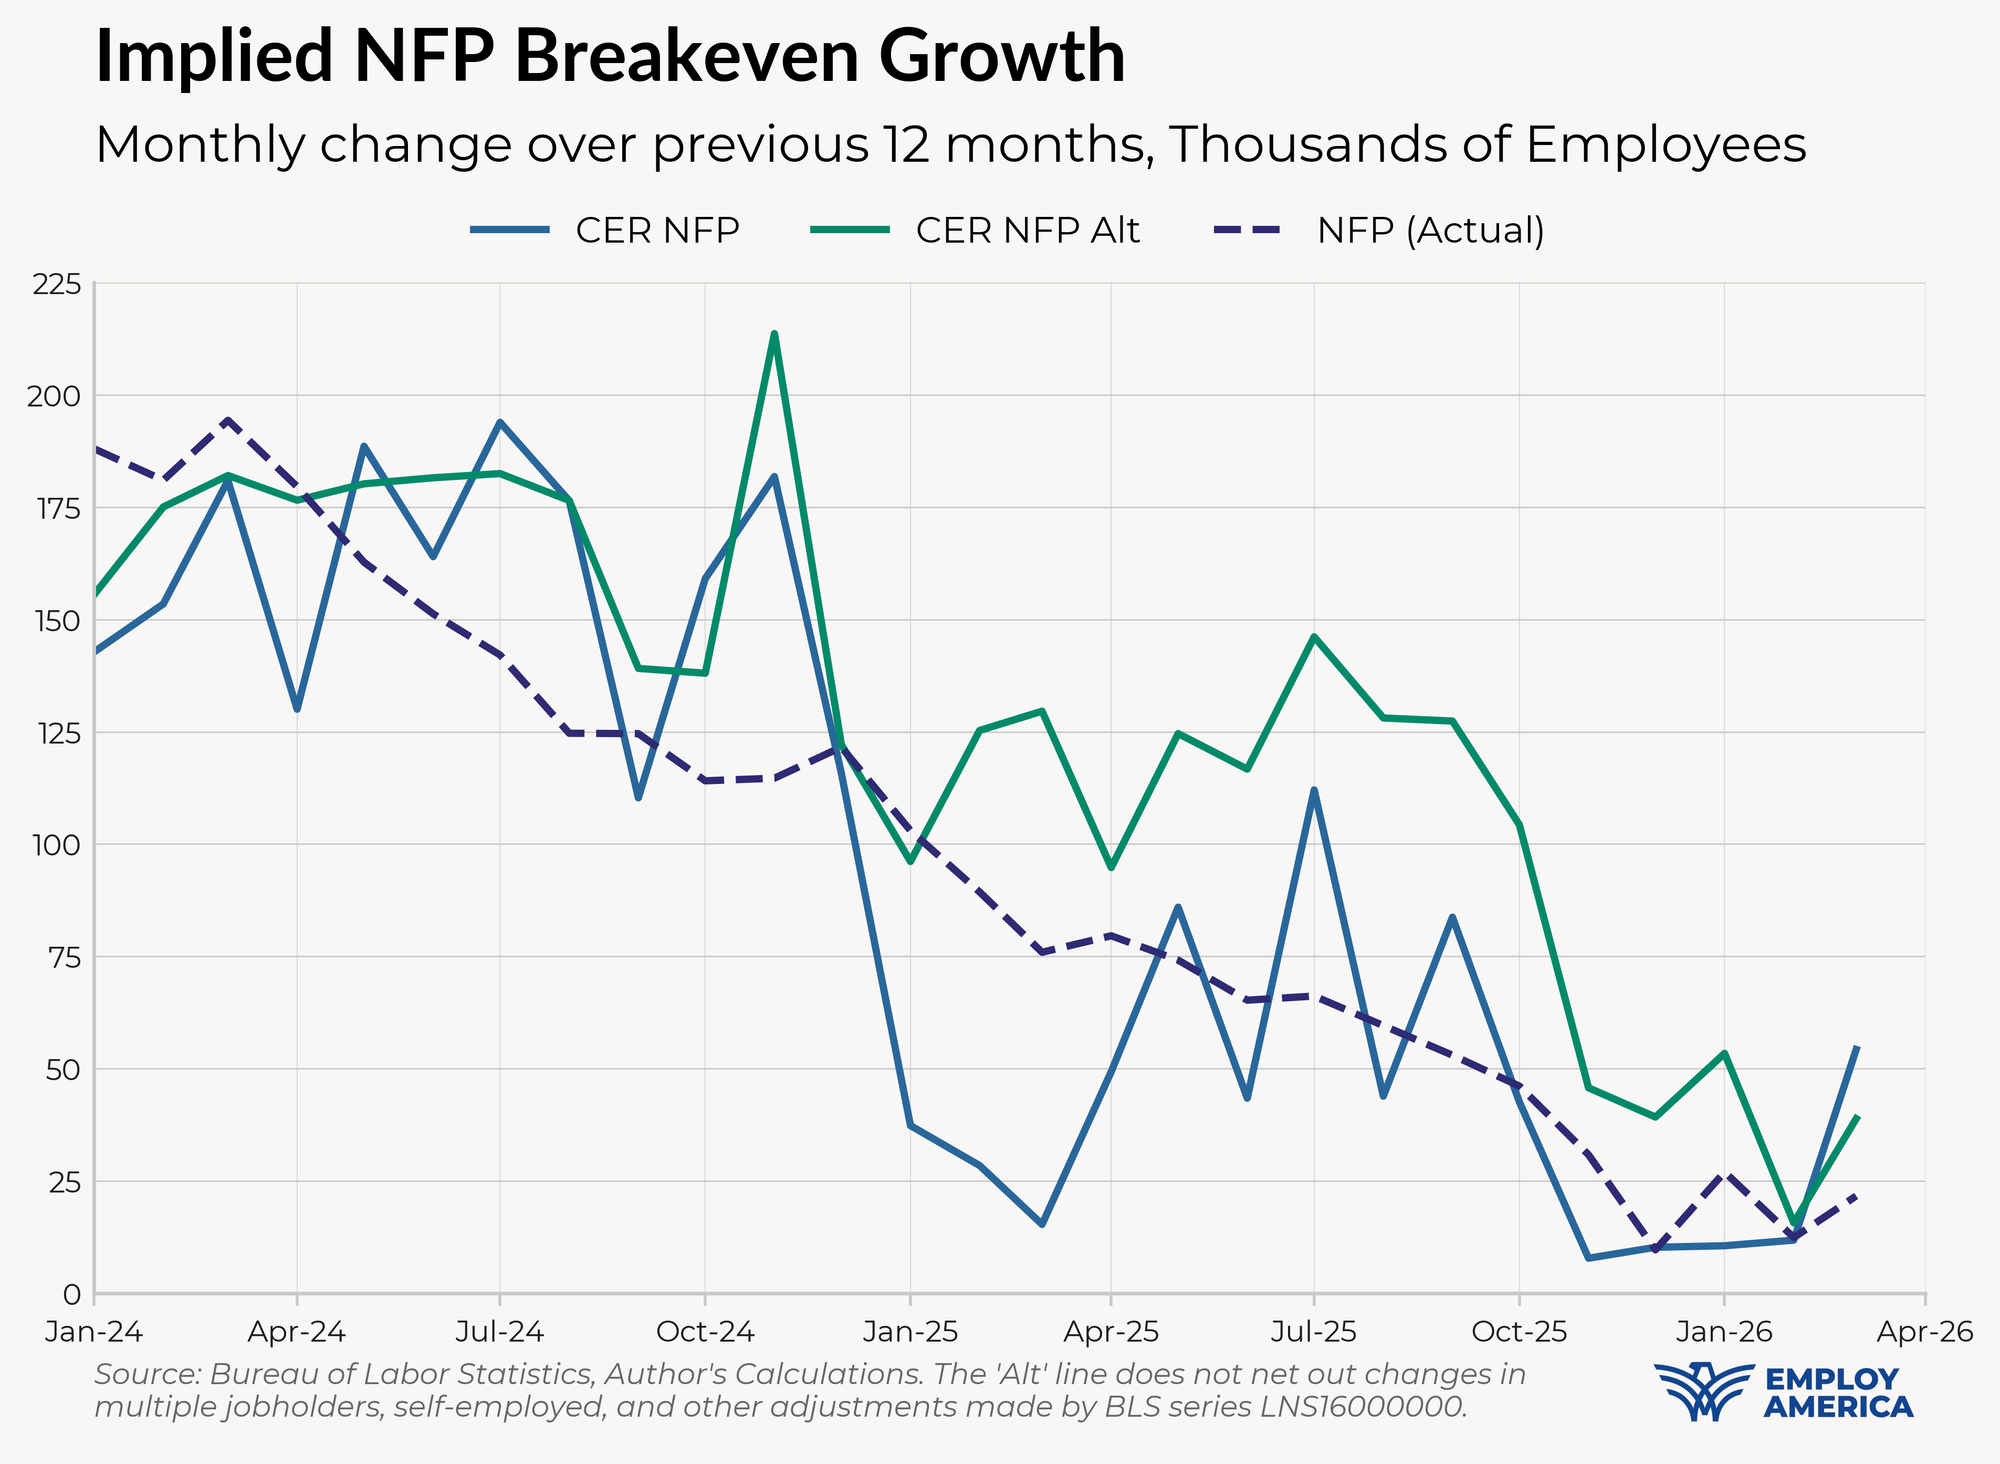
Below, we plot a version of CER-NFP that only nets out the group-level employment-population ratio growth rates from NFP growth, thus allowing changes in those definitional differences to affect the breakeven rate. One can think of this series as answering the question: “what level of NFP growth is necessary to maintain employment-population ratios by keeping up with both population growth and changes in trends in multiple job-holders, self-employed, etc.?”
Actual NFP growth was actually undershooting breakeven growth during much of 2025 under this definition—NFP growth was sufficient to keep up with population growth, but not with an increase in multiple jobholders that occurred in 2025. In any case, both measures have fallen to near-zero in recent months.
The CER-NFP measures we’ve constructed here are by construction backwards-looking, and we can’t say definitively that the decline in CER-NFP growth is attributable to demographic changes alone, since it includes other things. However, the stark decline in the CER-NFP growth rate that we've calculated is similar to that of other estimates of the breakeven growth rate that use more direct measurements of population growth. If those factors persist in the future, we may need to recalibrate our expectations of what a “good” NFP print looks like downwards, perhaps even close to zero.
Alternatively—as we have for a long time—we can put more weight on ratio measures from the household survey like the unemployment rate and employment-to-population ratios. That’s how the Fed is reading the labor market now, and that’s how we’re reading it.