What "Reported Quarterly Growth" Estimates Told Us About The July Jobs Report

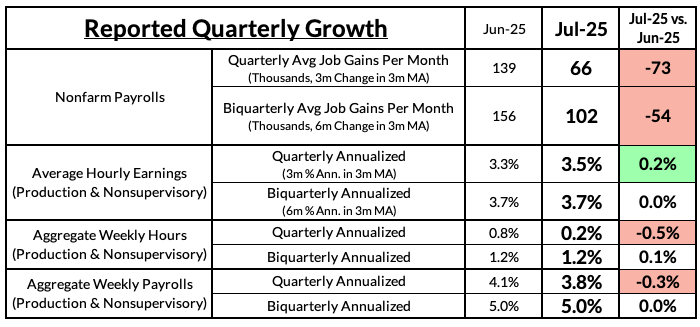
As discussed earlier, on a 1- and 2-quarter Reported Quarterly Growth (RQG), job growth has shifted down markedly from June to July. Following the June Report, nonfarm payroll employment was growing at a 1-quarter pace of 139,000 jobs per month. With the benefit of the July data and the downward revisions to June and May, the July Report now shows a downshift in the 1-quarter pace to just 66,000 per month, less than half the June 1-Quarter RQG.
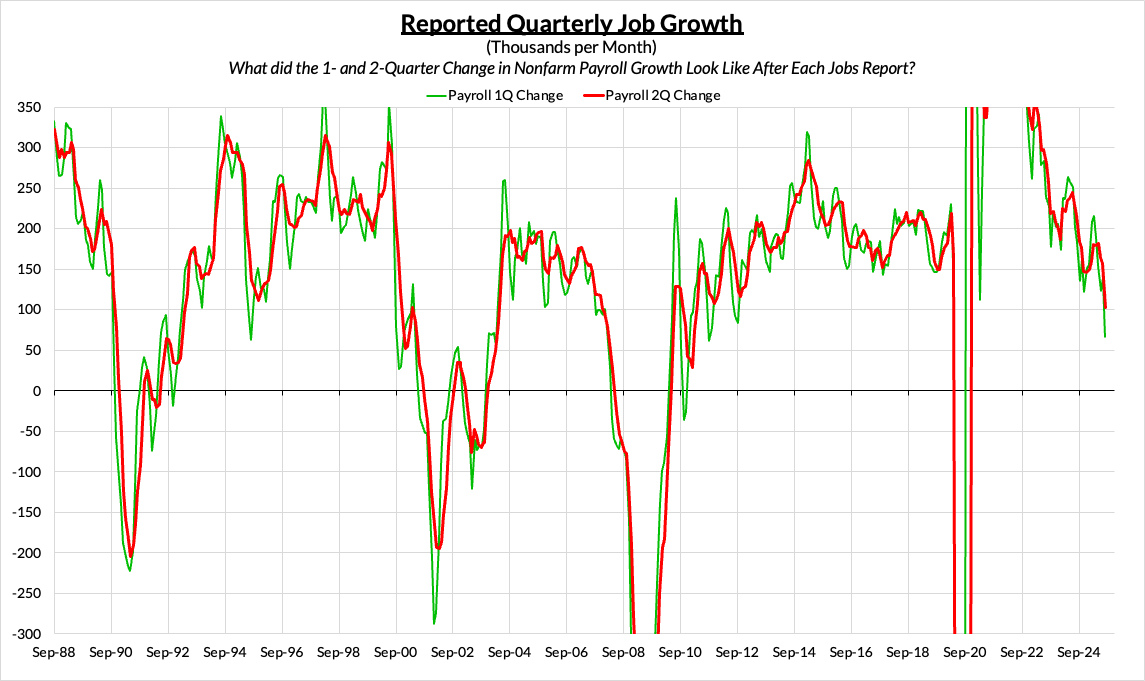
2-quarter RQG tends to be more stable month-to-month, with each monthly shift reflecting more signal and less noise. Yet even on this smoother metric, the pace of job gains shifted down from an observed 156,000 jobs added per month in the June Report to just 102,000 jobs added per month in the July report. What looked to be steadier growth now looks like a decisive slowdown.
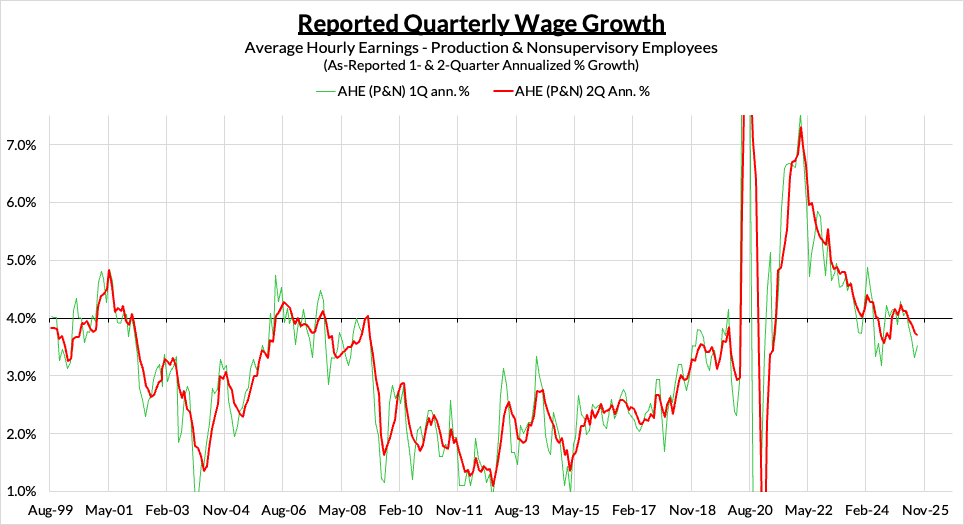
Average hourly earnings are the key wage indicator in the Establishment Survey, and for the benefit of ensuring a representative and long historical lookback, it helps to focus on production and nonsupervisory (rank-and-file) workers. RQG on a 1-quarter comparison is volatile, but ticked up from a 3.3% annualized growth rate to a 3.5% annualized growth rate. The 2-quarter RQG comparison is far steadier, staying right around 3.7% annualized wage growth.
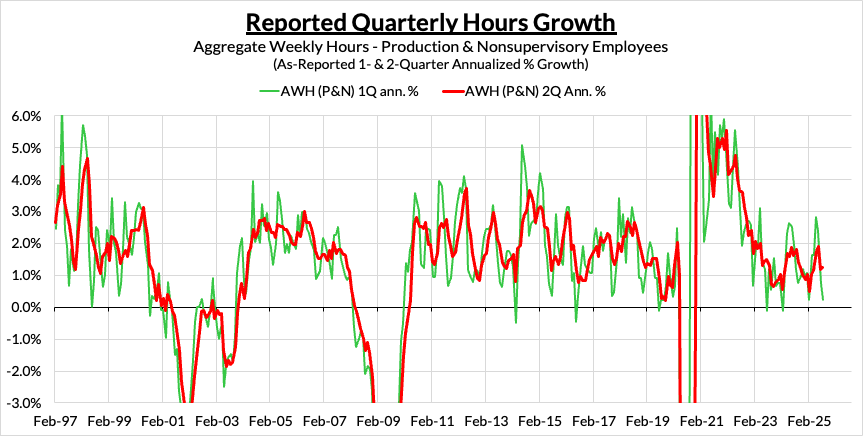
RQG for total hours worked among rank-and-file workers was better than what the latest revisions of the nonfarm payrolls data implied. 1-quarter comparisons fell from 0.8% to 0.2% on an annualized basis, but these estimates are more volatile than the 1-quarter comparisons of nonfarm payroll employment. 2-quarter comparisons are better attuned to the volatility of growth in hours worked, and by that standard, we haven’t seen much change from the June Report to the July Report, which stands at a more respectable 1.2% annualized growth rate.
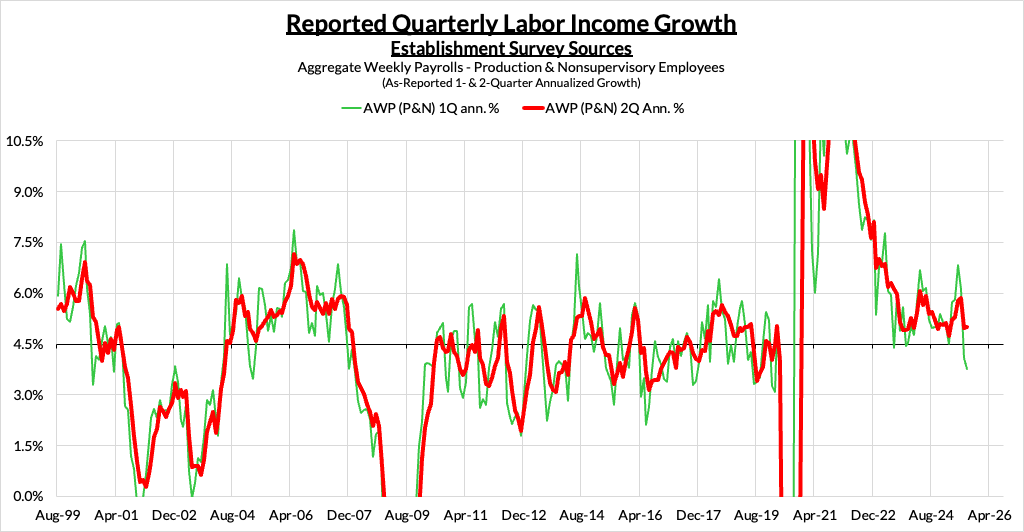
As a result of relatively stable hours and wage growth, aggregate weekly payrolls growth among rank-and-file workers has stayed surprisingly stable. On a 1-quarter basis, RQG fell from 4.1% in the June report to 3.8% in the July report, but on a 2-quarter basis, looks steady right around 5%.
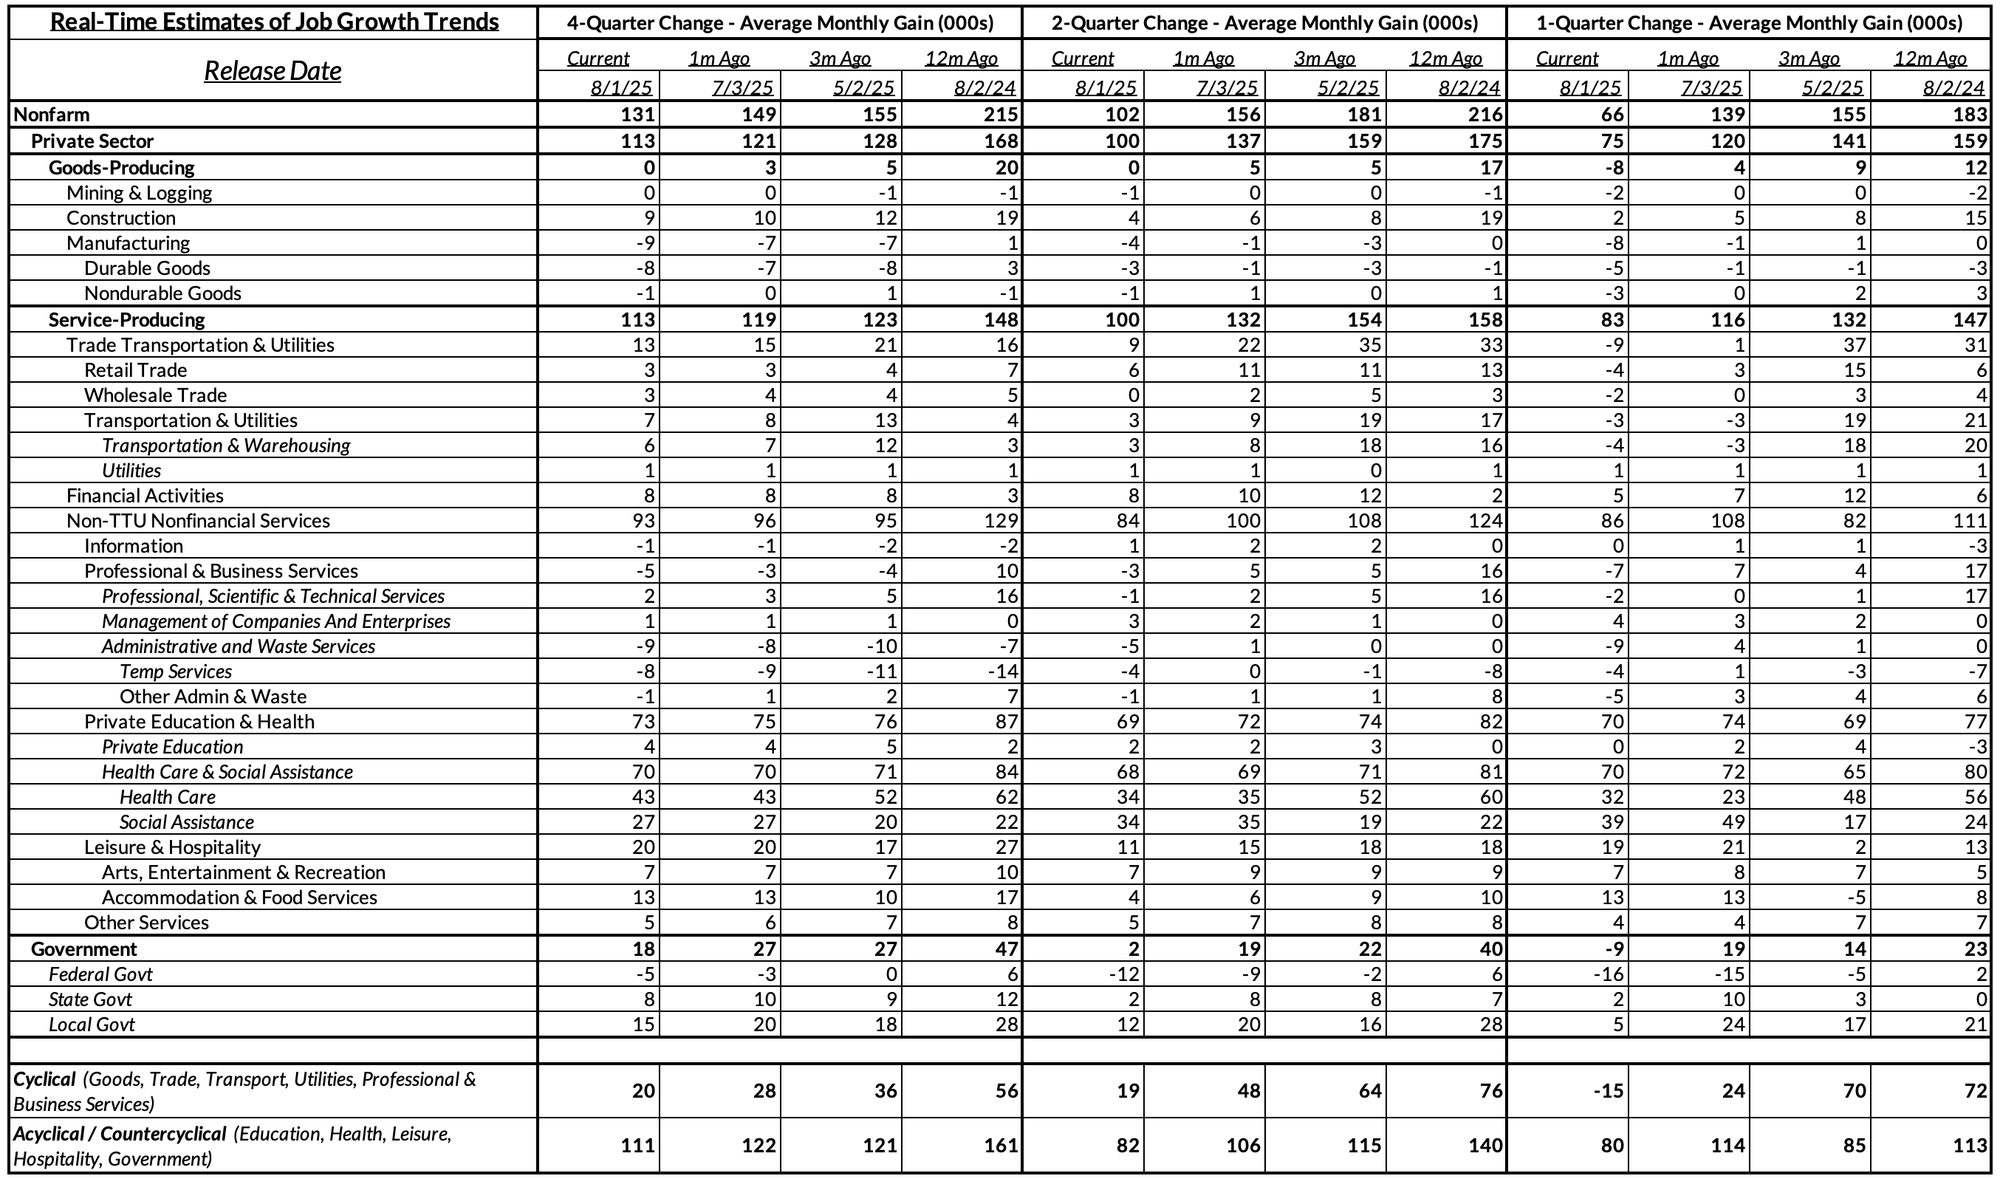
We track the evolution of RQG for all of the major sectors of nonfarm payroll growth on 1-, 2-, and 4-quarter lookbacks, with some measures more suited for timeliness, while others more stable. The major sources of change in the past month were concentrated in state and local governments, manufacturing, construction, retail & wholesale trade, and administrative & waste services.
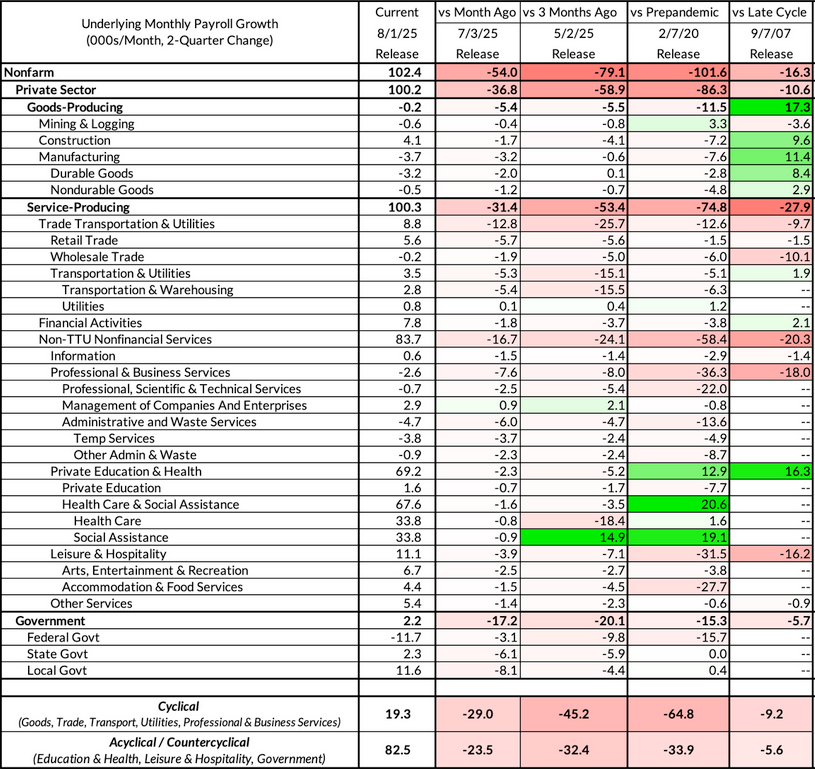
Digging deeper, we can see that the evolution of job growth outside of social assistance looks unfavorable relative to what we were able to observe even just 1-3 months ago. Relative to what we were seeing before the onset of the pandemic in 2020, job growth is meaningfully softer across most segments other than social assistance. Compared to what the job market looked like headed into the financial crisis in 2007, overall job growth is softer, but the goods sectors + healthcare & social assistance are seeing stronger job growth trends.
We’ve done the work of breaking out how real-time observations sector-level employment growth would have looked like historically. They give us a historical sense of just how weak the current data really is versus what observers in other moments might have seen.
When trying to evaluate where we might be in the business cycle, it helps to benchmark “what are we seeing now” versus “what would we have seen” at other points in history, especially during and in the lead up to recessions. That is of particular relevance for those sectors that outperform in periods of macroeconomic expansion and notably underperform in times of macroeconomic contraction.

For those cyclical sectors for which we have long historical archives to evaluate RQG–specifically goods-producing sectors (mining & logging, construction, and manufacturing) and the trade-transportation-utilities (TTU) supersector–job growth appears to be marginally better than what we’ve seen at the onset of recessions.
The 2-quarter pace of job growth across these sectors is roughly 9,000 additional jobs per month as per the July Report. While quite soft relative to the growth rates observed in the 2010s and 2020s expansions, the growth we are seeing now is not that different to what we saw in the first Jobs Report released in 2025. Normally when the US economy is not in recession, growth rates tend to be higher, closer to 50,000, but the US may be in a period of abnormally low population and effective labor supply growth.

Adding in Professional & Business Services, which include both lower paying temp jobs and higher-paying white collar occupations, and also exhibits cyclicality, the picture gets more concerning. For this broader definition of cyclical sectors, job gains on a 2-quarter comparison average to just 6,000 per month. That ties the lows we saw in the December 2023 and is far lower than at any moment during the slow-and-steady 2010s labor market expansion or even the mid-2000s labor market expansion.

Among the goods-producing sectors, we are seeing two key dynamics emerge through the revisions. First, the construction sector is adding jobs but at an increasingly slow pace. Construction is a more volatile sector because of weather and seasonality, but even on a 4-quarter comparison, we are seeing some of the slowest rates of job growth outside of what we see in a recession. Second, Durable Goods Manufacturing is also continuing to show contraction, that too despite the sharp recovery in aerospace after the Boeing strike resolution. Tariffs and trade policy uncertainty are likely headwinds, just as they proved to be in 2019. The scale of job growth visible across these two sectors could be compatible with “pre-recessionary” periods like 2007 but also non-recessionary “growth-scare” slowdowns like 2015-16.
Given the headwinds trade policy uncertainty and OPEC production increases pose, Mining & Logging and Nondurable Goods Manufacturing are also vulnerable to contracting further.

While technically not a “goods-producing” sector, the Trade-Transportation-Utilities supersector is vital to the production and distribution of goods across the US economy. This supersector includes the logistics, retail, and wholesale industries, arguably the most exposed to disruptions in global trade dynamics. While the slowdown in Wholesale Trade job growth was already visible beforehand, the July Jobs Report showed sharper downside revisions to key segments of Retail Trade as well as Warehousing & Storage.

Professional & business services employment lacks the same history for evaluating (robustly) what counts as vulnerable rates of job growth. Nevertheless, we can safely say that job growth in the last two expansions never looked nearly as weak as it does right now. This dynamic is tempting to cast as an “AI automation” dynamic, but at least for the white collar segments, the slowdown has been in train for some time. Temp help jobs, which tend to be lower paying, are still contracting and saw negative revisions in the July report, but are no longer contracting as aggressively as they were in 2023 and 2024.
Acyclical sectors have been driving job growth over the last two years but they are no longer providing the kind of buffer to cyclical softness that they once were.

Education and healthcare job creation have been strong over the last three years, but the primary driver was catch-up growth after underperforming their pre-pandemic trends during the initially hot phase of the labor market recovery. As other sectors began cooling in late 2022 and 2023, growth in these sectors picked up further. But as these catch-up gains have largely materialized, the pace of job growth in these sectors are poised to cool further to more historically normal growth rates.

Leisure and Hospitality job growth has rarely looked this soft either. Accommodation and Food Services employment had persistently outperformed in the 2010s only to now be persistently underperforming. Hiring here is likely to be affected by headwinds to net migration.

While DOGE cuts have been dominating headlines, state and local government (which employs substantially more workers than the federal government) is starting to show even sharper deceleration from the post-pandemic catch up dynamics. As fiscal tailwinds for state and local governments dissipate, we are likely to see further reluctance to hire.
By focusing on Reported Quarterly Growth, policymakers, market participants, businesses, and workers can extract a much more robust signal of the strength and trajectory of the labor market. We hope that the takeaway from the controversy around revisions leads to more focus and attention to metrics that are robust to sharp revisions. No data release is ever the “perfect truth.” Our assessments and observations of labor market data are always imperfect and shifting. Media and labor market commentators would do well to reflect that reality in how they cite the latest data from each Jobs Report.