Revision Whiplash: Why Coverage of Nonfarm Payroll Growth Is Messy, And How To Track Underlying Growth Better

The main purpose of real-time macroeconomic data releases is to track the evolution in the underlying growth rate of economic activity. The precise levels of employment, wages, total hours, and total dollars of payroll expenditure are less meaningful, and most ripe for substantial revision over time. But even short-run 1-, 2-, and 3-month growth rates in those indicators can be subject to wild revision, such that additional adjustment that accounts for the revision process is essential. The ability to identify when the "underlying growth rate" of the labor market is shifting is most critical for business cycle monitoring.
For establishment survey data prone to substantial short-run revisions, it would be a clear improvement to shift attention away from the latest month's reported gain and towards at least a 3-month change (or growth) rate in the 3-month moving average. This specifically applies to nonfarm payroll employment, average hourly earnings, aggregate weekly hours and aggregate weekly payroll expenditures.
Evaluated more robustly, we now see clearer signs that the labor market (1) continues to slow down, and (2) is running at both an underlying nominal and real economic growth rate consistent (or nearly consistent) with pre-pandemic outcomes, in which lower inflation outcomes transpired.
We would still encourage diversifying away from the establishment survey as the "truth" about the labor market. Its employment insights should not be disproportionately weighted relative to the Current Population Survey (more volatile, but no revision issues), business and consumer diffusion index surveys (less concrete, but more timely and no revisions), and unemployment insurance claims (concrete and timely but generally of lower data quality). We have already noted that Employment Cost Index data and the JOLTS quits and hires rates are more robust guides to wage trends.
1. Nonfarm payroll headlines can be deceptive when making real-time macroeconomic assessments.
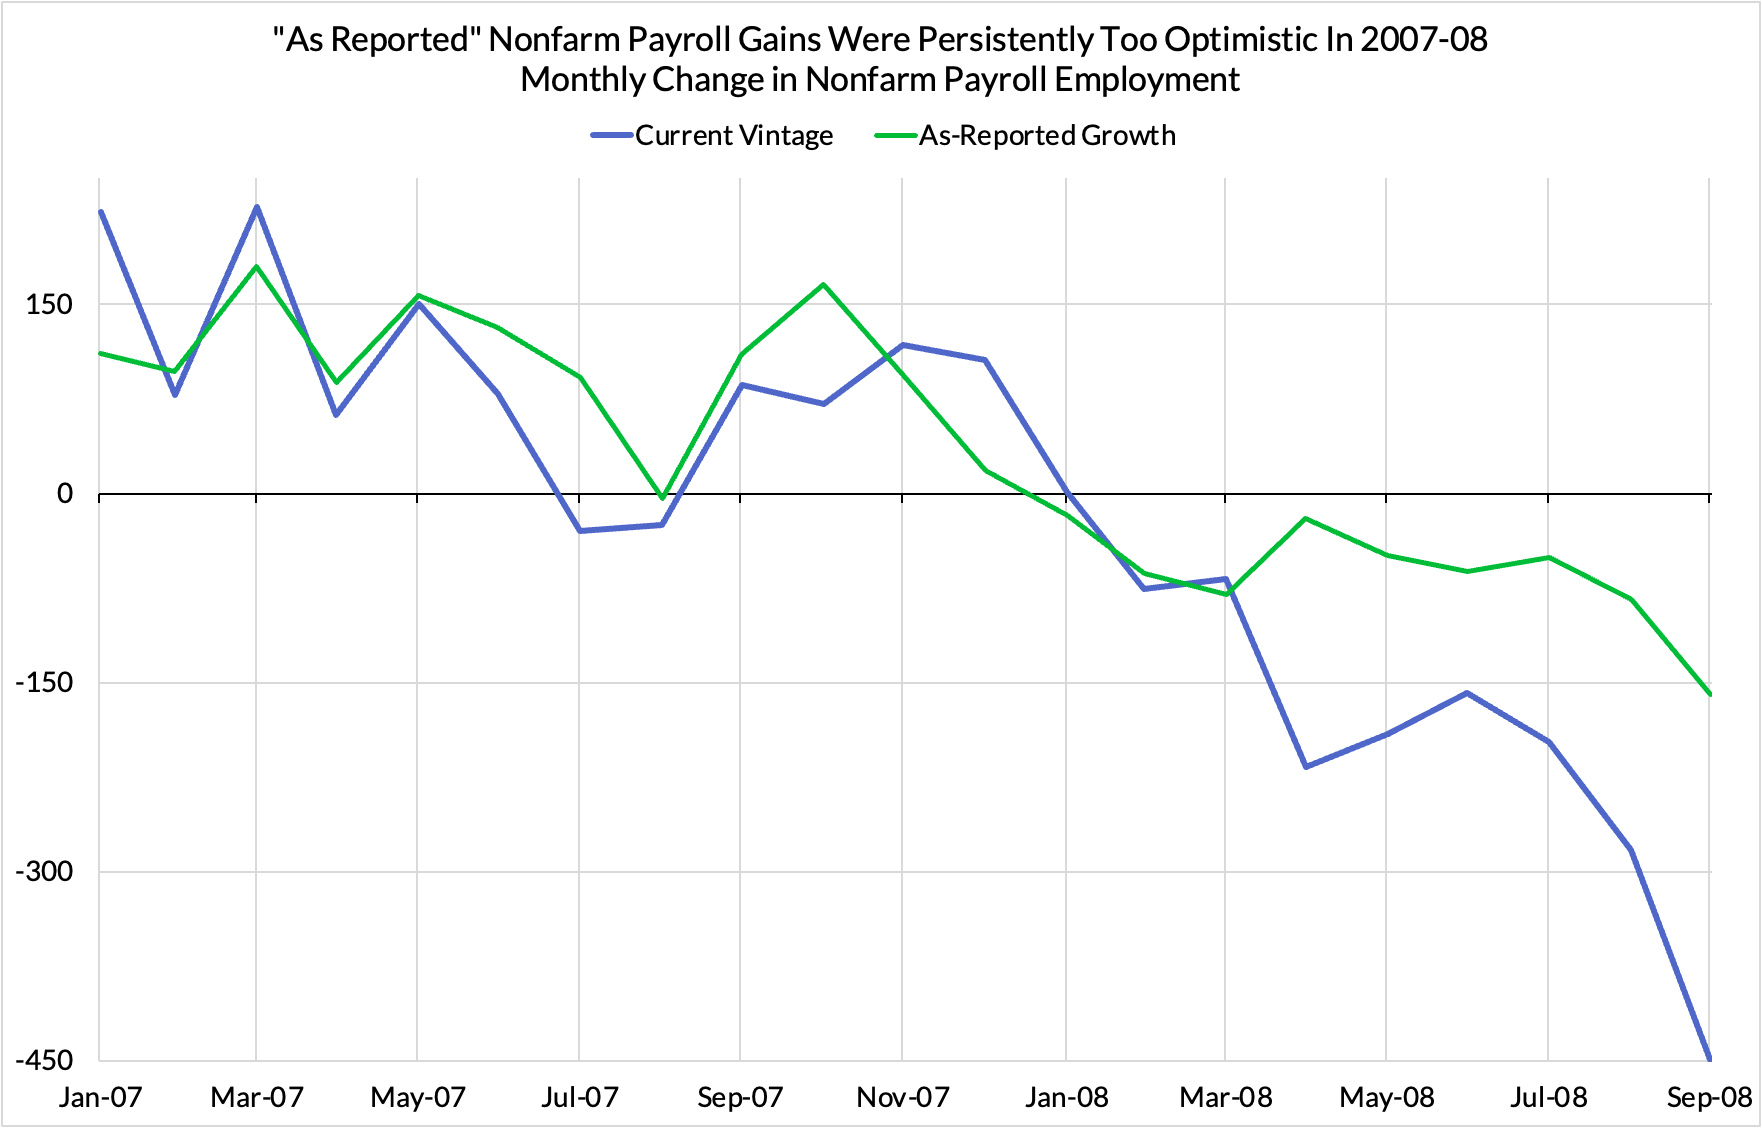
When the Employment Situation Report is released on "Jobs Day," reporters, economists, market commentators, and the BLS immediately push you to the headline: the monthly change in nonfarm payroll employment, as measured in the Current Employment Statistics "establishment survey." But is this really the right measure when previous data gets so heavily revised over the previous two months (and occasionally much further back in time)? You could hypothetically have persistently reported monthly contractions in nonfarm payroll employment alongside persistently reported expansions in the same series on a 3-, 6-, or 12-month lookback. While such a hypothetical example is exaggerated, the underlying point is certainly worth appreciating around cyclical inflection points. 2007-08 looked appeared to show a mix of slowing payroll gains and shallow payroll contractions, only for the numbers to be subsequently revised to show deeper contractions earlier.
2. Revisions raise bigger philosophical questions about the "truth" of the present moment.
What if job gains were reportedly strong in the latest month only to have previous months' job gains revised down? Does that make the job gains of the most recent month illusory? Or does it suggest that the most recent month's elevated employment gain is indicative of local hiring acceleration and momentum? It turns out all of these questions are pretty futile to answer when the data you see today might look entirely different in retrospect.
3. Most of the establishment survey revisions occur in the two monthly estimates that directly precede the latest month's reading.
There are also benchmark annual revisions at the beginning of each calendar year that affect the previous twelve months' estimates, but most of the revisions are a function of additional data collections the Bureau of Labor Statistics receives a month or two later. For the August employment report, we received revisions to the estimates for both June and July, with only the June estimates (quasi-)finalized. The scope for revision generally decays as the estimated period fades further back in time. In September, the July and August estimates will be revised, with the July estimates less vulnerable to revision than those for August.
4. 2- and 3-month changes (or annualized growth rates) in establishment survey indicators are an insufficient remedy.
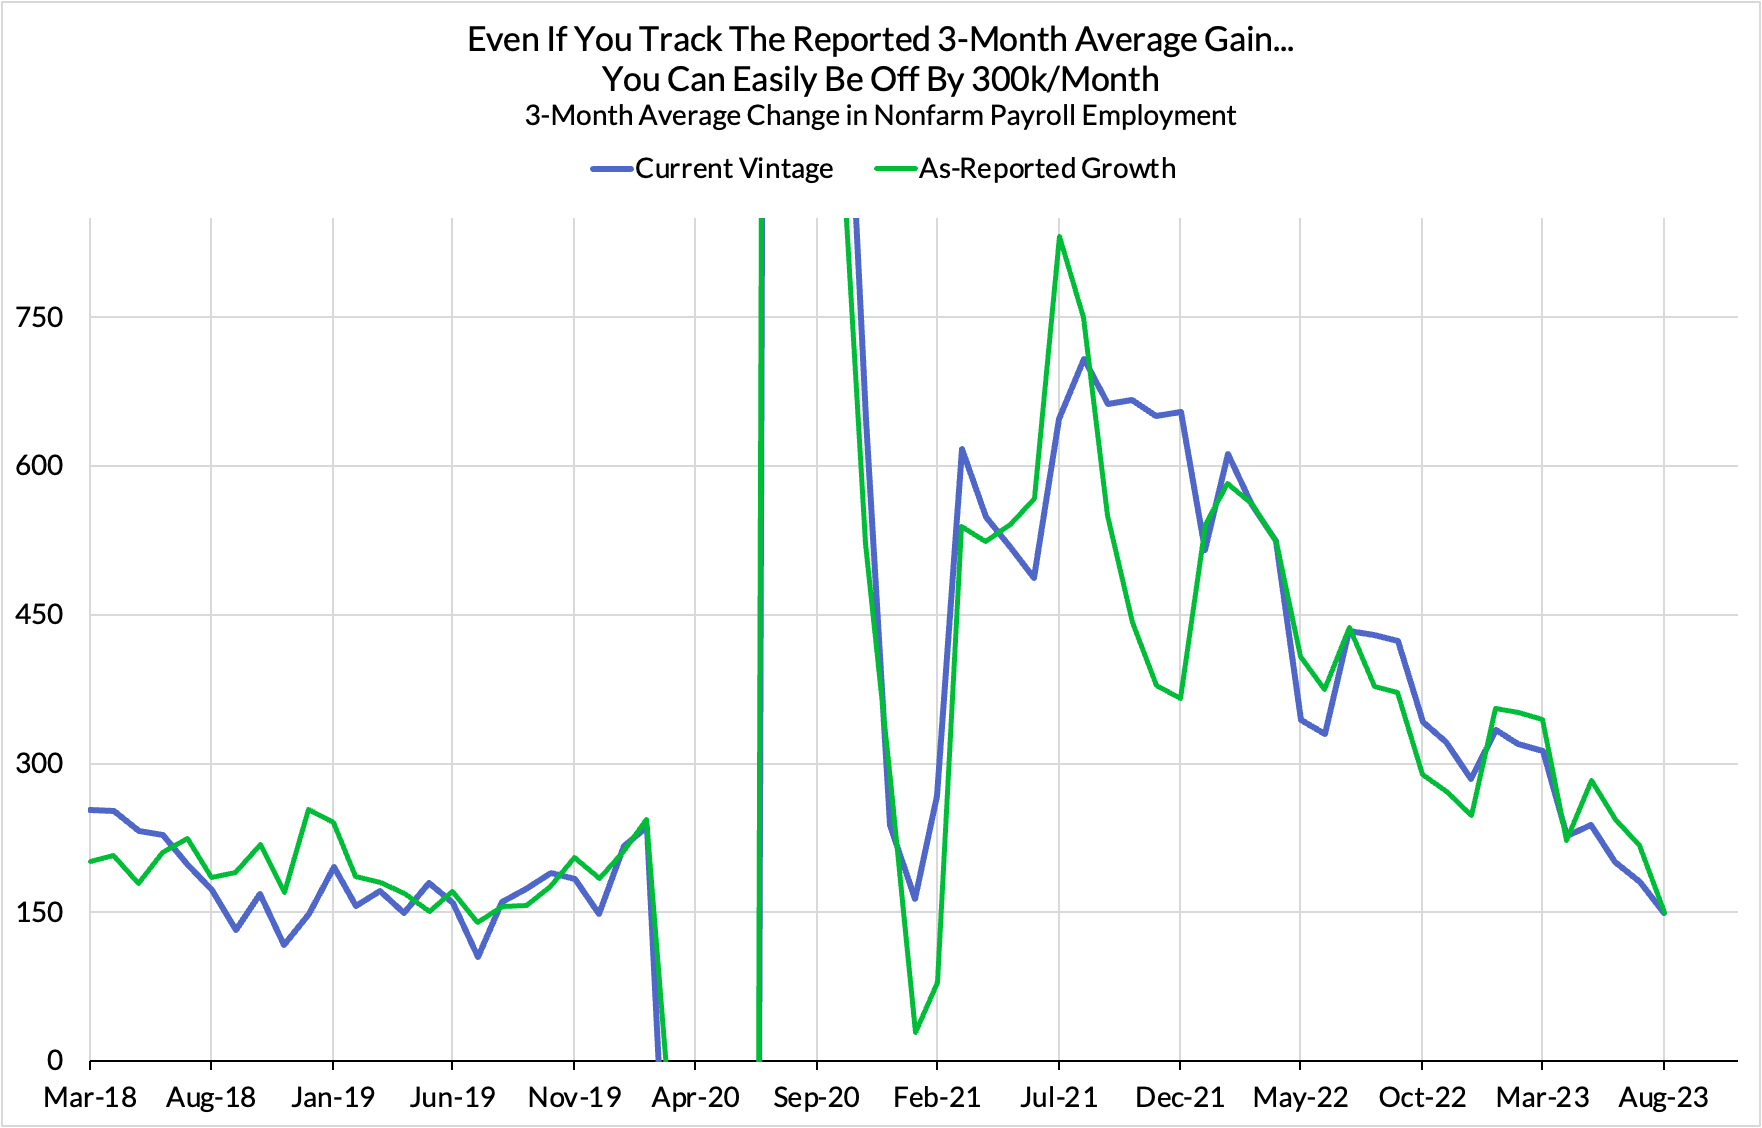
Even taking a 2-month or 3-month change in nonfarm payrolls does not cure the undelrying revisions challenge. The latest month's preliminary estimate still has outsized "leverage" in these specifications, such that errors/revisions associated with the latest month's estimate are disproportionately propagated and amplified. If the latest month's estimate is subsequently revised down, the associated 2- and 3-month change will also be revised down proportionally.
5. The problems that revisions pose are only compounded when dealing with more complex data in the establishment survey. This includes (1) average hourly earnings (wages), (2) aggregate weekly payrolls (total labor income/expenditure), and (3) aggregate weekly hours (total hours worked). Each of these measures have at least as many sources of revision as the nonfarm payroll estimates.
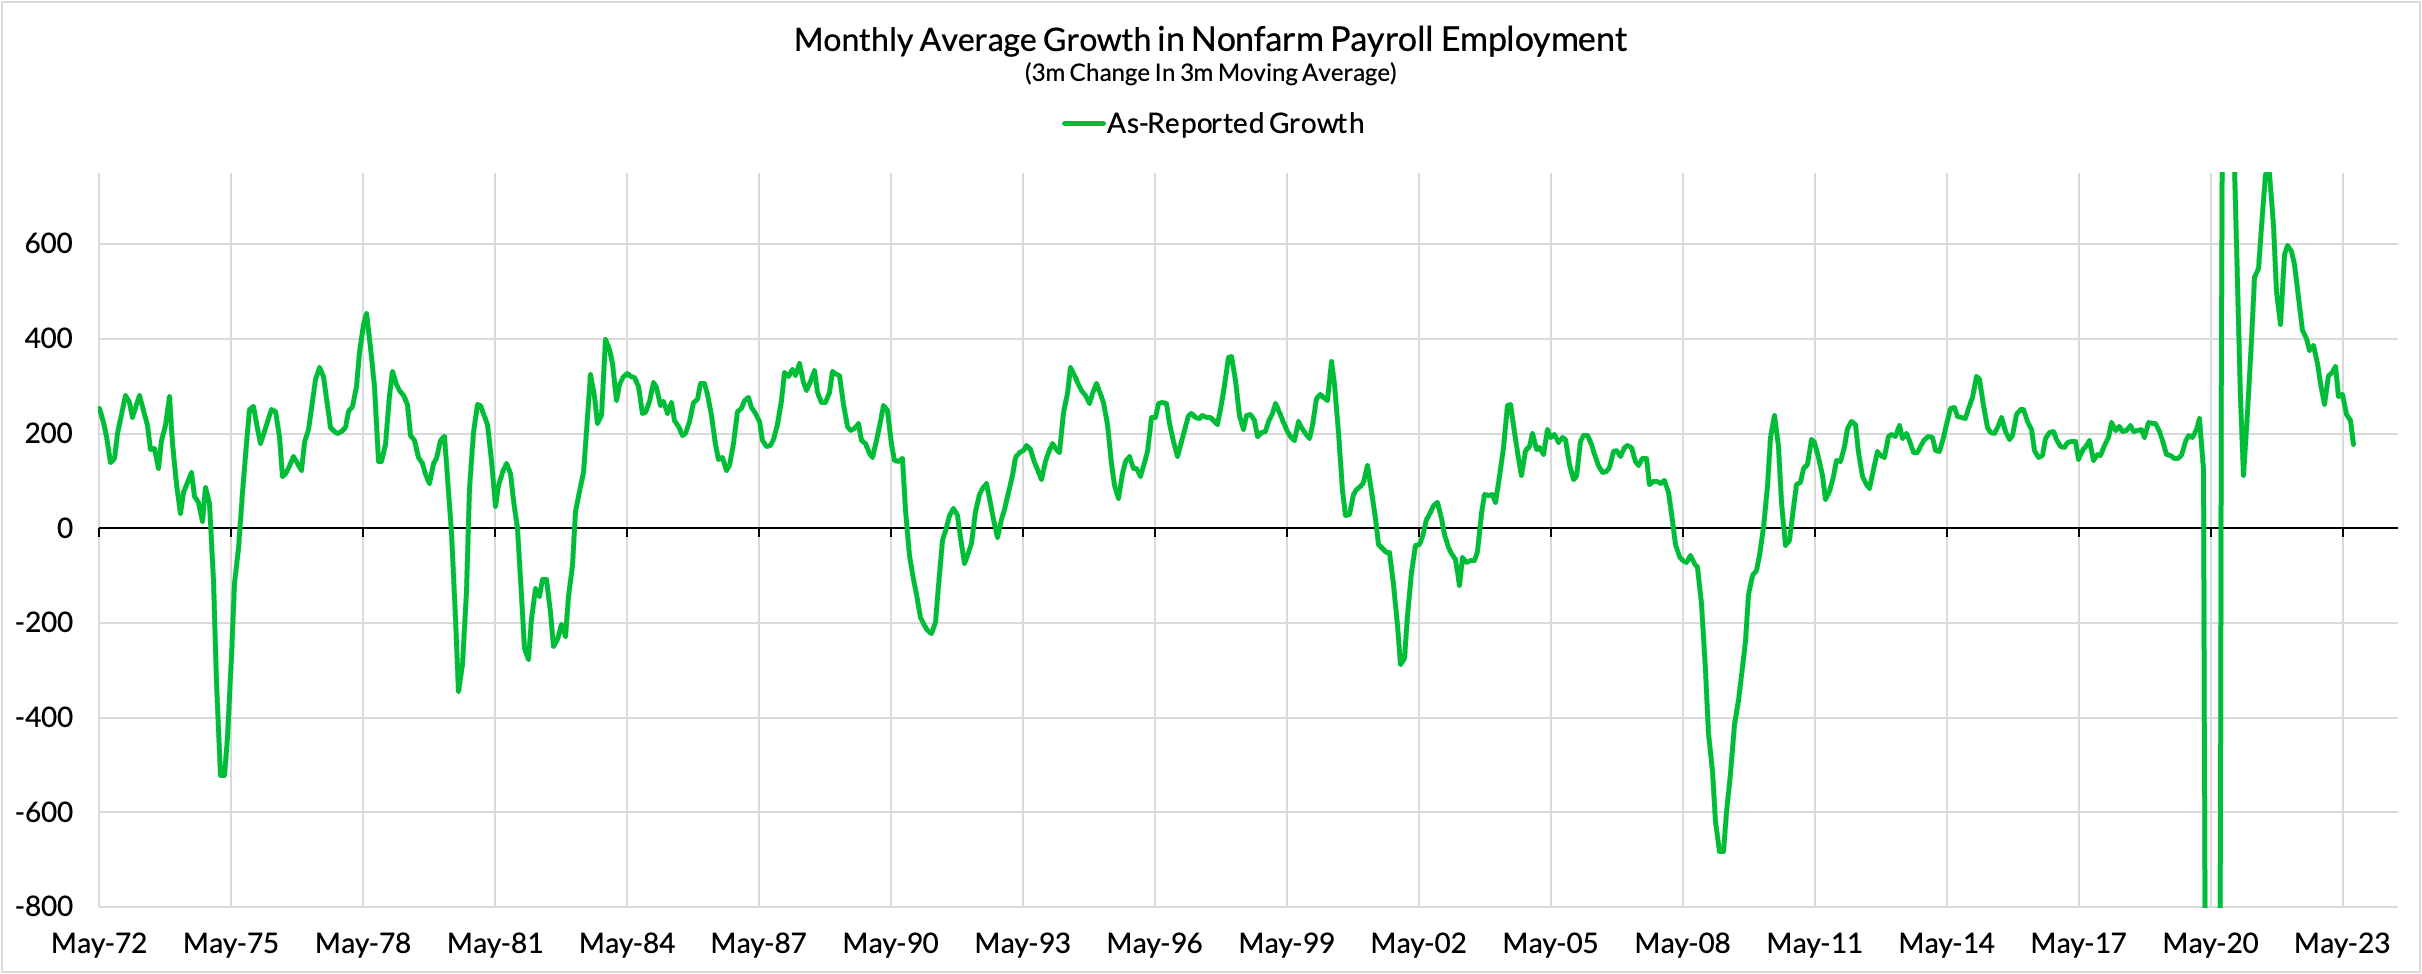
6. We would be better off highlighting the evolution of at least the as-reported 3-month change in the 3-month moving average (a quasi-quarterly growth rate). Such an approach is implicit to how almost all quarterly estimates are calculated (e.g. GDP). Whereas a simple 3-month annualized rate puts equal weight on the monthly growth rates in each of the most recent three months, a quasi-quarterly growth rate puts more weight on the earliest of the three months (where estimates are quasi-finalized) and less weight on the most recent of the three (where estimates are most vulnerable to large revision). Moreover, the month-to-month evolution in a quasi-quarterly growth rate will put equal marginal weight on the last three months' newly estimated gains (or losses), appropriately accounting for revisions to the previous two months' estimates when assessing the evolution of the underlying growth rate in jobs, wages, hours, and total payroll expenditures.
7. Changes, not levels.
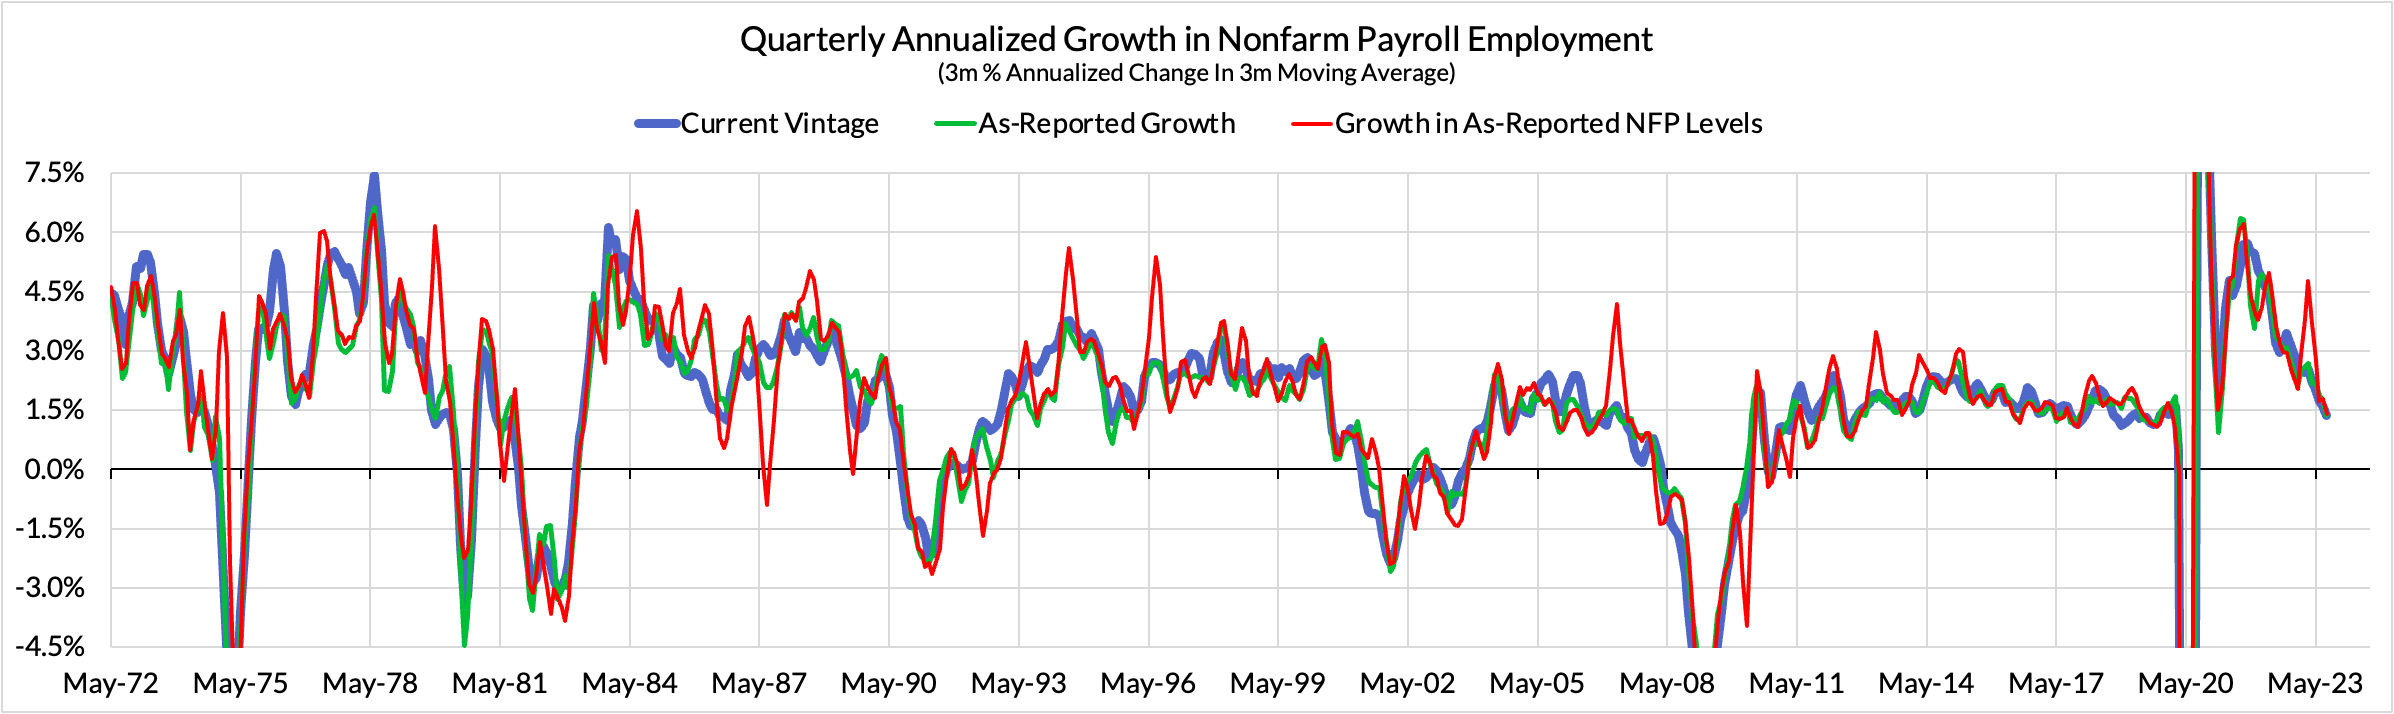
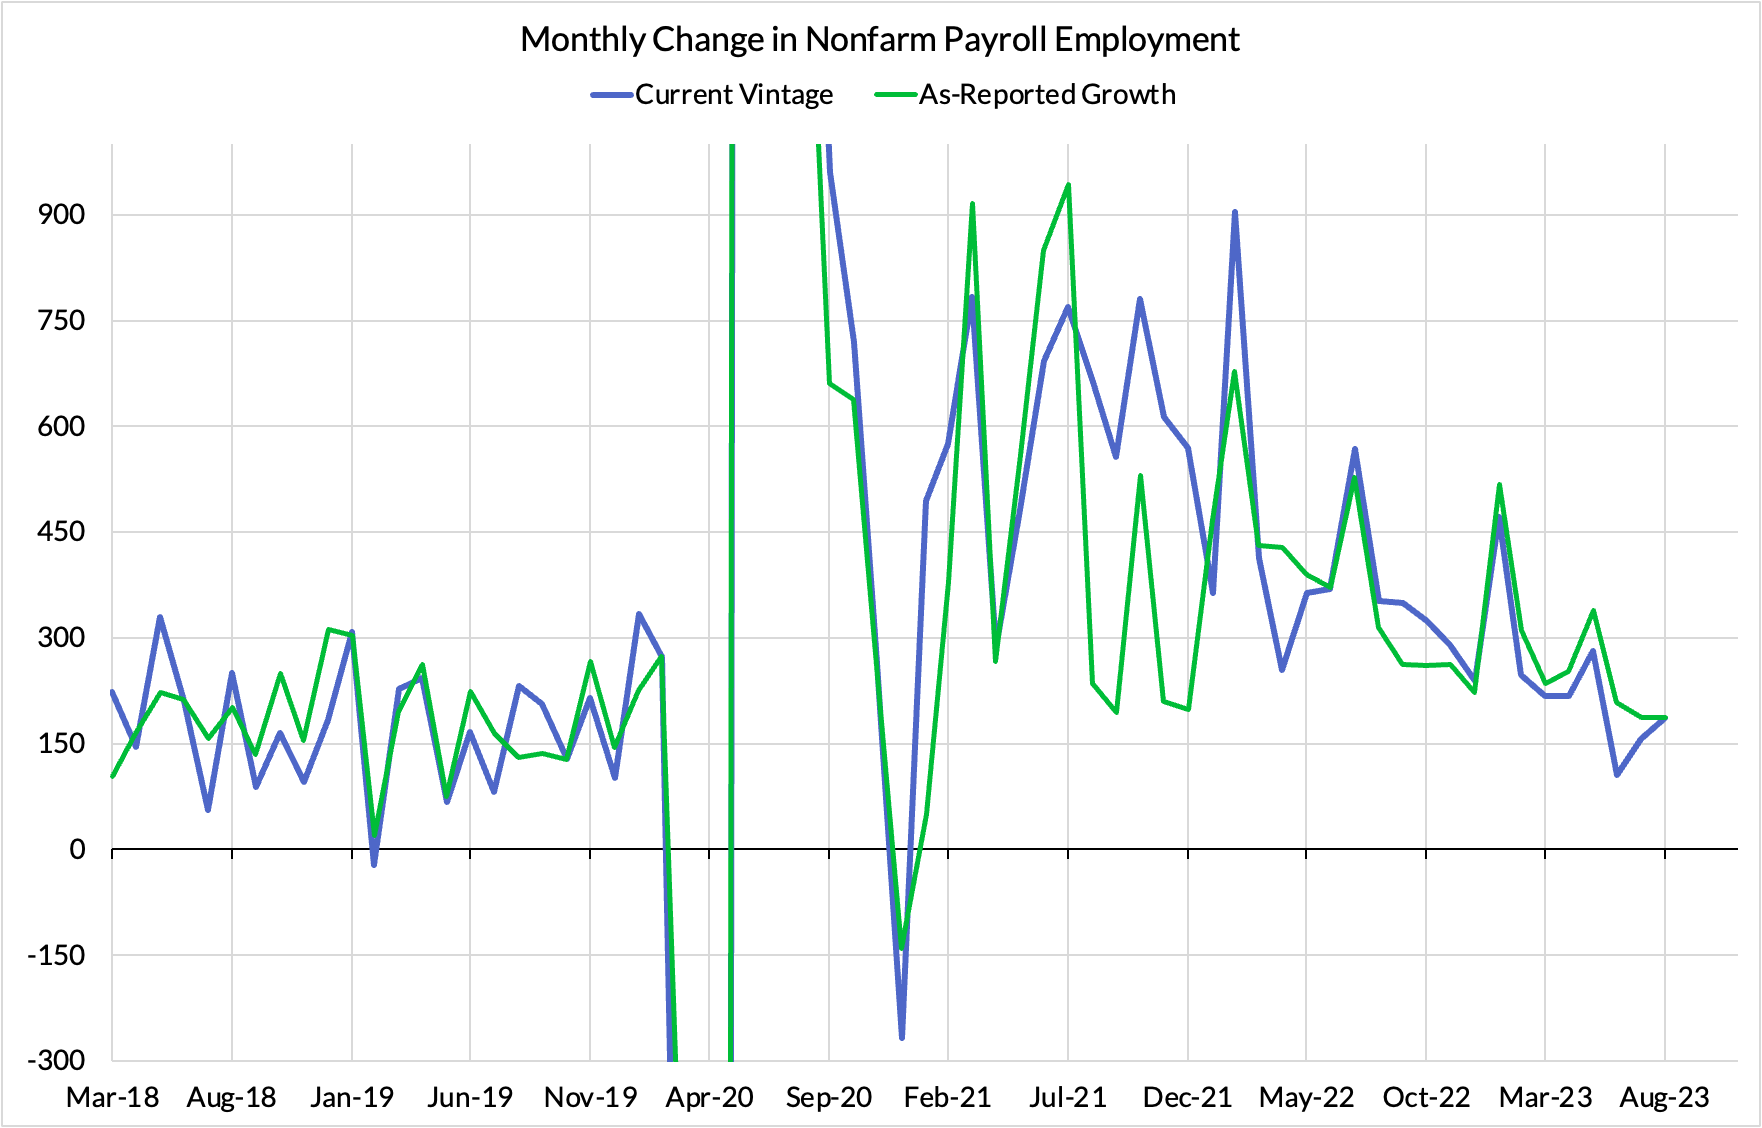
If we were solely interested in the reported levels of nonfarm payroll employment (or average hourly earnings), we would see an even bigger issue posed by revisions. Especially (though not exclusively) when the establishment survey data is subject to annual benchmark revisions, payroll employment growth is subject to upside and downside spikes. These spikes do not necessarily increase the likelihood of future spikes, but they also do not necessarily reverse symmetrically either.
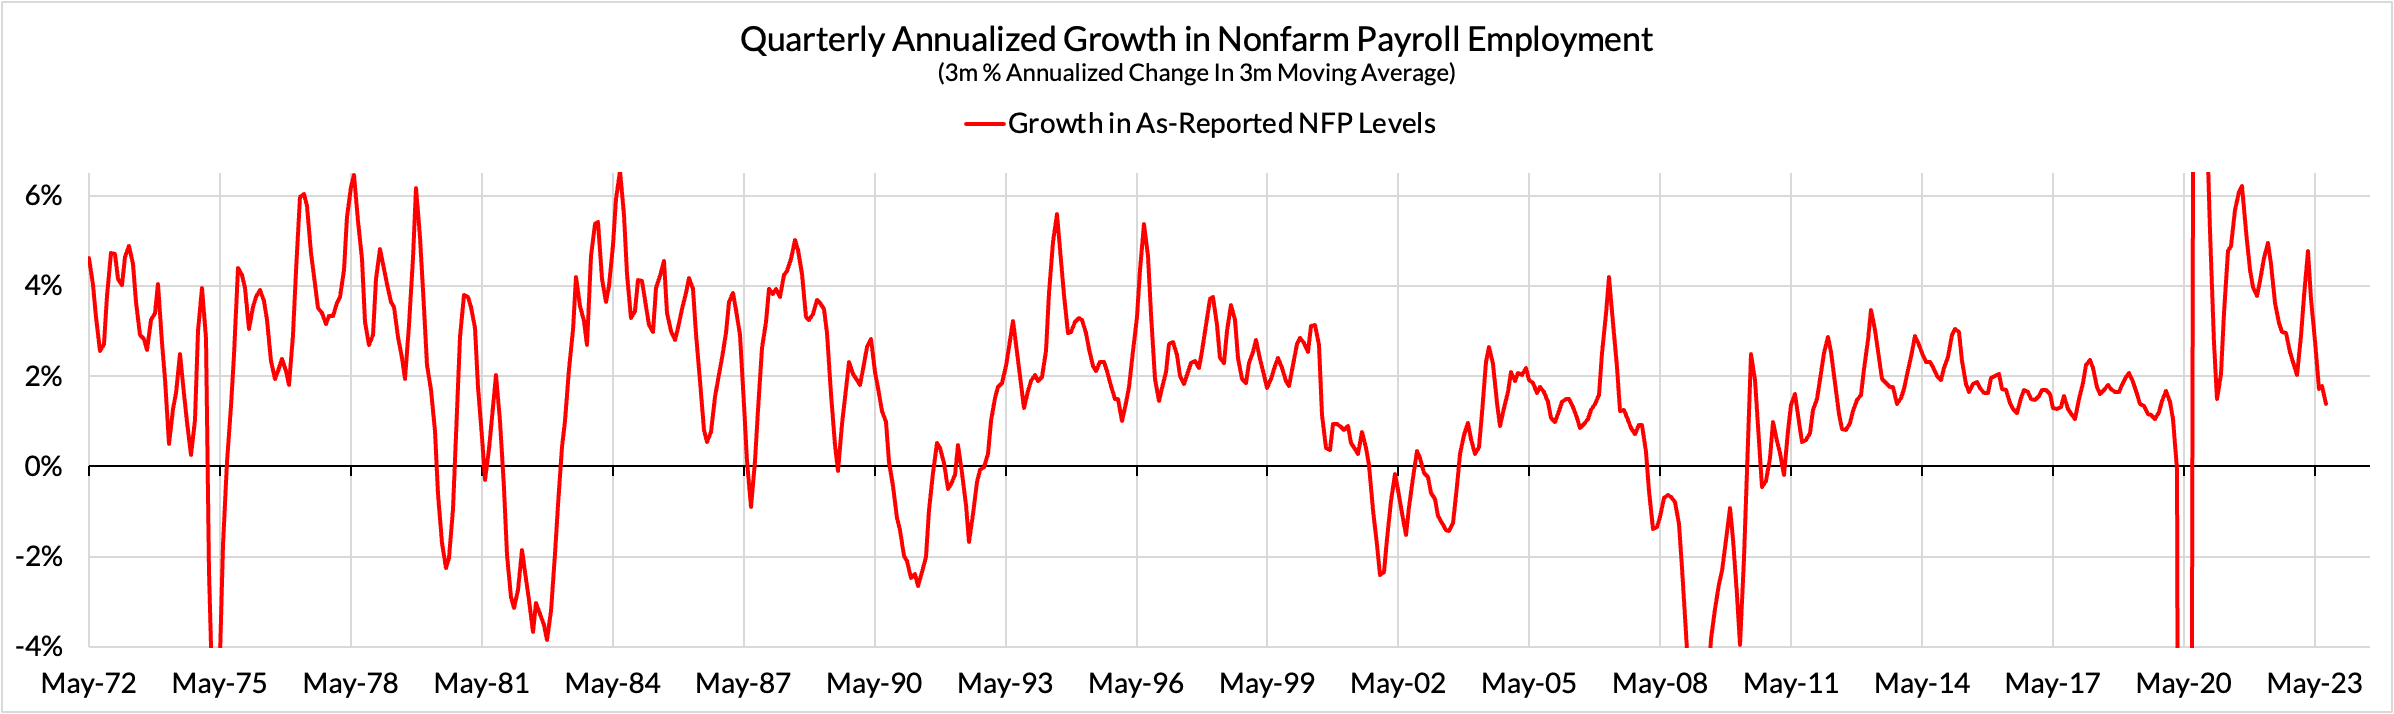
Should macroeconomists focus on such innovations? Probably not. The usefulness of the nonfarm payrolls numbers is as a business cycle barometer. If you want a systematic census of employment and labor utilization levels, there are complementary data sources with larger sample sizes over longer horizons that enhance robustness. But business cycles are ultimately about keeping the rate of economic growth positive and stableand, from the Fed's perspective, constraining the growth rate of consumer prices to 2% over the longer run. One-time spikes distort the ability to evaluate the "underlying growth rate."
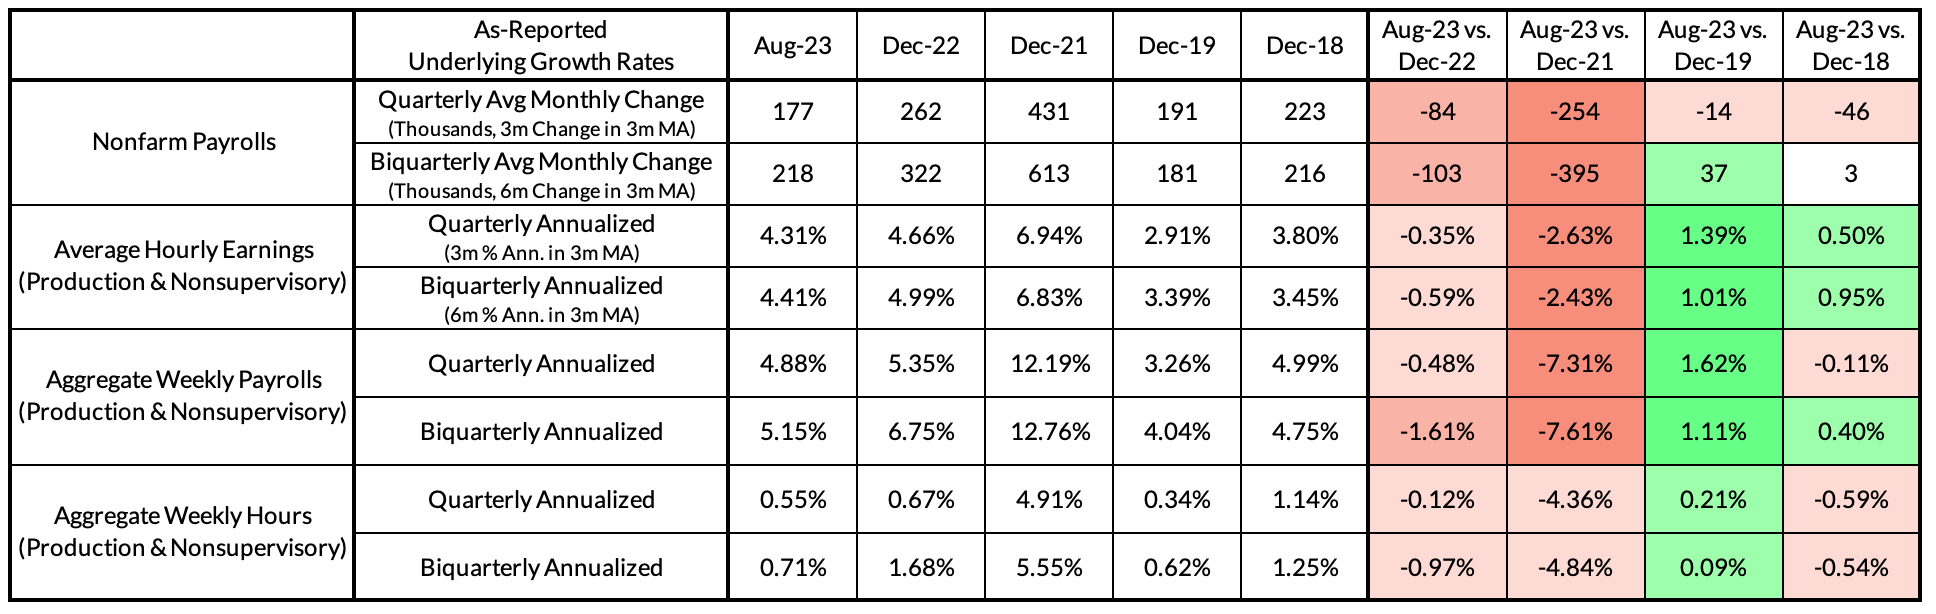
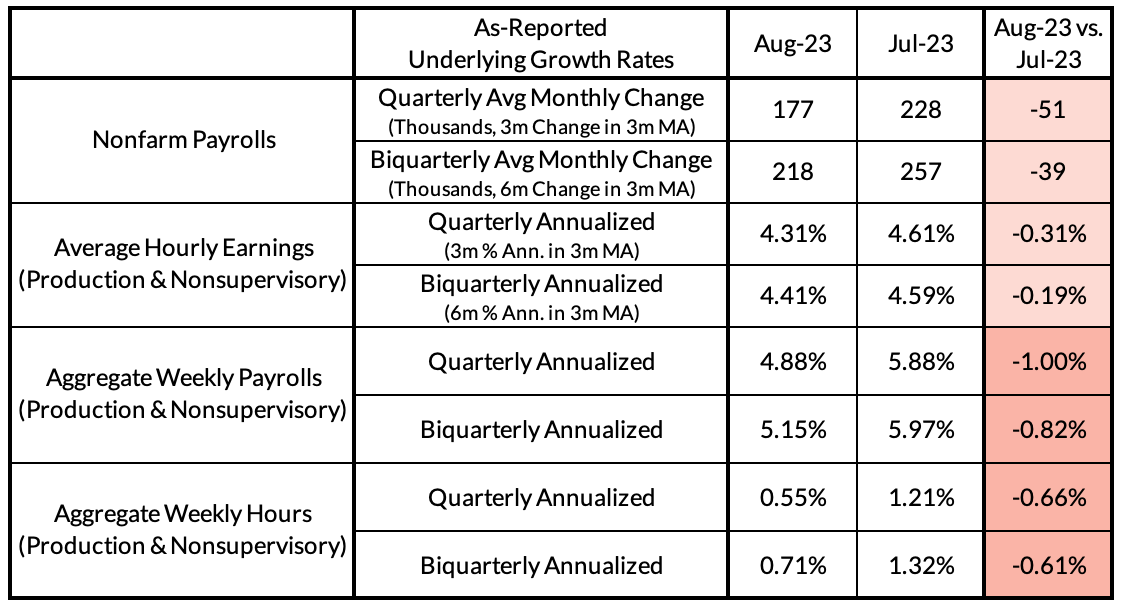
Using the evolution of as-reported 3-month change in the 3-month moving average of nonfarm payroll employment, underlying quasi-quarterly job growth fell from 228k/month on an as-reported basis in July to 177k/month in August. This deceleration now puts payroll growth more firmly consistent with the noninflationary pre-pandemic outcomes from 2016-19.
Using the evolution of as-reported 3-month annualized growth rate in the 3-month moving average of "average hourly earnings in production and nonsupervisory employees," underlying quarterly wage growth fell from 4.61% on an as-reported basis in July to 4.31% in August. This deceleration now puts average hourly earnings within touching distance from the noninflationary pre-pandemic outcomes from 2016-19.
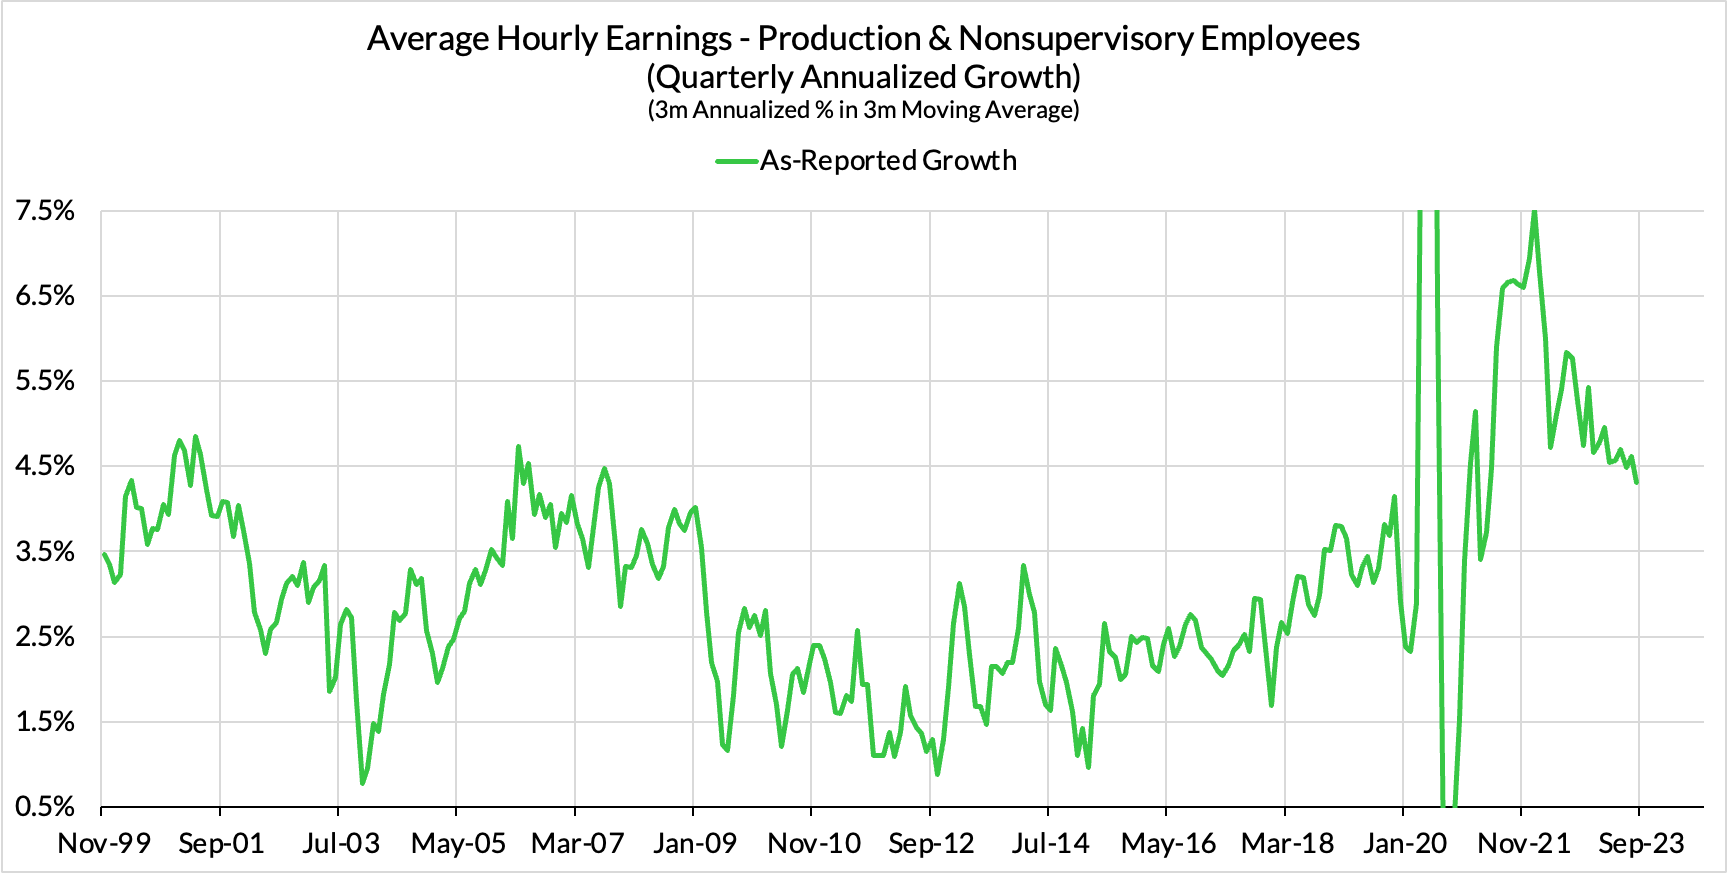
Note that this measure is available over a longer period of time than the "total private employees" measure, which only became available in 2007. It also has run at a structurally higher pace of wage growth, but it likely is more relevant to the inflationary picture insofar as it represents the wage gains felt by workers with a higher marginal propensity to consume.
Quasi-quarterly estimates can still be quite volatile, such that it is useful to look at a longer time horizon when judging the true trend in wage gains. If we took a quasi-biquarterly annualized growth rate (the 6-month annualized rate in the 3-month moving average), underlying as-reported wage growth fell from 4.59% in July to 4.41% in August.
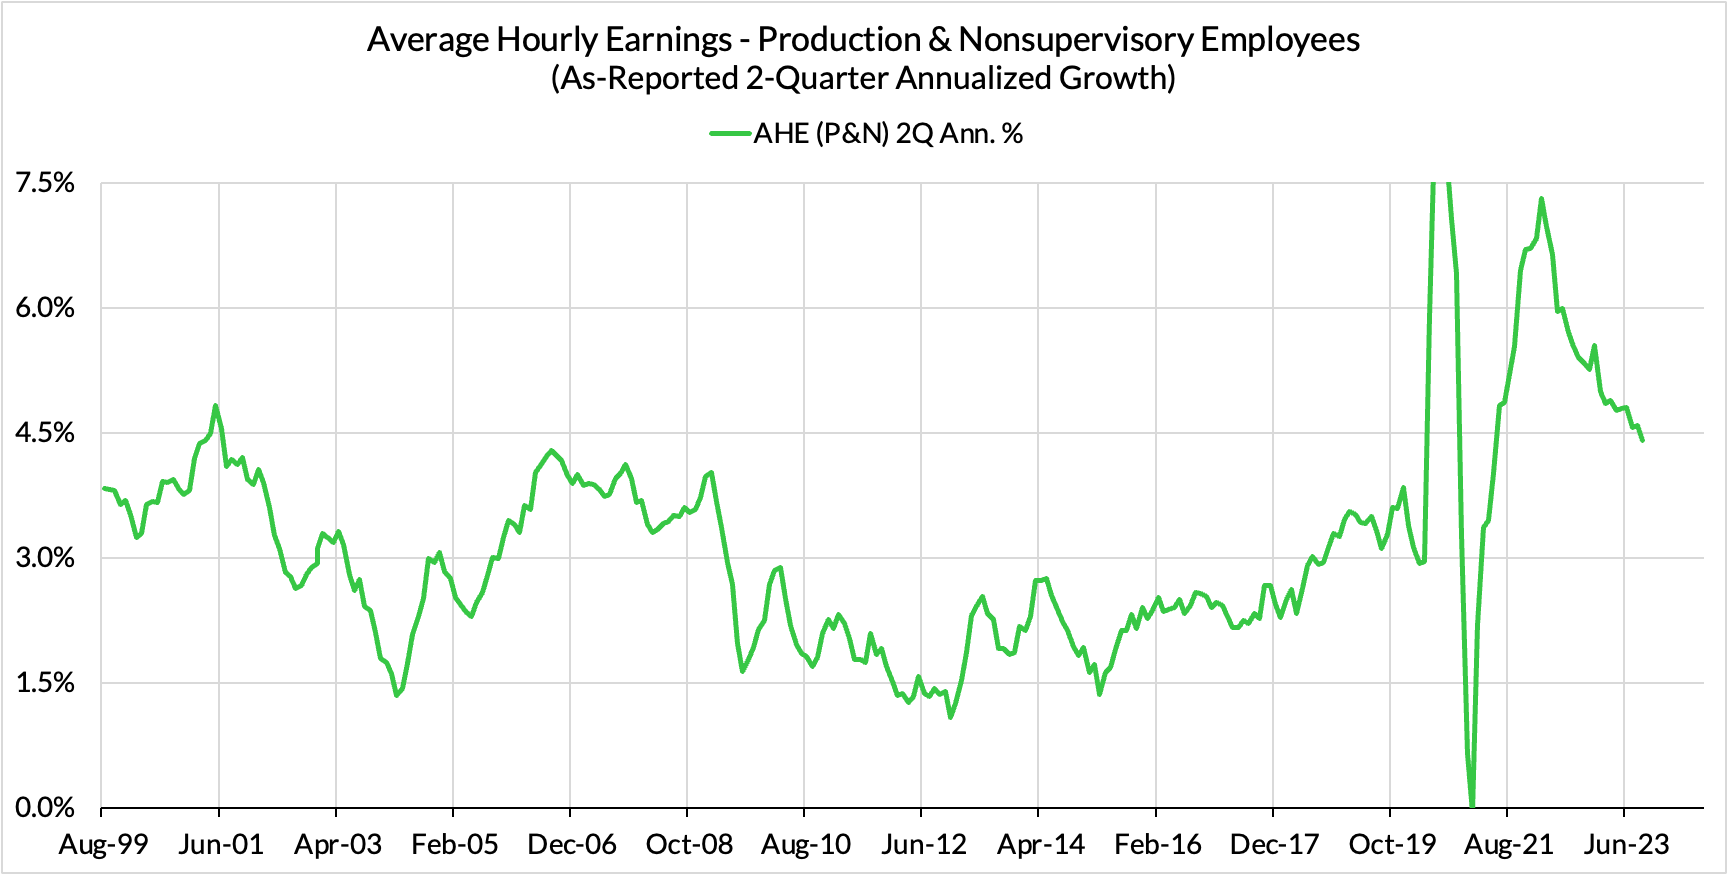
Quasi-biquarterly measures of wage growth will lag relative to quasi-quarterly measures.
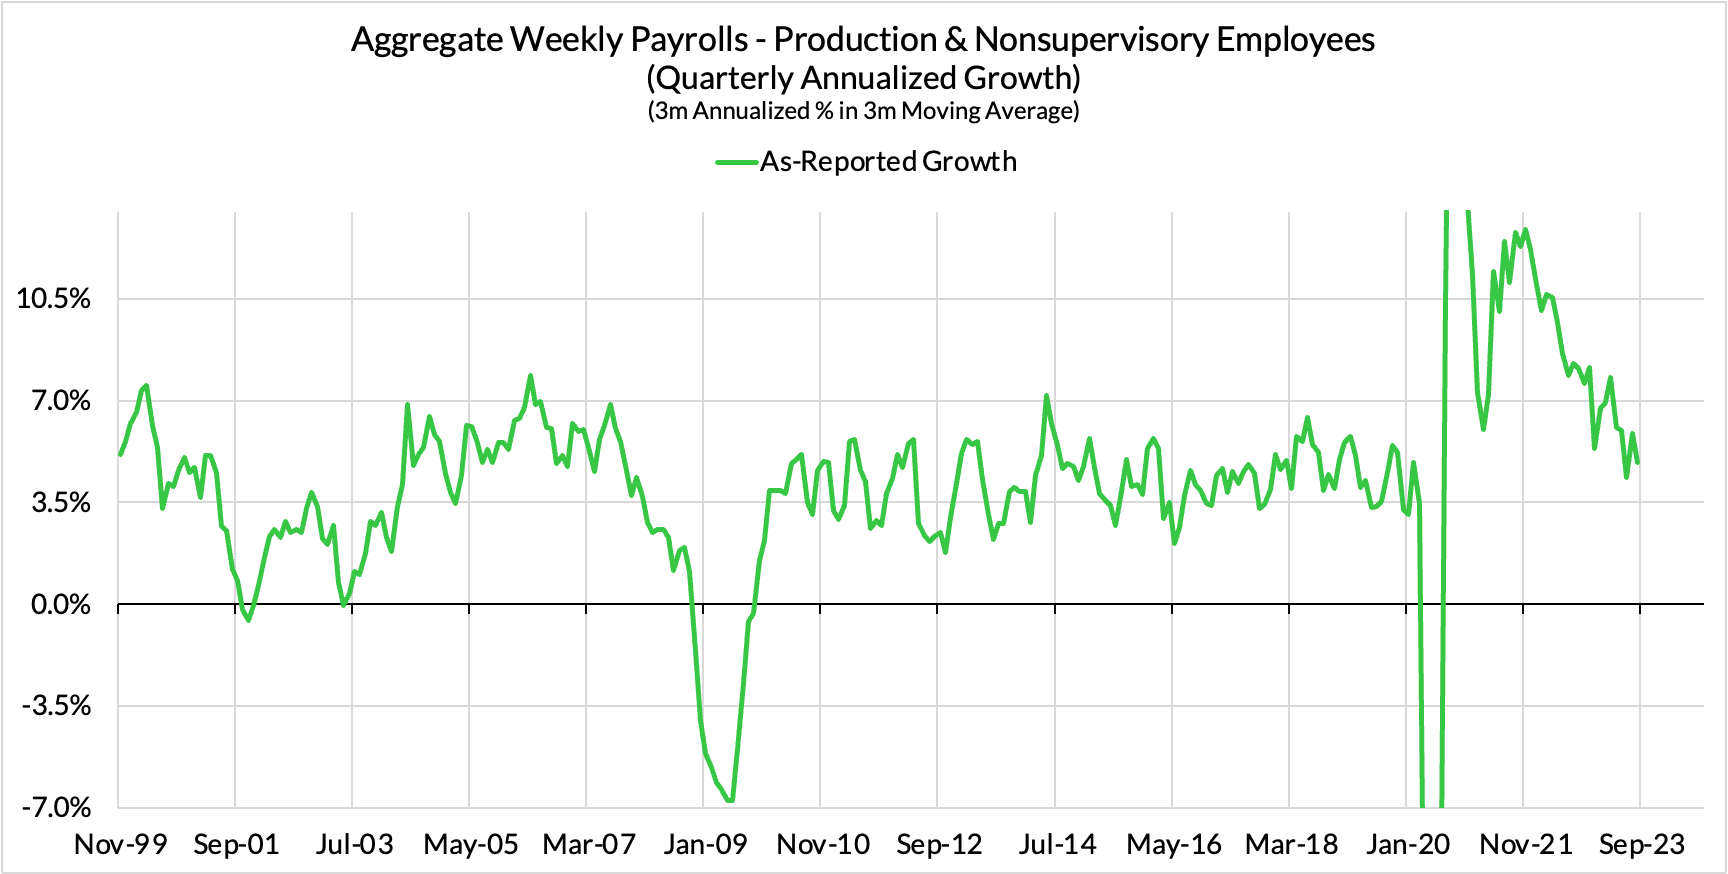
The establishment survey also directly measures aggregate payroll expenditures of business establishments. Tracking this variable over time is especially helpful (relative to the more commonly-cited average hourly earnings measures which is derived from aggregate weekly payrolls and hours worked). This variable is alaso conceptually important for pinning down the cumulative effect of job growth and wage growth on nominal consumer spending growth (and consumer price growth to the extent that it is demand-driven).
If we look at as-reported aggregate weekly payroll growth (gross labor income growth) for "production and nonsupervisory employees" and on an underlying quarterly basis, we see deceleration from 5.88% in July to 4.88% in August. Such a growth rate is also firmly in the bounds of what was observed in non-inflationary pre-pandemic circumstances.
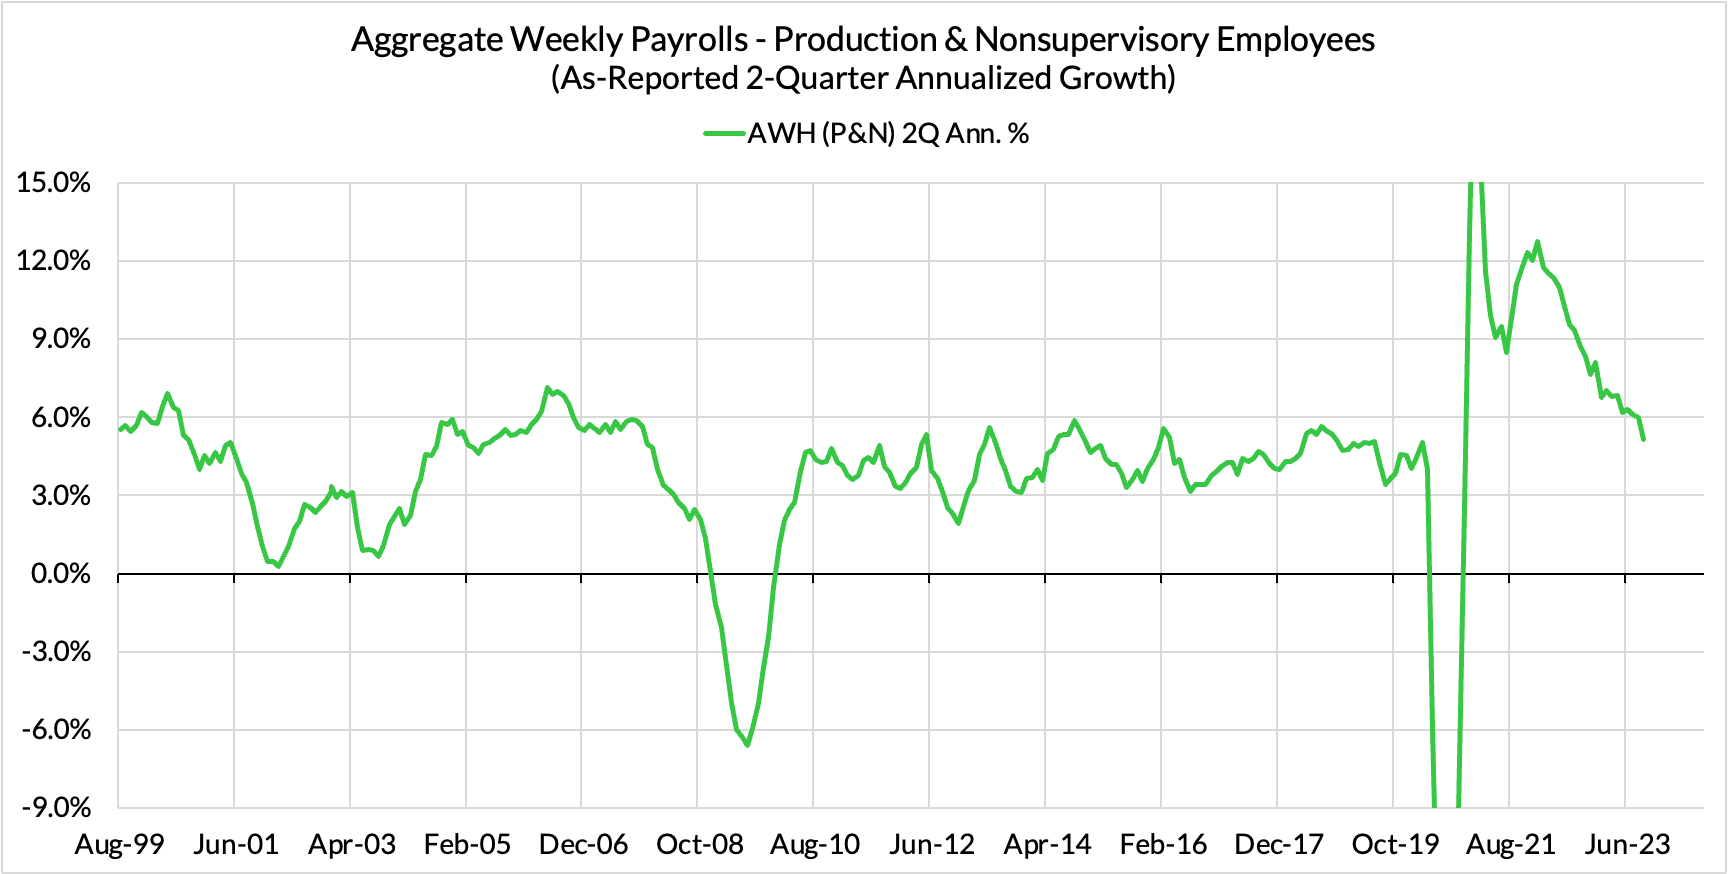
On a bi-quarterly basis, as-reported aggregate weekly payroll growth fell from 5.97% in July to 5.15% in August. Such growth rates are clearly in the bounds of what was observed pre-pandemic.
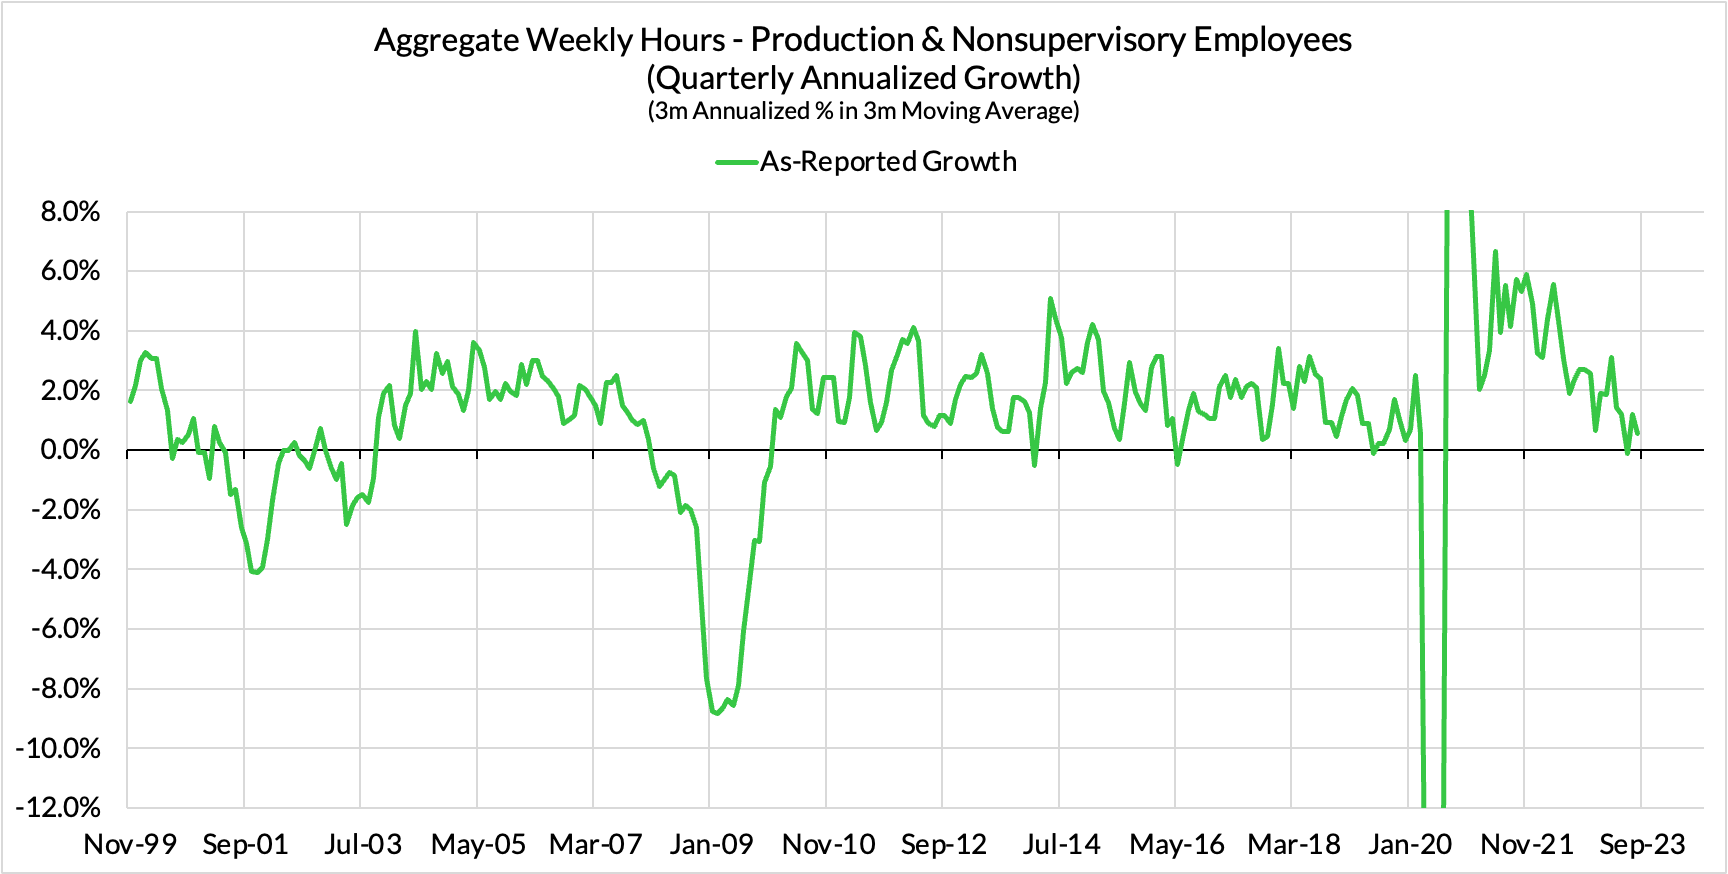
Despite outperforming GDP growth outcomes in Q1 and Q2 and signals of robust growth in Q3, hours growth is slowing more meaningfully now. All of this suggests that there are indeed good reasons for productivity optimism.
On a quarterly as-reported basis, total hours growth slowed from 1.2% in July to 0.5% in August.
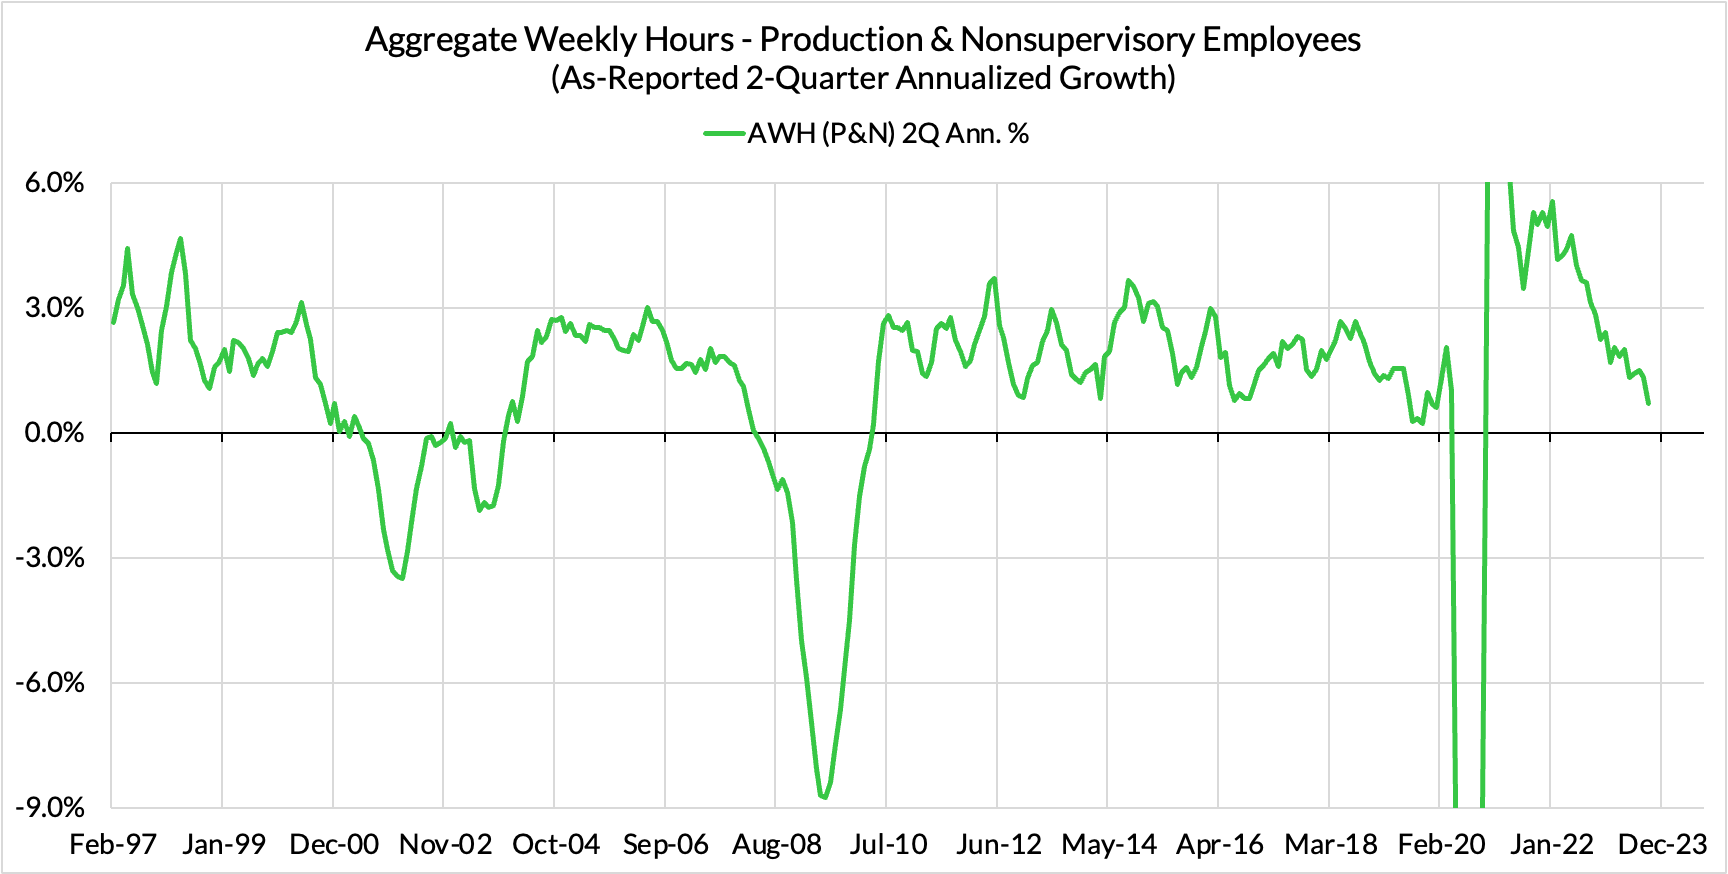
Even on a bi-quarterly as-reported basis, total hours growth slowed from 1.3% in July to 0.7% in August.
We will update these more frequently
Job growth, wage growth, and hours growth are substantially cooler than what was observed in the previous two years. While there is still marginally more momentum than in 2018 and 2019, the trends suggest further convergence in the months ahead.