Prescription for Prosperity: The Macroeconomic Benefits of Healthcare Cost Reduction
Just as healthcare cost control played a role in the economic boom of the 1990s, adopting these policies and reducing healthcare inflation could help deliver another era of macroeconomic success today.
In 2025, the American economy faces challenges on multiple fronts. Inflation, despite falling from its post-pandemic heights, has yet to return to the Fed’s 2% target. The labor market is sluggish, with stagnant employment rates, slow payroll growth, and low hiring rates. Interest rates are high, restricting investment in key sectors like energy and housing.
There’s an underdiscussed tool that can help address all of these issues: taking a scalpel to medical bills. The case for healthcare cost reform extends beyond lowering costs for households and reducing federal healthcare expenditures; reducing healthcare cost growth can deliver a wide swath of macroeconomic benefits. Because of the sheer size and reach of the healthcare sector, reducing healthcare cost growth can make a sizable dent in inflation, support the labor market, reduce the deficit, and lower interest rates.
The government already plays a large role in the healthcare sector through its various authorities, regulations and its sizable role as a purchaser of healthcare services, giving it a strong hand in reducing prices in both the public and private sector. Reforming perverse payment incentives in Medicare, stronger antitrust enforcement, and removing barriers to the supply of healthcare services can all help combat healthcare inflation. Just as healthcare cost control played a role in the economic boom of the 1990s, adopting these policies and reducing healthcare inflation could help deliver another era of macroeconomic success today.
The Macroeconomic Benefits of Lower Healthcare Cost Growth
The importance of the healthcare sector to macroeconomic outcomes stems from a simple fact: it is one of the largest sectors of the economy. Healthcare comprises a large portion of consumer expenditures, labor compensation, and federal expenditures. This outsized influence means that healthcare prices have a significant impact on a wide range of macroeconomic outcomes.
The clearest example of healthcare’s importance to the macroeconomy is in inflation. Aggregate inflation indices are constructed by taking weighted averages of individual price changes. For example, the Personal Consumption Expenditures (PCE) Price Index (the Fed’s preferred measure of inflation) is an expenditure-weighted average of price changes of items in the PCE basket, which includes goods and services purchased by and on behalf of households.[1]
For policymakers interested in reducing overall inflation, it therefore makes sense to prioritize reducing inflation in sectors that have a large expenditure share in the PCE basket. By that criteria, healthcare is an obvious sector to target. Healthcare services made up 13.8% of PCE in 2024, the second-largest component behind shelter.[2] Lowering healthcare inflation would have a commensurate impact on aggregate inflation.
Lower inflation would unlock further macroeconomic benefits. While inflation management is traditionally thought of as the responsibility of the Fed, controlling inflation through methods other than monetary policy means that less of the onus is on the Fed to keep rates high. On the margin, lower inflation would allow the Fed to loosen monetary policy, helping boost investment and ensuring that the labor market remains strong. As I argued in my series on the 1990s boom, these three macroeconomic themes—a strong labor market, rapid investment, and low inflation—are all critical to creating the conditions for productivity growth.
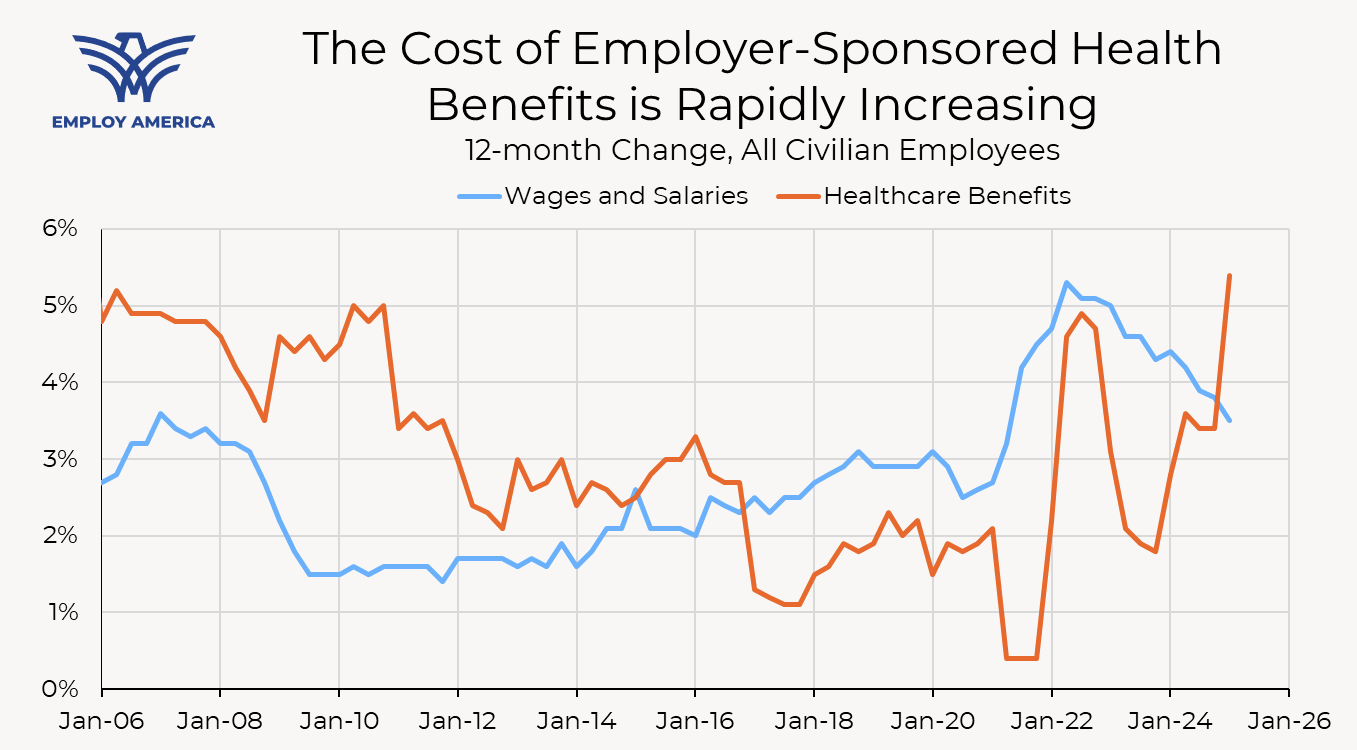
Healthcare also plays a special role in the labor market. Nearly 75% of workers aged 18 to 64 receive health insurance benefits from their employer, and almost another 15% are covered as a dependent under someone else’s employer. This results in an effective “head tax” on employment that depresses wages and employment. As of March 2025, health insurance benefits accounted for 7.7% of the total cost of compensation for civilian employees.
When the cost of employer-sponsored health insurance rises, the cost of that head tax rises, and firms respond by reducing their labor demand. Min (2025) uses differential exposure among firms to health insurance mergers to estimate that almost half of the excess job loss among non-college-educated workers in the US (compared to Canada, which has national health insurance) is attributable to the rising cost of employer-sponsored health insurance. In a similar paper, Brok, et. al (2024) find that rising costs from hospital mergers lead to declines in labor income and employment, especially among lower- and middle-income workers.
This is especially relevant in the current context as the cost of health insurance benefits is growing at its fastest rate in 20 years while the labor market softens. With hiring rates at 2008 levels and the unemployment rate starting to creep up (the Fed projects that the unemployment rate will remain above its long-run level for at least the next couple of years), the last thing the labor market needs is for hiring workers to become more expensive.
Source: Bureau of Labor Statistics
Finally, reducing healthcare cost growth is a powerful way of reducing the federal budget deficit. Most of the discussion surrounding healthcare reform focuses on the direct budget savings from reducing federal health expenditures. That’s understandable, given how much the federal government spends on healthcare. However, reducing expenditures is not the only way that healthcare cost reform can reduce the deficit. If the cost of employer-sponsored health insurance falls and labor income rises through higher wages or employment, tax revenue also rises. If inflation falls as a result of slower healthcare price growth and the Fed is able to lower interest rates (on the margin), the cost of servicing the federal debt falls. When it comes to budget deficit reduction, healthcare cost reductions are a triple threat: lower inflation, lower interest rates, and lower debt.
Understanding Healthcare Inflation Statistics
To understand how healthcare reforms might affect healthcare prices, it helps to understand the healthcare prices indices. Specifically, I will focus on the PCE Price Index, since it is the relevant measure of inflation for monetary policy. The majority of component-level PCE prices are simply their CPI counterparts (for example, the PCE price index for Recreational Books is simply the CPI for Recreational Books). A smaller share of components of the PCE price index use Producer Price Index (PPI) data. Healthcare services is one of those components.
The decision to use the PPI as the source data for healthcare PCE prices is more than a mere technicality. The PCE Price Index measures price changes for goods and services consumed by households, which is different from the goods and services purchased by households. Unlike the Consumer Price Index, which tracks prices paid by private insurance companies and individuals, the PPI additionally tracks payments by Medicare Part A and Medicaid. This is important because over 40% of personal health expenditures are paid for by Medicare and Medicaid.[3] Including those prices is crucial to understanding the overall cost of healthcare.
Another important consideration when using the PPI data is how the BLS defines a price change in the PPI. The PPI takes a sample of medical services and tracks price changes at the individual product level. The definition of “product” is very specific and defined by characteristics such as practice specialty (e.g., family practice), payer type, diagnosis, place of service, name of physician, and service code. This means that a particular service for a particular patient is considered an entirely different product than the exact same service for the exact same patient, if provided in a different facility.
The PPI therefore only recognizes price changes for the same service, for the same type of patient, at the same place of service. For example, suppose there is a diagnostic imaging service that can be provided at the same quality at either a hospital or a standalone imaging facility. One possible policy would be to steer Medicare patients away from hospitals and towards the standalone facilities, without changing prices at either location. The price index would remain unchanged because there aren’t any price changes at the product level, as defined by the PPI.
Most discussions around changes to federal healthcare policy, especially around Medicare, focus on the reduction in expenditures. However, not all reductions in expenditures have a commensurate effect on the price index; only policies that directly lower prices at the product level (as defined by the price index) are likely to yield meaningfully lower measured inflation.
Despite that, healthcare reforms that are measured as quantity reductions (either by inducing switches from high-price to low-price services, as in the mammogram example, or reducing spending on unnecessary or fraudulent services) are still worth pursuing. For example, slowing the cost of healthcare expenditures is still likely to slow the growth rate of employer-sponsored health insurance and yield labor market benefits, even if the direct inflationary effect is negligible.
Diving Into the Subindices
The PPI data are, for some components, further disaggregated into sub-indices by payer type. For example, the PPI for Offices of Physicians (which is the source data for the PCE Price Index for Offices of Physicians) is disaggregated into indices that track prices at Offices of Physicians for Medicare patients, Medicaid patients, private insurance patients, and other patients.
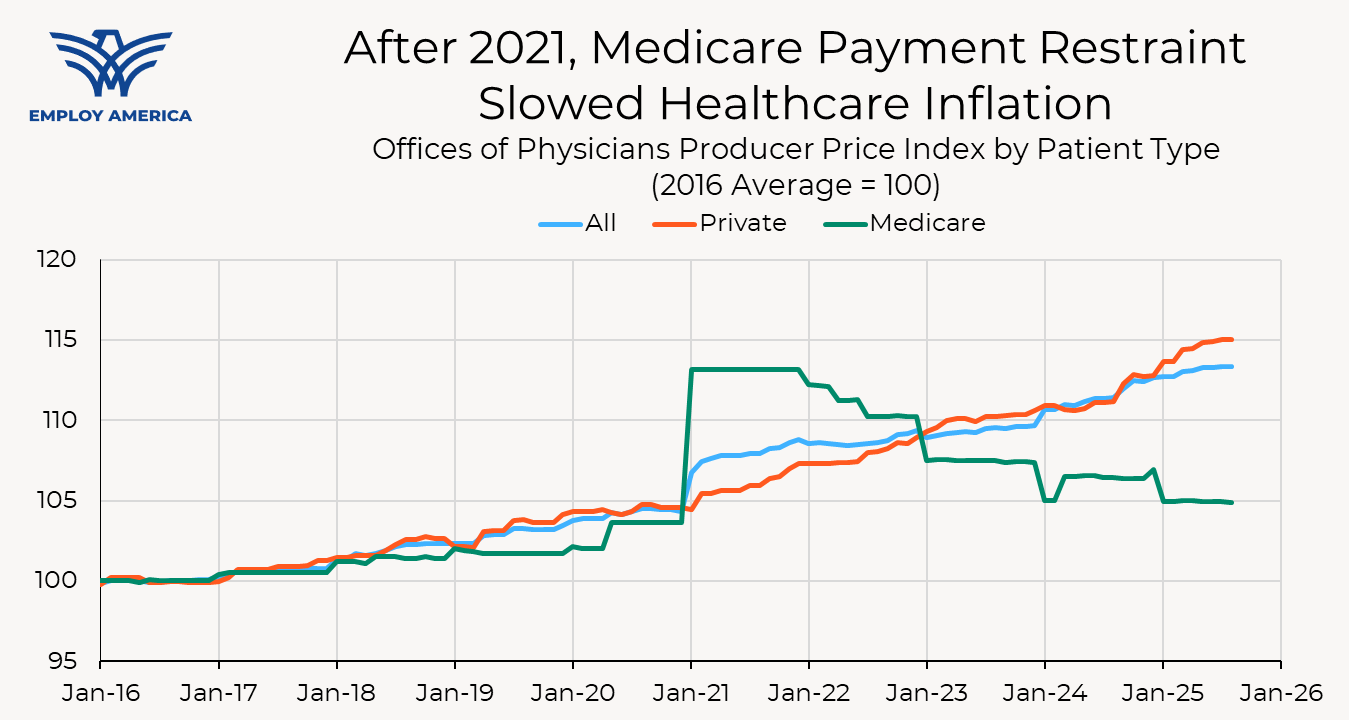
The PPI subindices for Medicare patients trace out the history of Medicare payment policies. Take, for example, the Medicare patient subindex for Offices of Physicians, which exhibits abrupt increases and decreases. Those changes can be traced back to changes to the Physician Fee Schedule (PFS), which sets payment rates for physician services, generally in January.
Source: Bureau of Labor Statistics, Author’s Calculations
For example, in January 2021 Congress extended the temporary pause of the Medicare sequester (a 2% across-the-board reduction to physician payment rates) and gave physicians a bonus payment to mitigate the economic effects of the Covid-19 pandemic, resulting in a sharp increase in the price index for Medicare payments. Then, throughout 2022, the Medicare index declined as Congress phased the Medicare sequester back in. At the beginning of 2023, the Medicare price index dropped as the sequester was fully reinstated and bonus payments for physicians were phased-out. The index fell again in January 2024 when the Center for Medicare and Medicaid Services (CMS) reduced physician payments, then rebounded in March after Congress increased payments until 2025.
While CMS reduced physician payments for 2025, Congress did include a 2.5% increase in physician payments for 2026 under the most recent reconciliation bill. The congressional boost in payments, coupled with another statutory update for physician payments in 2026 and a budget neutrality adjustment, means CMS is proposing a year-over-year increase in physician payments for the first time in six years.[4]
The Importance of Medicare
As mentioned earlier, the PCE Price Index, to a first approximation, is a weighted average of price changes of its sub-indices. The same is true of the PPI. As an example, I will examine the PPI for Offices of Physicians; one could do a similar exercise using the PPI for Hospitals. The PPI for Offices of Physicians can be constructed by taking weighted averages of the changes in its subindices for Medicare patients, Medicaid patients, and so on.[5] While the BLS does not publish the weights placed on each subindex, we can get an estimate of those weights by regressing changes in the PPI for Offices of Physicians on changes in its patient-type subindices.[6]
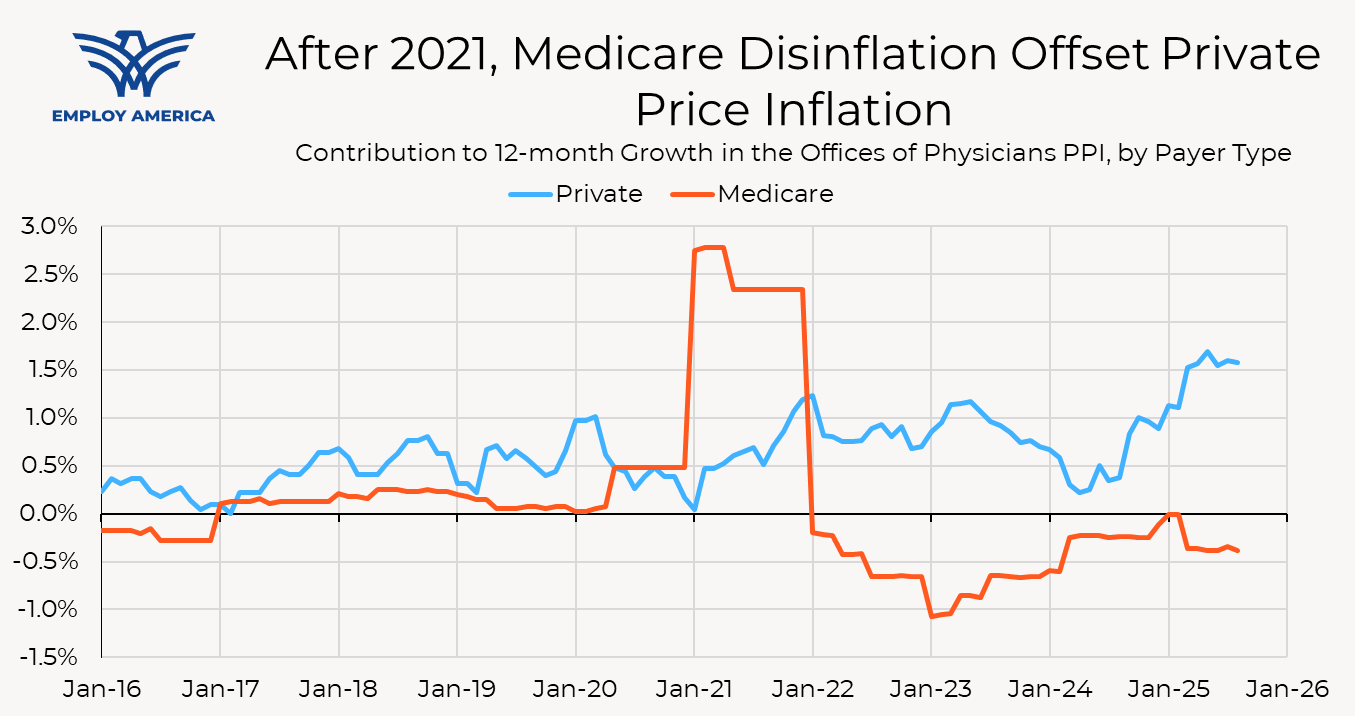
Using these weights, we can break down inflation in Offices of Physicians into contributions from each payer type. In the figure below, I plot the contribution of the Medicare patients and private patients subindices to the overall Offices of Physicians PPI. Due to the weight and large swings in Medicare payment policies, the Medicare subindex has played a prominent role in overall Offices of Physicians inflation in recent years. The elevated inflation in 2021 was almost entirely due to COVID-related measures. Between 2022 and 2024, the elevated growth rate of the private payers’ index was almost entirely counteracted by cuts to Medicare payment rates.
Source: Bureau of Labor Statistics, Author’s Calculations
That is just the direct, mechanical effect of changing Medicare prices on healthcare (and, by extension, aggregate) inflation. In addition, there is an indirect effect: Medicare prices also influence private prices. Medicare’s role as the largest purchaser of healthcare services means that Medicare acts as a quasi-price setter. In fact, 45% of private insurer payments to physicians (by spending) are benchmarked to Medicare reimbursement rates. Clemens and Gottlieb (2016) estimate that a 1% decline in Medicare reimbursements is associated with a 0.35% decline in private prices within two years, and another 0.35% decline in private prices in the long-run.
Changes to Medicare payment rates, therefore, have an indirect effect on inflation by changing private prices. This indirect effect is harder to see in the PPI (and therefore PCE) data because the changes to private prices happen over time, but the magnitude of the indirect effect likely dwarfs the direct effect. Although Medicare is the largest single purchaser of healthcare services, the overall size of the private market is larger. Medicare pricing acts as a fulcrum that policymakers can use to influence pricing in the broader healthcare market.
Where Policy Can Reduce Healthcare Inflation
A full account of how to reform the American healthcare system is beyond the scope of this piece. Addressing other goals, such as health outcomes, equity, and access are beyond the scope of this piece. Here we will highlight a few areas where policy can be especially effective at reducing healthcare price inflation.
Site-Neutral Medicare Payment Reform
Earlier in this piece, we showed that changes to Medicare payment rates have outsized effects on healthcare inflation. That doesn’t mean that the best policy is to just slash Medicare payment rates until inflation reaches 2% (although policymakers should take care to ensure that Medicare payment growth does not generally balloon out of control). There are, however, targeted reforms to Medicare payments that can deliver significant disinflation without compromising patient outcomes or safety.
There are a number of procedures that are provided in both hospital and non-hospital settings (such as physicians’ offices and ambulatory surgical centers), but can be safely and effectively performed outside the hospital. However, Medicare pays higher rates for these services if they are performed in hospitals, and the differential in payments can be quite large. For example, for a typical clinic visit in 2017, a physician outside of the hospital system would receive a “non-facility” payment of $109.46. For the same service, an hospital-owned outpatient department would receive a “facility rate” total payment of $184.44, approximately68% higher.
One possible payment reform is to change the Medicare payment system so that hospitals are paid the same rate as lower-cost physicians’ offices and ambulatory surgical centers for services where patient outcomes do not benefit from being provided in a hospital setting. In its 2014 Report to Congress, MedPAC identified 66 services where site-neutral payments would be appropriate, based on the fact that these services were most commonly provided in physicians’ offices. The Center for a Responsible Federal Budget (CRFB) estimated that implementing site-neutral Medicare payments for those services would reduce Medicare spending by $153 billion over ten years.
Building on the work by CRFB, we estimated that implementing site-neutral Medicare payments for the 66 services identified by MedPAC would result in a direct effect of a 7bp reduction in the core PCE Price Index. In addition to the direct effect of reducing Medicare hospital payment rates for those services, there would be an indirect effect on private prices as well. If the finding from Clemens and Gottlieb (2016) (that a 1% change in Medicare reimbursements is associated with a 0.35% decline in private prices within two years, and another 0.35% decline in private prices in the long-run) holds, we estimate that the indirect effect on private prices would result in an additional 9bp reduction in the PCE Price Index over two years and 19bps over the long-run.
Promoting Competition
In recent years, the healthcare sector has become increasingly concentrated. Levinson, et. al (2025) find that “one or two health systems controlled the entire market for inpatient hospital care in nearly half of metropolitan areas in 2023.” Between 2012 and 2022, the share of physicians associated with hospital systems increased from 29% to 41%. Increased industry concentration is not just a problem on the provider side; health insurers are also becoming increasingly consolidated. Vertical integration is also a problem, with insurance providers integrating with service providers.
This concentration has contributed to healthcare price inflation. Brot, et. al (2024) find that anticompetitive mergers resulted in price increases of over 5 percent. Cooper, et. al (2025) find that hospital acquisitions of physician practices lead to substantial price increases on both the hospital and physician side, with no increase in the quality of care. Min (2025) finds that insurer mergers accounted for around one-fifth of the increase in premiums for employer-sponsored health insurance between 1999 and 2019.
Enhancing the capacity of antitrust agencies to block anticompetitive mergers and acquisitions is one tool policymakers can use to combat healthcare price inflation. Brot, et. al (2024) find that despite the hundreds of anticompetitive hospital mergers that occurred between 2002 and 2020, the FTC took enforcement actions against just thirteen of those mergers. Gaynor (2020) provides a deeper treatment of what policymakers can do to enhance the power of the DOJ and FTC to combat industry concentration in the healthcare sector, including increased funding and removing rules that exempt small transactions and nonprofit organizations from antitrust enforcement.
Beyond stronger antitrust enforcement, policy reforms should aim to remove the incentives to consolidate in the first place. The aforementioned payment discrepancy between outpatient settings is one reason why hospitals acquire physician offices, leading to higher prices not only through site-based billing but also through higher industry concentration. Site-neutral Medicare payments would go a long way towards reducing the incentives for hospitals to purchase physicians’ offices, but Medicare is only part of the story. Policy could go further and enforce site-neutral payments in the private sector instead of relying on the knock-on effect of Medicare pricing on private prices.
Supply-Side Reforms
Finally, policymakers should look at ways to improve the productive capacity of the healthcare sector. Since 1999, the number of hospital beds has fallen from 3.00 to 2.32, a decline of 23%. 80 million Americans live in areas with a shortage of primary care physicians, and the Association of American Medical Colleges projects that the physician shortage will grow to 86,000 by 2036.
As Mansell (2025) shows, policy restrictions on expanding supply in the healthcare sector are partly to blame for doctor shortages in the healthcare sector. Policies such as requiring Certificates of Need for new hospital facilities and restrictions on Medicare funding for primary care physician training have resulted in a dearth of hospitals and primary care physicians, just as the aging of the population is shifting more demand towards healthcare services. Mansell (2025) provides a fuller treatment of potential policies that could be used to expand the supply of medical services, including reforms to residency financing to encourage entry into primary care rather than specialities, expedited licensure processes for immigrant physicians, and elimination of Certificate of Need laws. Expanding the supply of hospitals and doctors would also reduce concentration in the healthcare sector.
Conclusion
Due to its sheer size and widespread presence in the labor market, the healthcare sector exerts outsized influence on macroeconomic outcomes. Reducing healthcare cost growth can meaningfully improve the inflation outlook, allowing the Fed to pursue marginally more accommodative monetary policy. Reducing the cost of employer-sponsored health insurance benefits can help maintain employment levels and wage growth.
The federal government is well-positioned to influence the trajectory of healthcare prices. The government literally sets prices for a large share of health care services, and exerts some influence over the prices of the remainder. Stronger antitrust enforcement and removing the incentives for health care providers to merge can counteract the trend of consolidation and higher prices that has happened in recent years. Policies that were implemented to limit the supply of healthcare services can be lifted to expand the productive capacity of the sector.
Healthcare cost control played an important role in the macroeconomic success of the 1990s, and it could play a role in delivering rapid productivity growth, low and stable inflation, and full employment today.
Endnotes
The PCE Price Index is calculated using a Fisher ideal price index. The Fisher index is calculated as a geometric mean of the Laspeyres and Paasche indices, which themselves are calculated by taking weighted averages of price changes; the Laspeyres index weights component-level price changes using lagged expenditure weights, and the Paasche index weights component-level price changes using current expenditure weights. Over short periods of time, expenditure shares are little-changed, and the Fisher, Laspeyres, and Paasche indices are all similar enough for our purposes in this piece.
Includes health care services, medical insurance, worker’s compensation, but subtracts medical foreign expenditures and healthcare sales of nonprofits.
The year-over-year increase is specifically referencing the change in the conversion factor, which is the dollar amount that CMS uses to convert the relative value unit of a medical service into a payment.
The PPI uses a modified Laspeyres Price Index. Using an actual Laspeyres index (which weights price changes of individual components by their base-period expenditure shares) is a good approximation.
I regress 12-month changes of the PPI for Offices of Physicians on 12-month changes in the subindices for private payers, Medicare patients, Medicaid patients, and other patients, without a constant, using data from January 2016 to the present. The coefficients on the subindices are approximately 12%, 25%, 46%, and 17%, respectively. Limiting the sample size to more recent months delivers similar results.
The link has been copied!
Your link has expired. Please request a new one.
Your link has expired. Please request a new one.
Your link has expired. Please request a new one.
Great! You've successfully signed up.
Great! You've successfully signed up.
Welcome back! You've successfully signed in.
Success! You now have access to additional content.