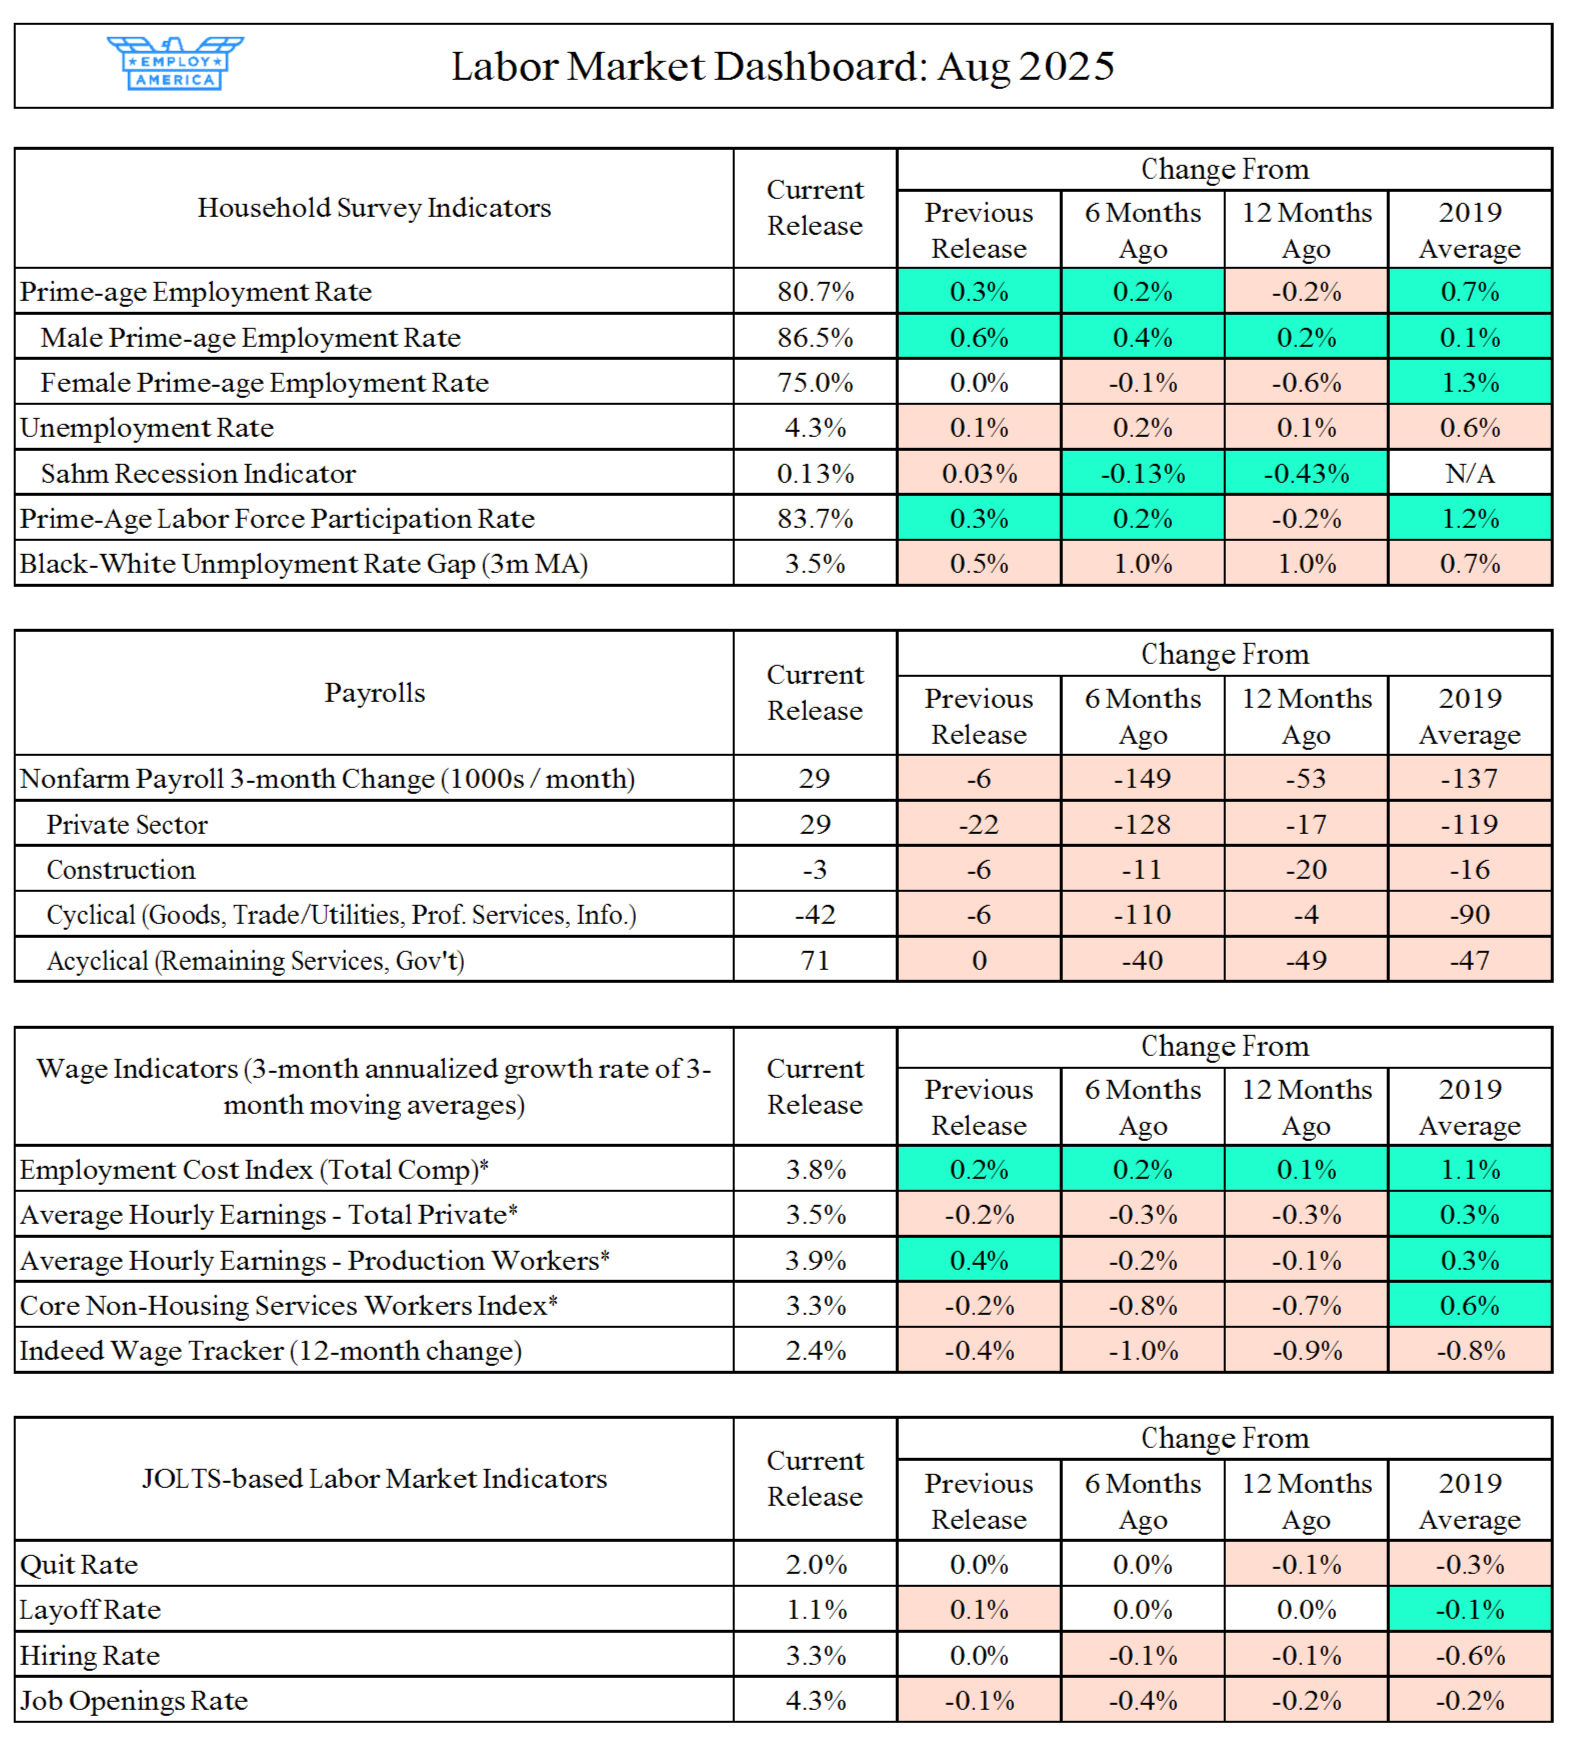
The labor market added 22,000 net jobs in August, with large negative revisions to the previous two months. Job growth was revised by and -27,000 and +6,000 for June and July, respectively. June’s revision now gives us our first negative jobs print, with nonfarm payrolls falling by 13,000 in June. Job growth has averaged 29,000 jobs per month over the past three months.
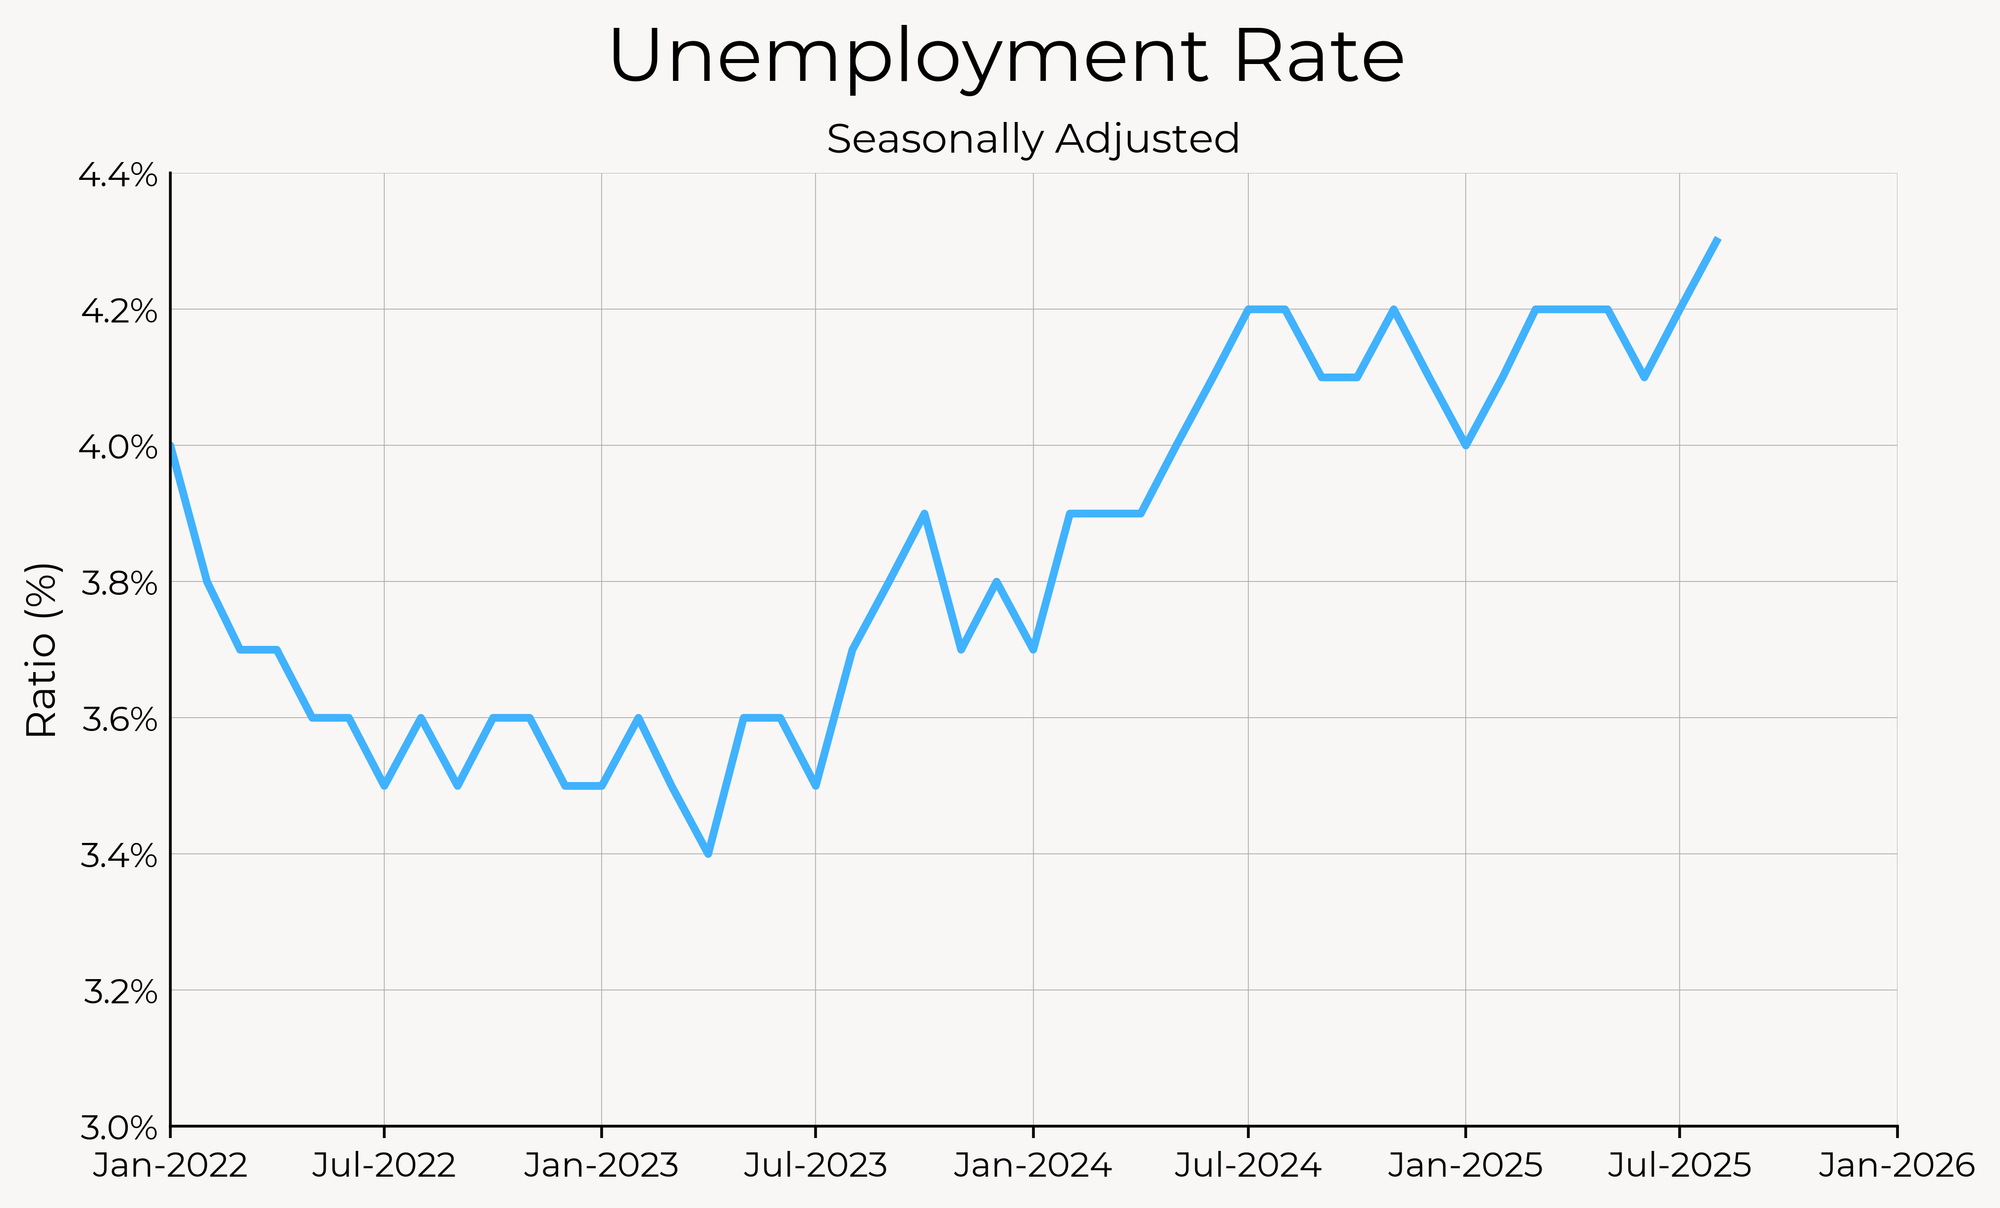
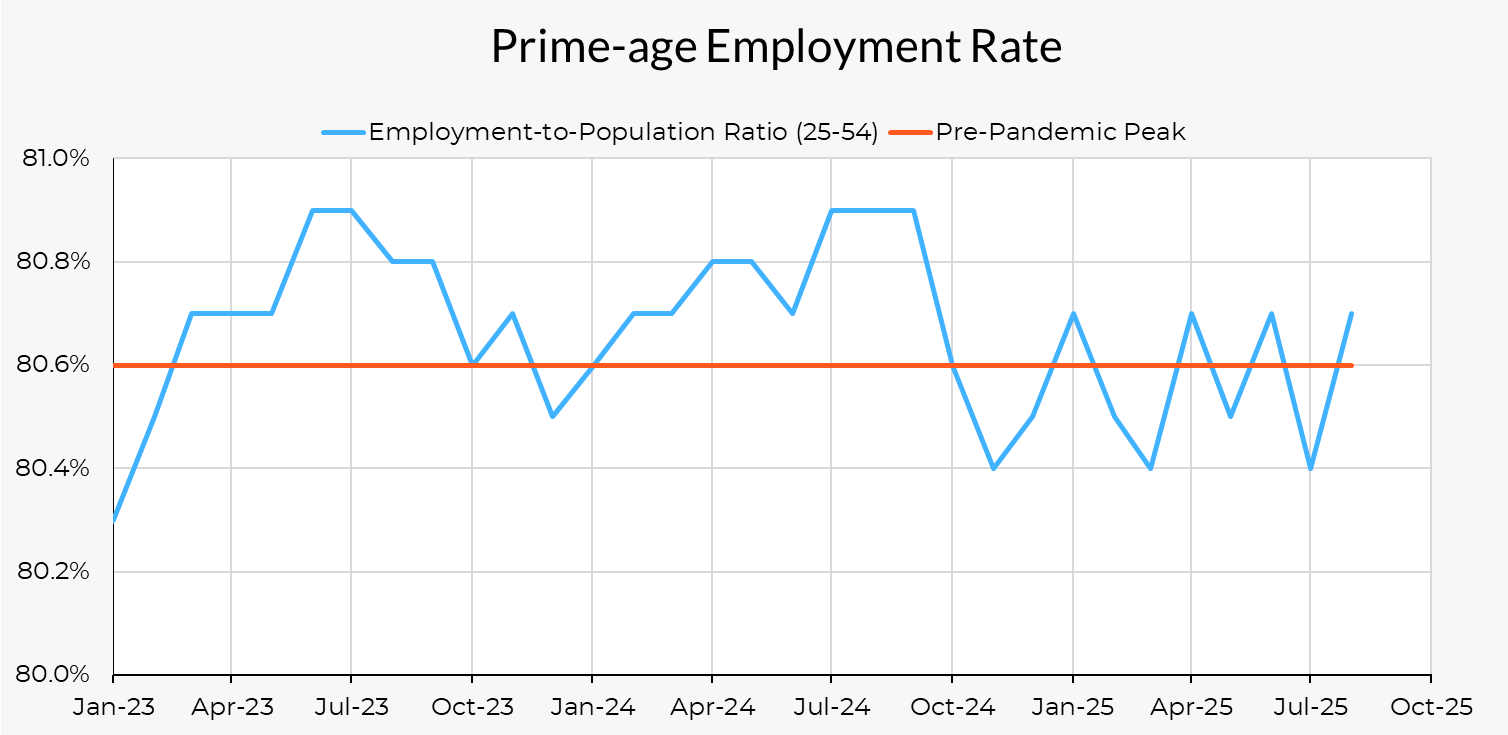
The unemployment rate rose by 0.1pp to 4.3%, and the prime-age employment rate rose 0.3pp to 80.7%. Average hourly earnings fell to 3.69% and JOLTS measures in the July data were mostly unchanged.
This is an soft report, with slow payroll growth, and a new cycle high in unemployment. The story of the labor market is still very much a continuation of the previous months: a low-firing, low-hiring labor market and job growth coming from a narrow set of sectors. This month’s data does not show a sharp deterioration (especially if one takes into account the possibility that lower net immigration explains some of the low payroll gains), but a gradual worsening on a number of fronts. Slower hiring is pushing unemployment up, especially among the long-term unemployed, and we’re starting to see outright employment declines among sectors like construction and manufacturing. Employment levels are still stable, so the underlying picture is not as dire as implied by the headline payroll numbers, but things are trending in the wrong direction.
Source: Bureau of Labor Statistics, Author’s Calculations. Red indicates weaker labor market development; green indicates stronger. *Previous month figures for these indicators refer to the as-reported numbers from the previous month, not the previous month’s figure in the current vintage. For an explanation of why, see thispost.
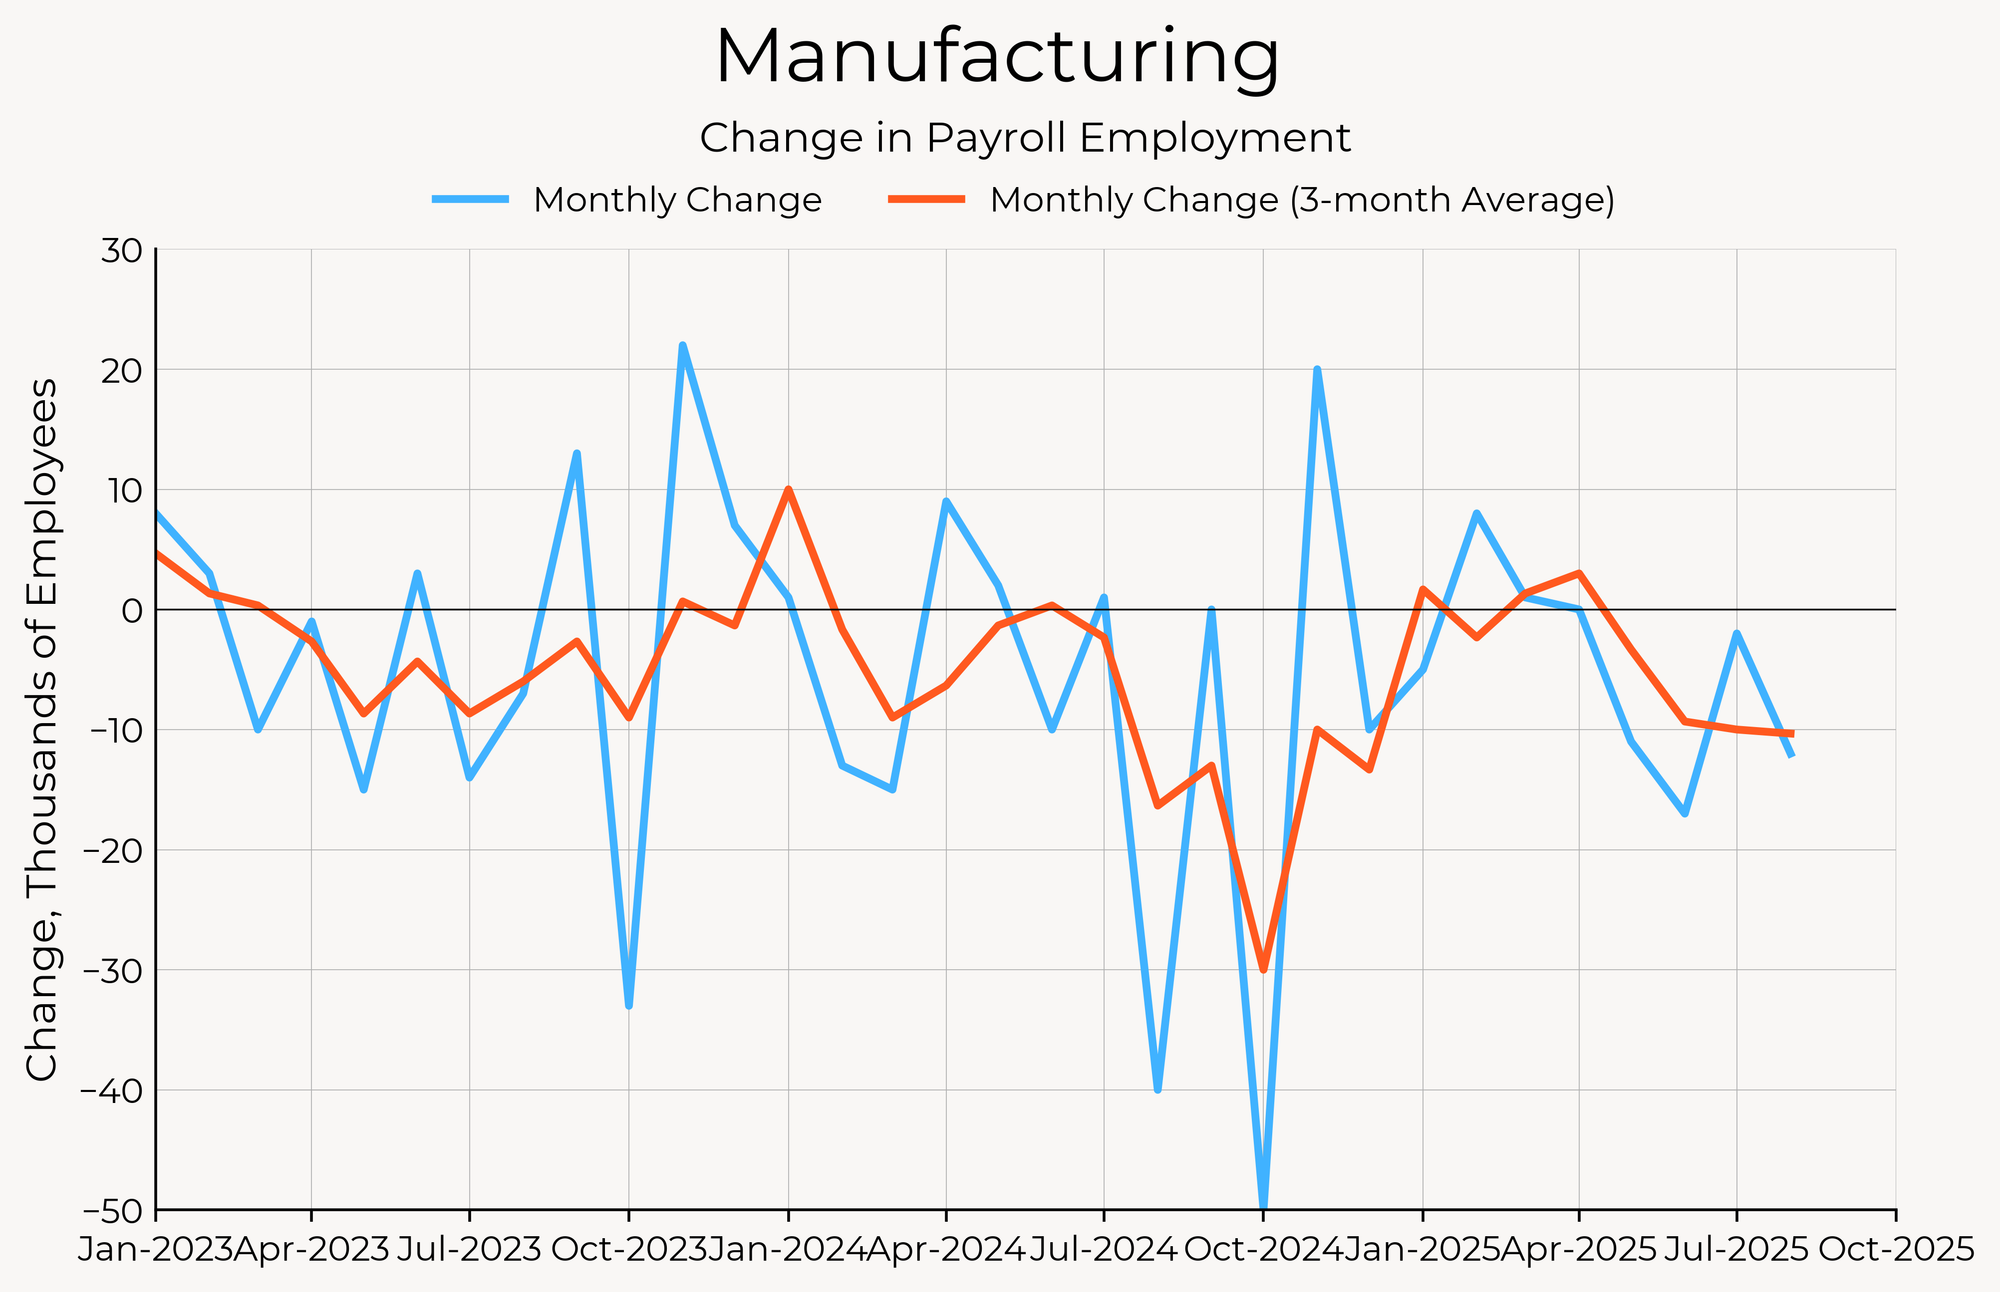
I Was Told There Would Be a Manufacturing Revival?
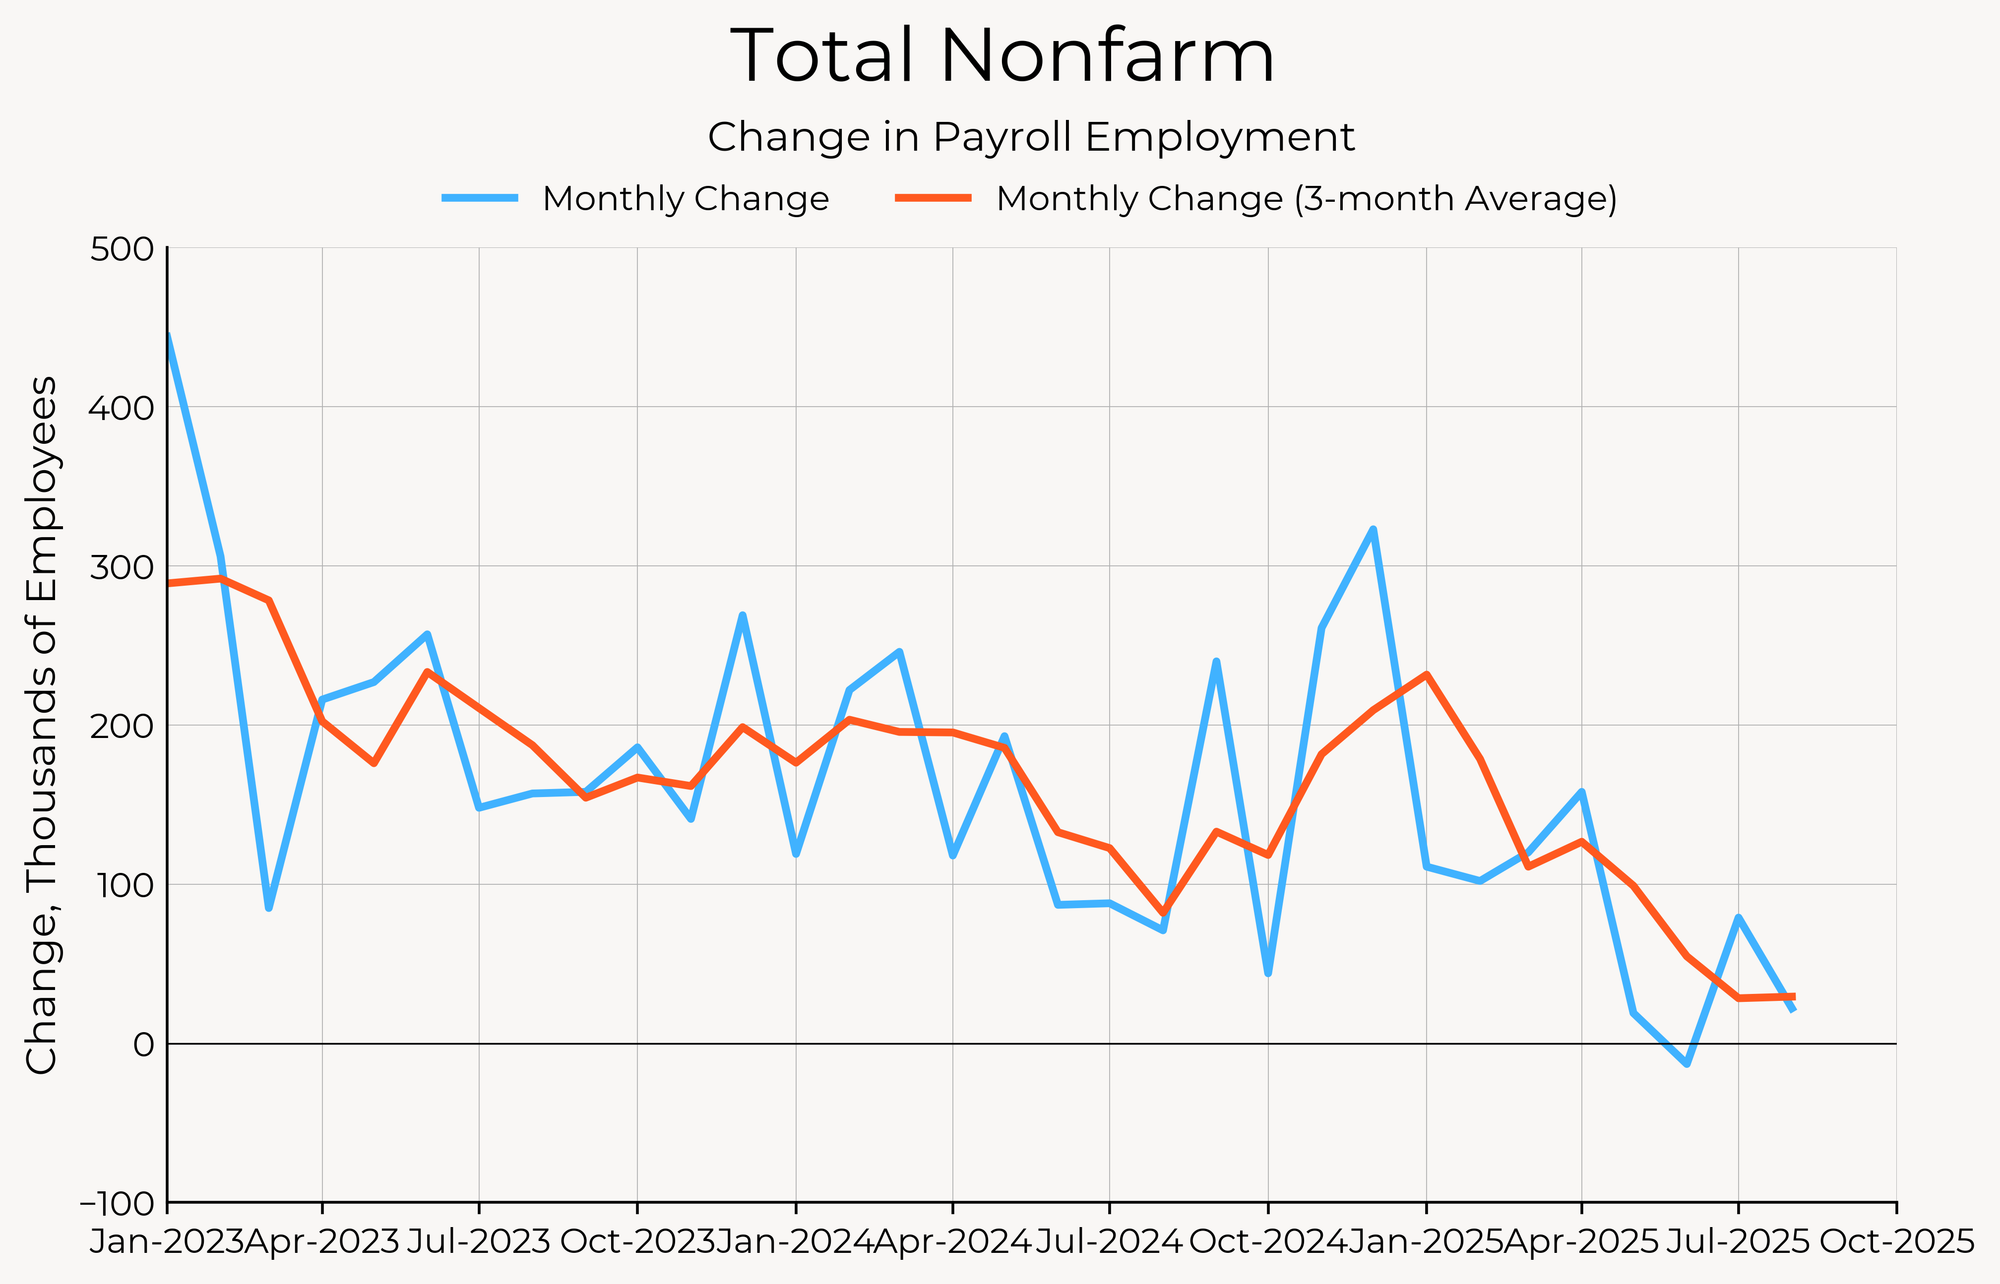
The big news out of this jobs report is the weak nonfarm payrolls print. Nonfarm payroll growth came well under the consensus estimate (+22k vs. +75k est.), and negative revisions to June gave us the first negative month of jobs growth since 2020.
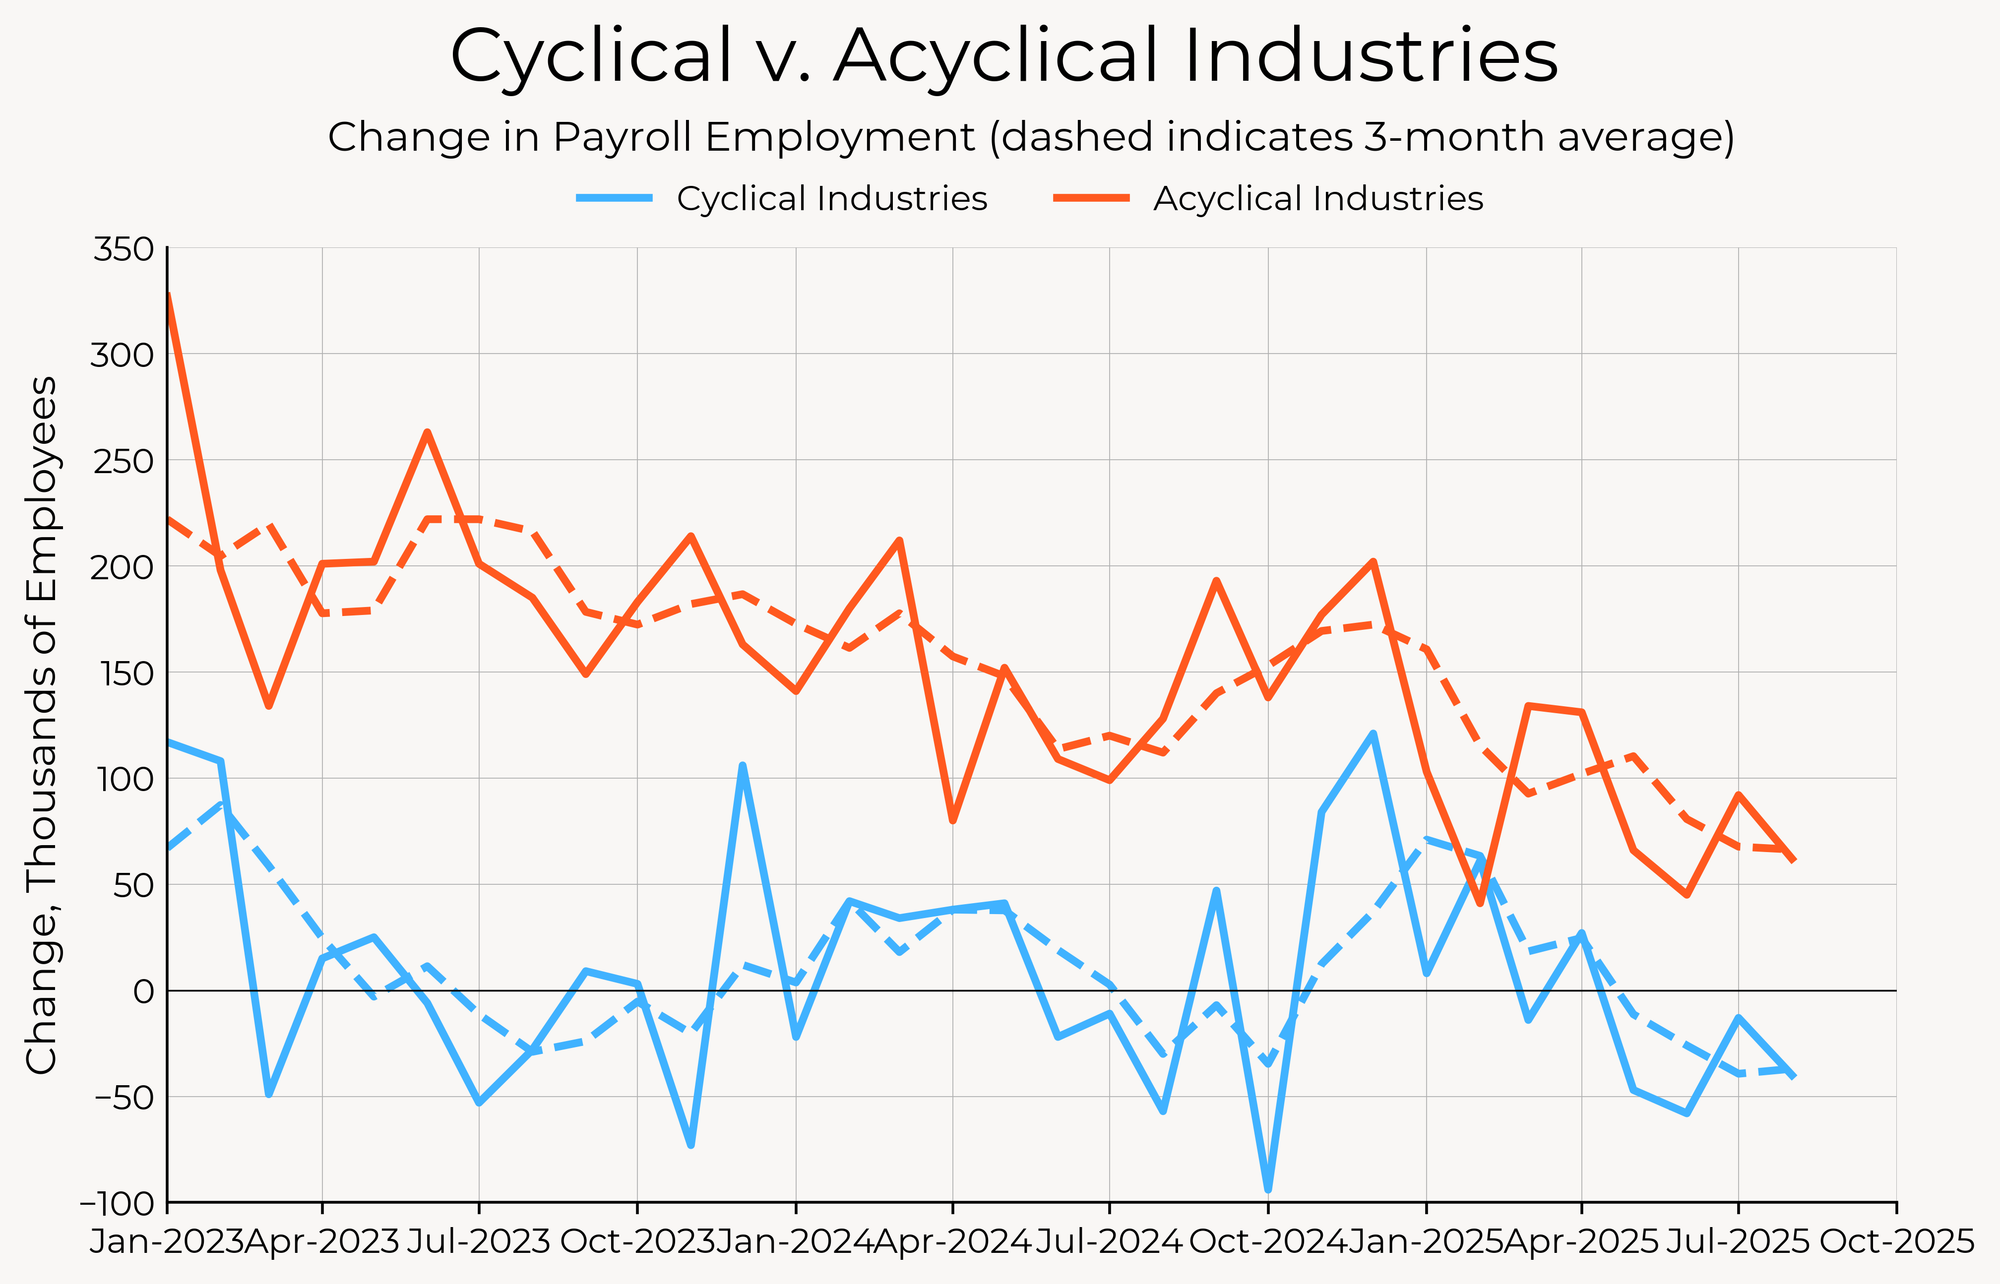
Employment in cyclical industries (goods-producing industries, professional and business services, and trade, transportation and utilities) continues to slide, leaving acyclical industries (education, health services, government, and other services) to pick up the slack. But employment growth in those acyclical industries has also been sliding.
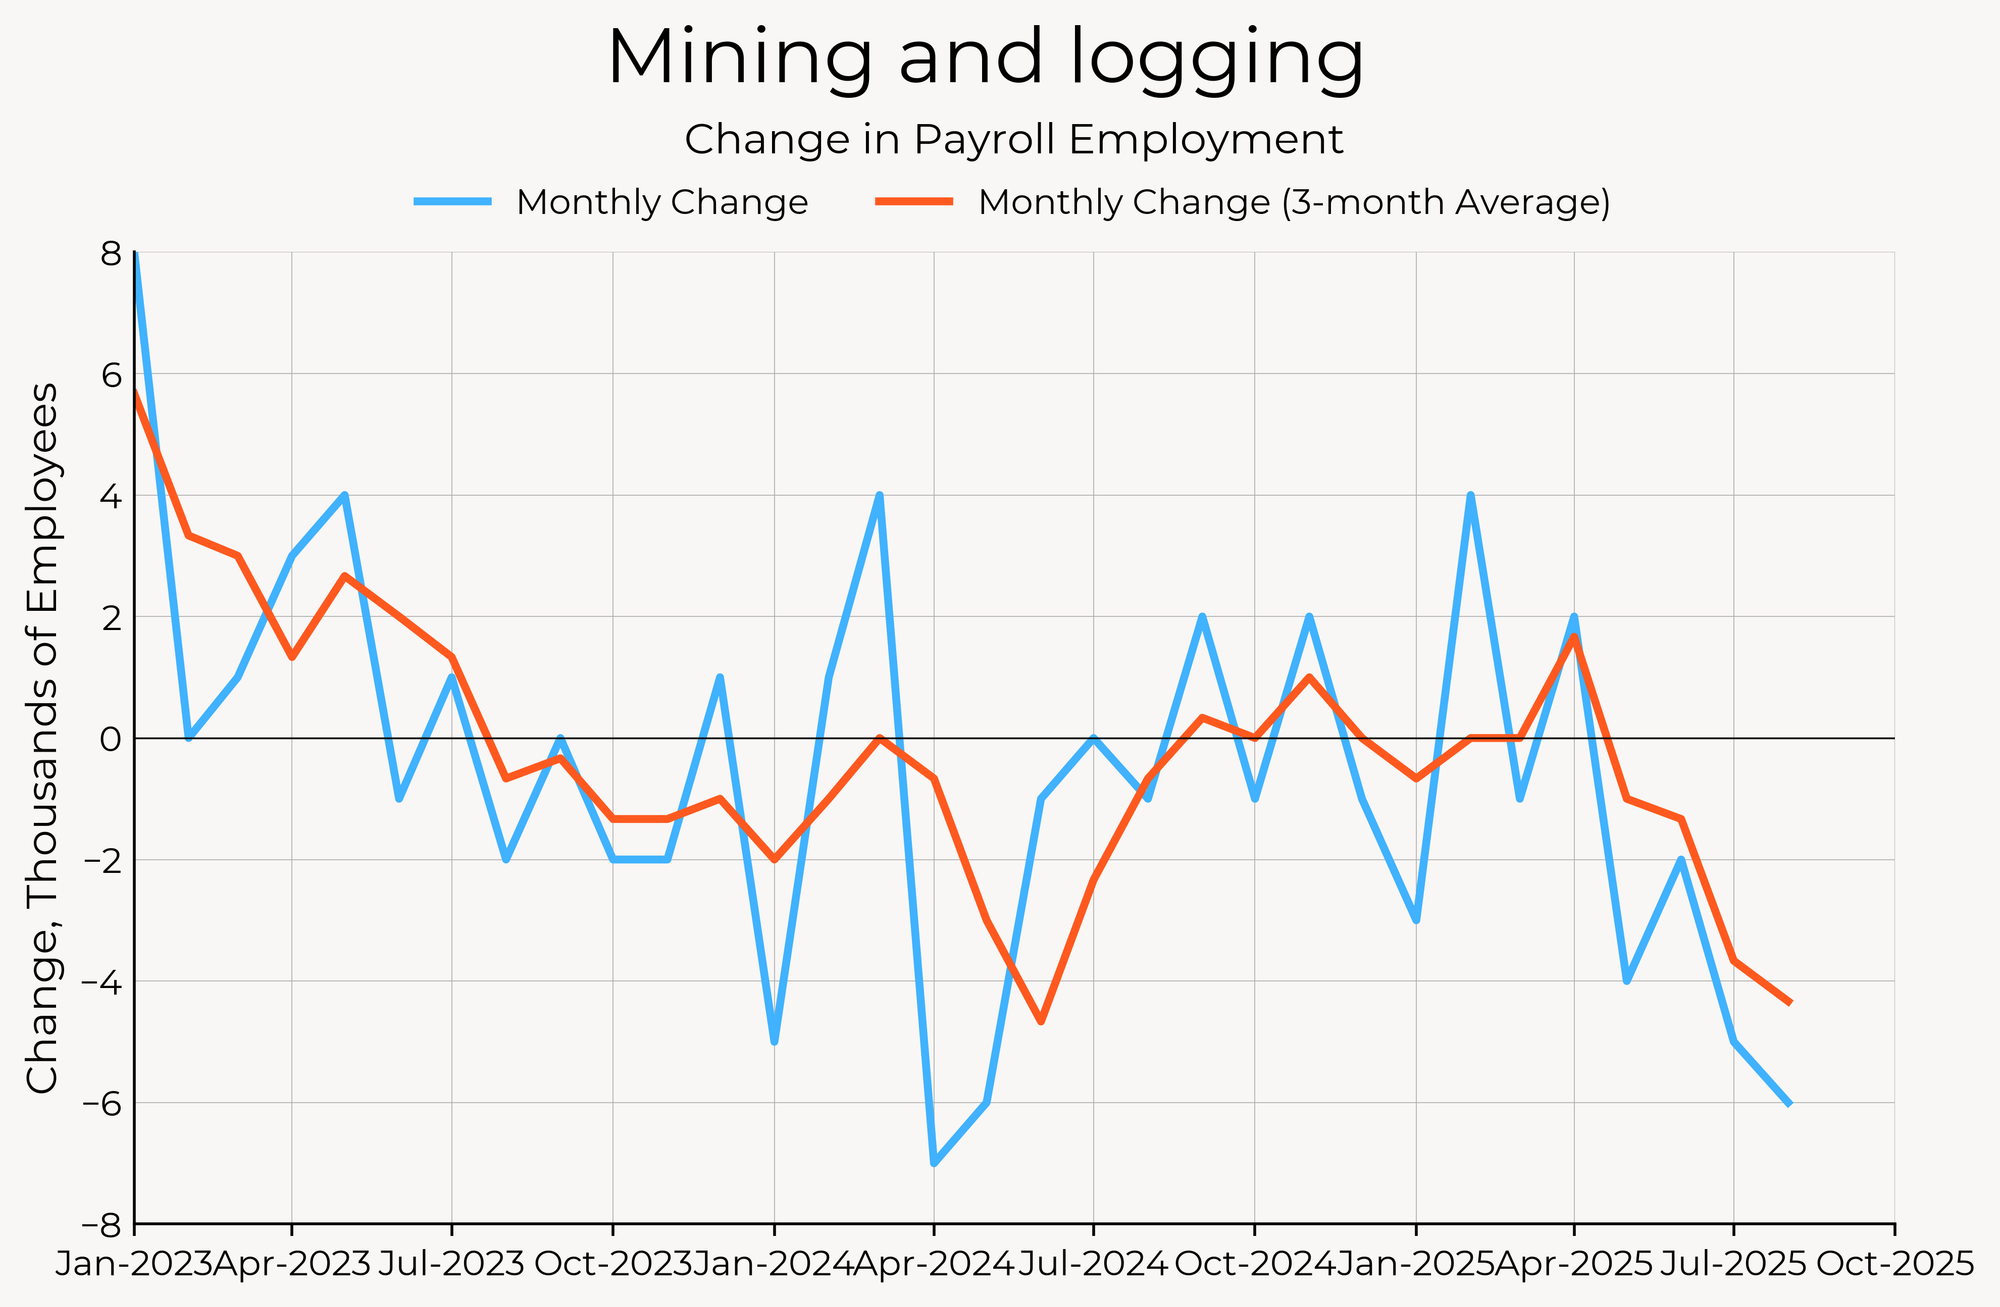
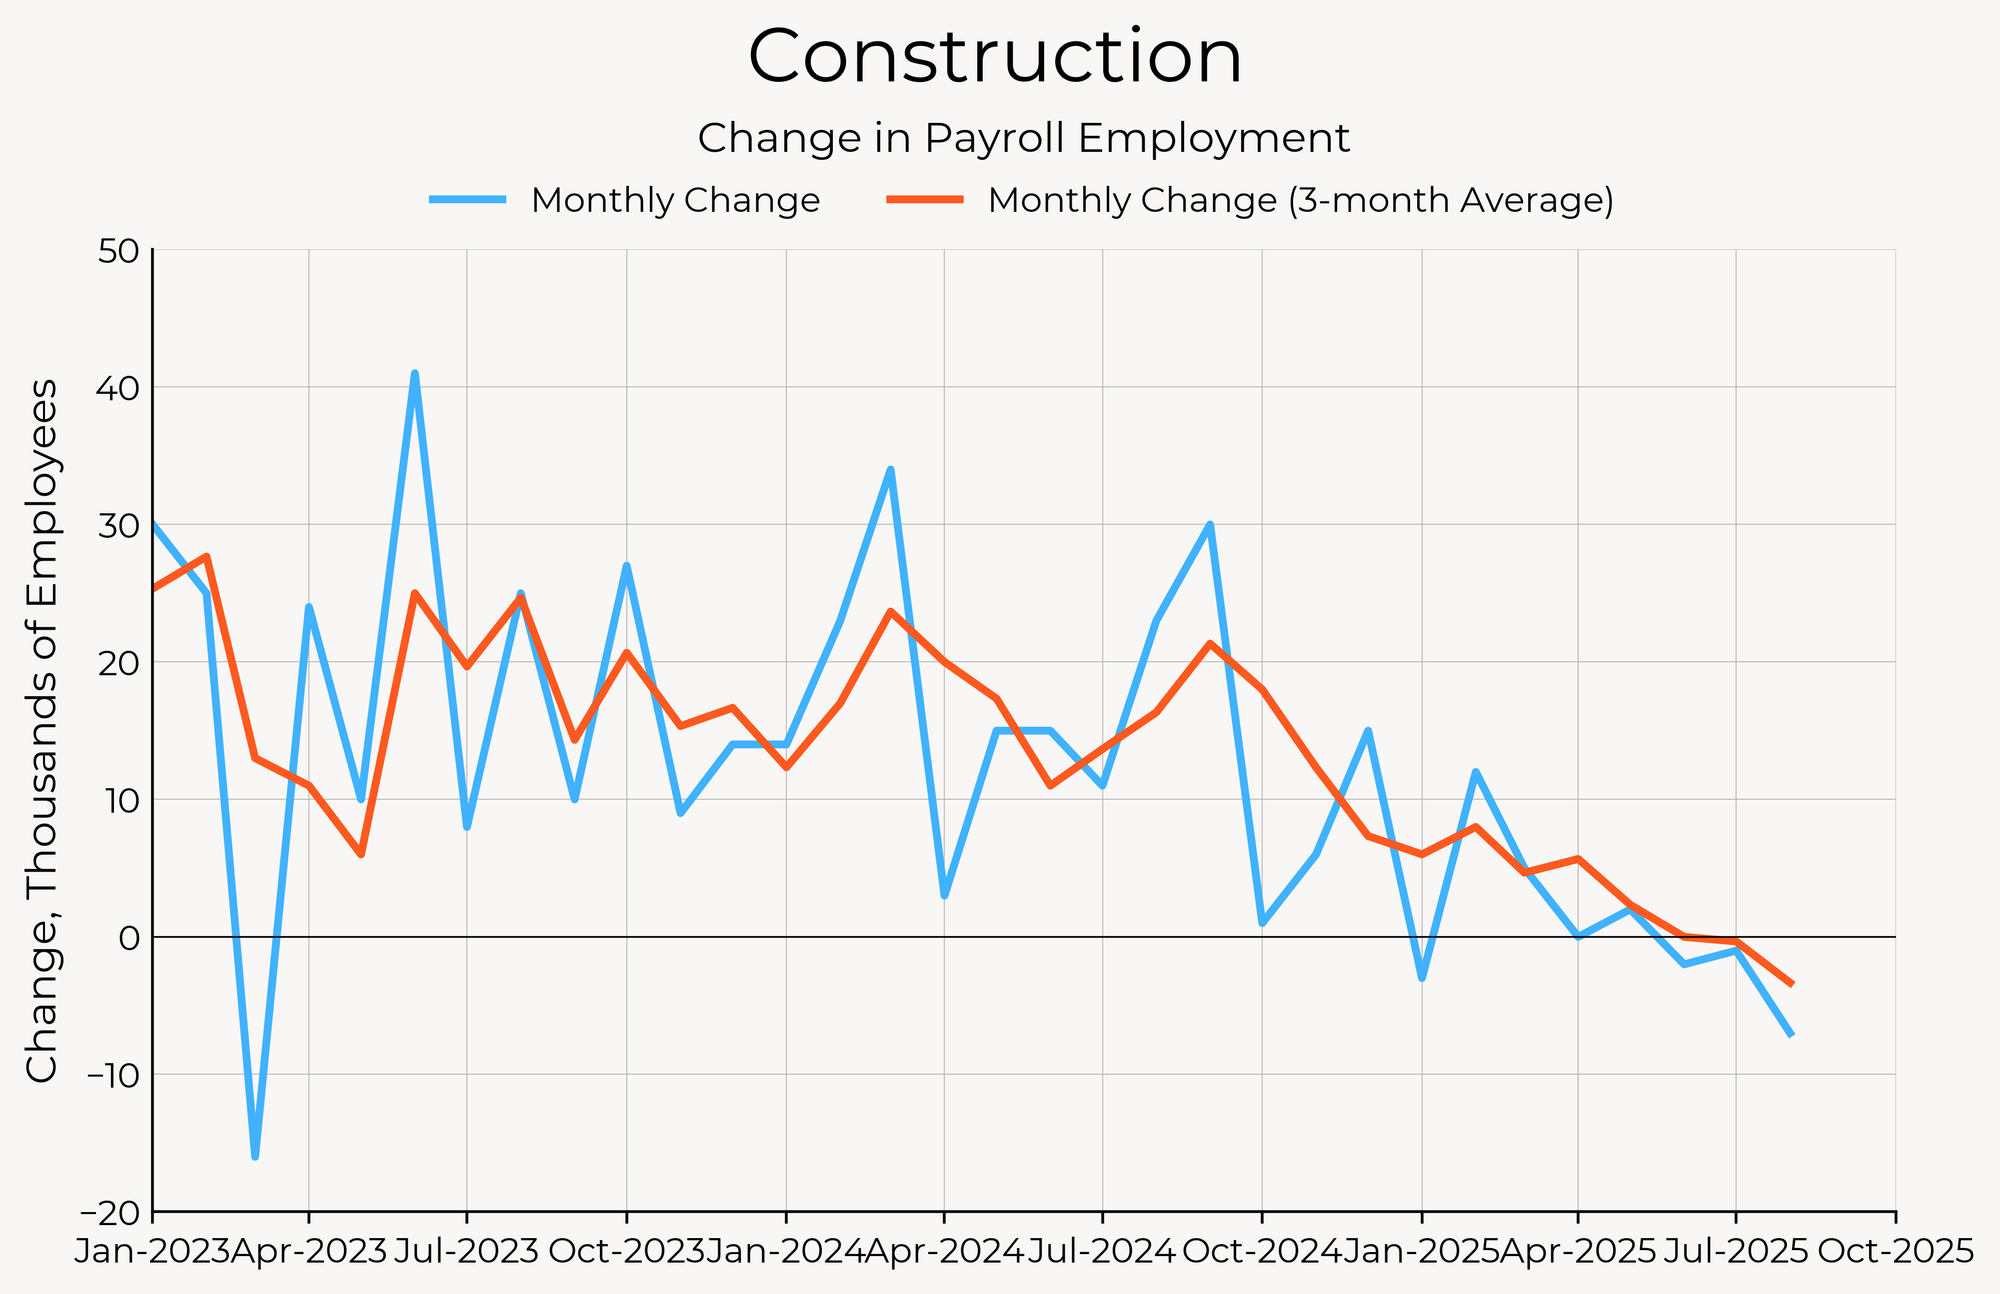
For all the talk of a “manufacturing renaissance,” employment in manufacturing continues to show outright losses. Employment in extractive industries is also falling faster. Construction employment has now switched from stagnating to outright declining as well.
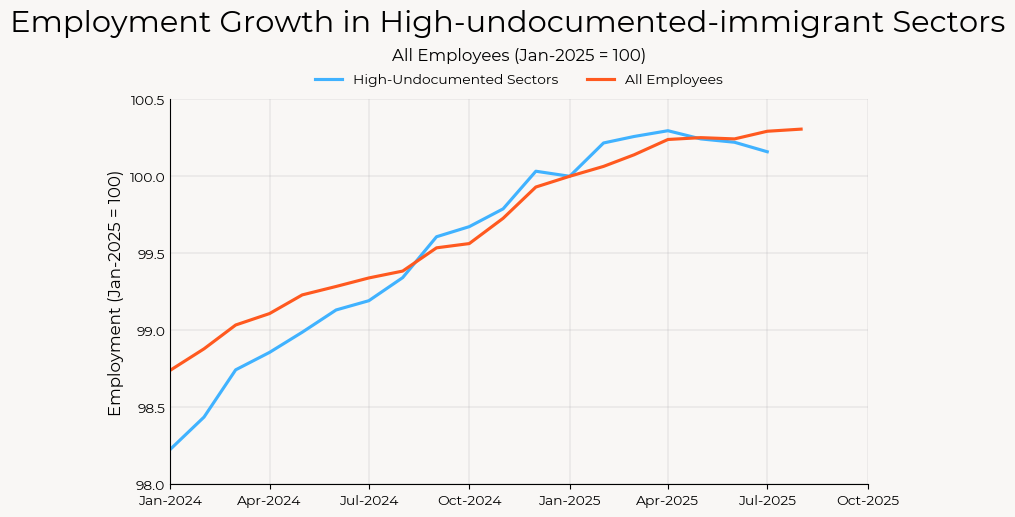
So how much should we worry? One plausible explanation (and one that has some purchase among some members of the FOMC) is that the lower payroll gains are simply the result of lower labor supply coming from lower immigration. It’s difficult to know in real-time whether or not that’s the case (and you cannot rely on measures of native and non-native-born employed workers from the household survey—see Jed Kolko for an excellent explanation of why not), given that undocumented immigration is, by its nature, undocumented.
A few months ago I looked at establishment survey payroll growth in sectors with high rates of undocumented immigrant labor. Back then, I didn’t find any evidence that sectors with high rates of undocumented immigrant labor were seeing slower job growth than the rest of the economy, but that’s since changed with the updated data. Employment in sectors with lots of undocumented immigrants fell between April and July, while overall employment grew.
That’s some suggestive evidence that the lower payroll prints are a story about labor supply. However, it’s a coarse take and should be interpreted with caution. Not all undocumented immigrants make it into the payroll statistics. One of the biggest sectors with high rates of undocumented labor is traveler accommodations, a sector that’s also been hit hard by a fall in leisure travel to the United States.
The Household Survey Still Shows Low Hiring, Low Firing, Treading Water
The household survey is far less dramatic than the establishment survey. The unemployment rate did tick up to 4.3%, consistent with expectations, and is on track to meet the Fed’s projection of 4.5% by the end of this year. But on the whole, the household survey looks more like treading water than falling apart. The prime-age employment rate was up 0.3pp this month, reversing last month’s decline and within the same range it’s been in for the last year.
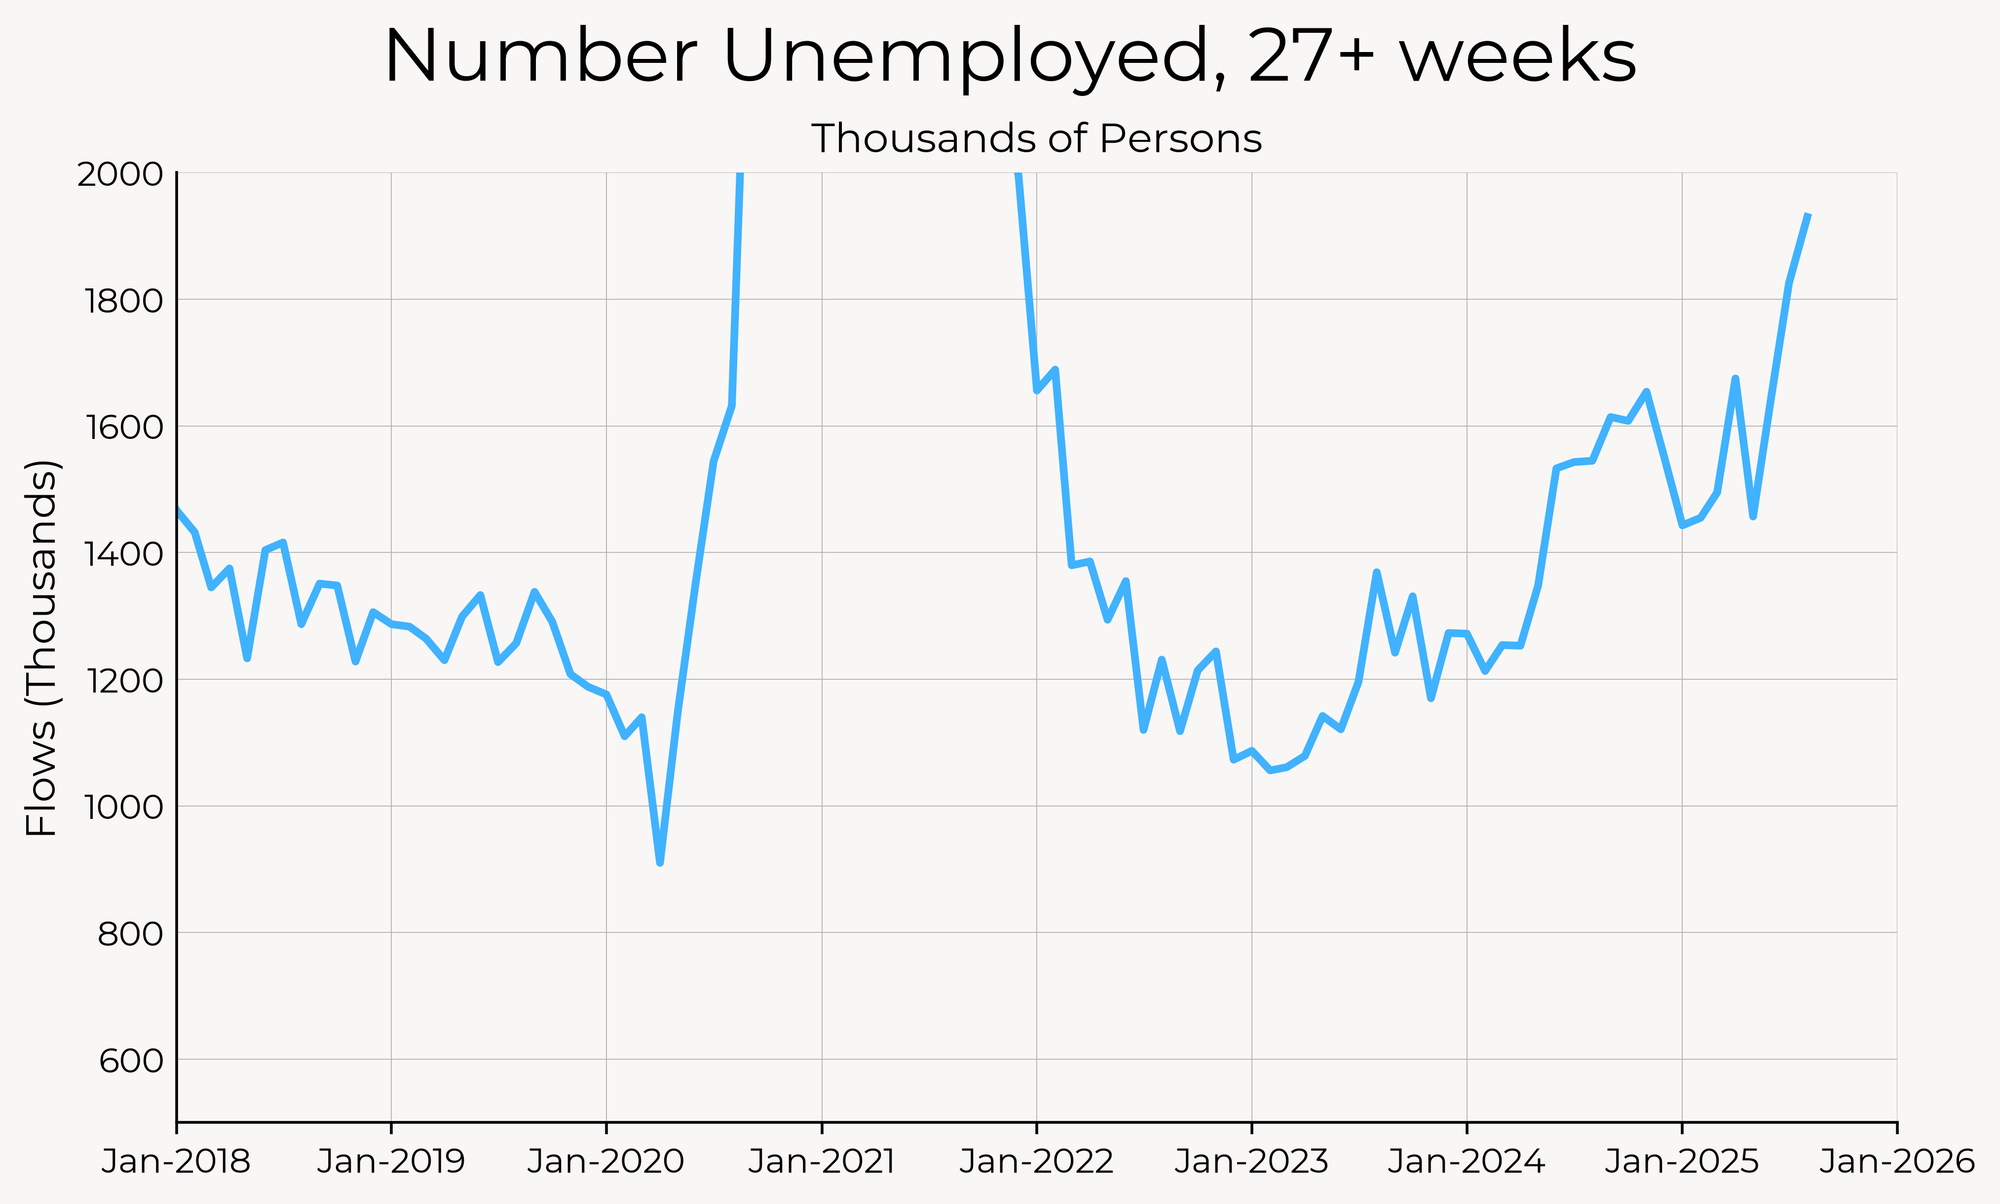
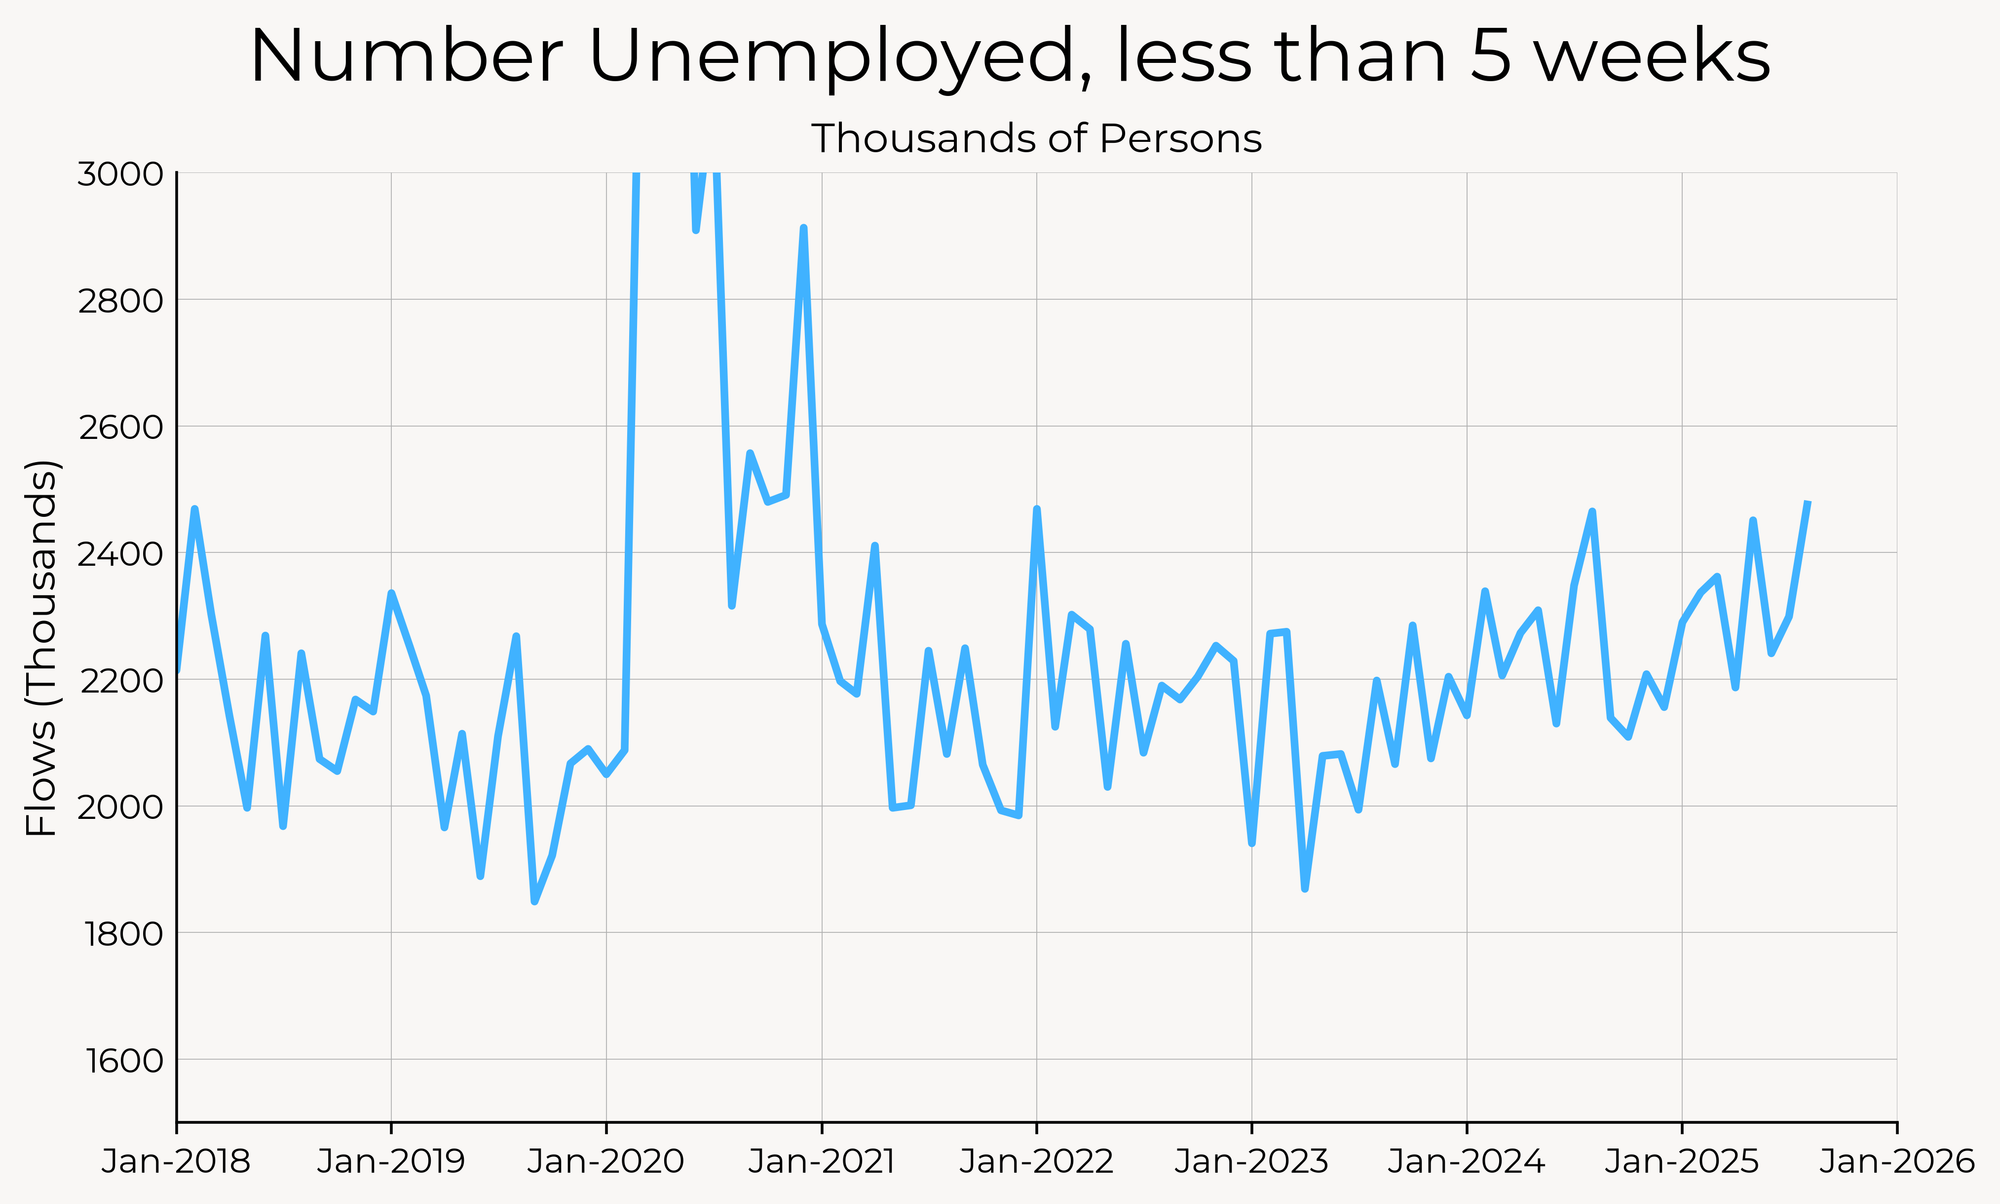
The rise in unemployment is really being felt on the margins of the labor market, among groups that are least attached to employment. Youth unemployment and black unemployment are up. The number of long-term unemployed has increased especially quickly in the past couple of months. The difference in the trajectory of short-term unemployed and long-term unemployed really tells the low-hiring, low-firing story of the labor market. The count of long-term unemployed workers is mostly driven by hiring (or lack of hiring), while the count of short-term unemployed reflects both hiring and firing behavior.
The fraction of the labor force that has been unemployed for over half a year is back to early 2017 levels, up 25% from its pre-pandemic level, and double that of its post-2020 trough.
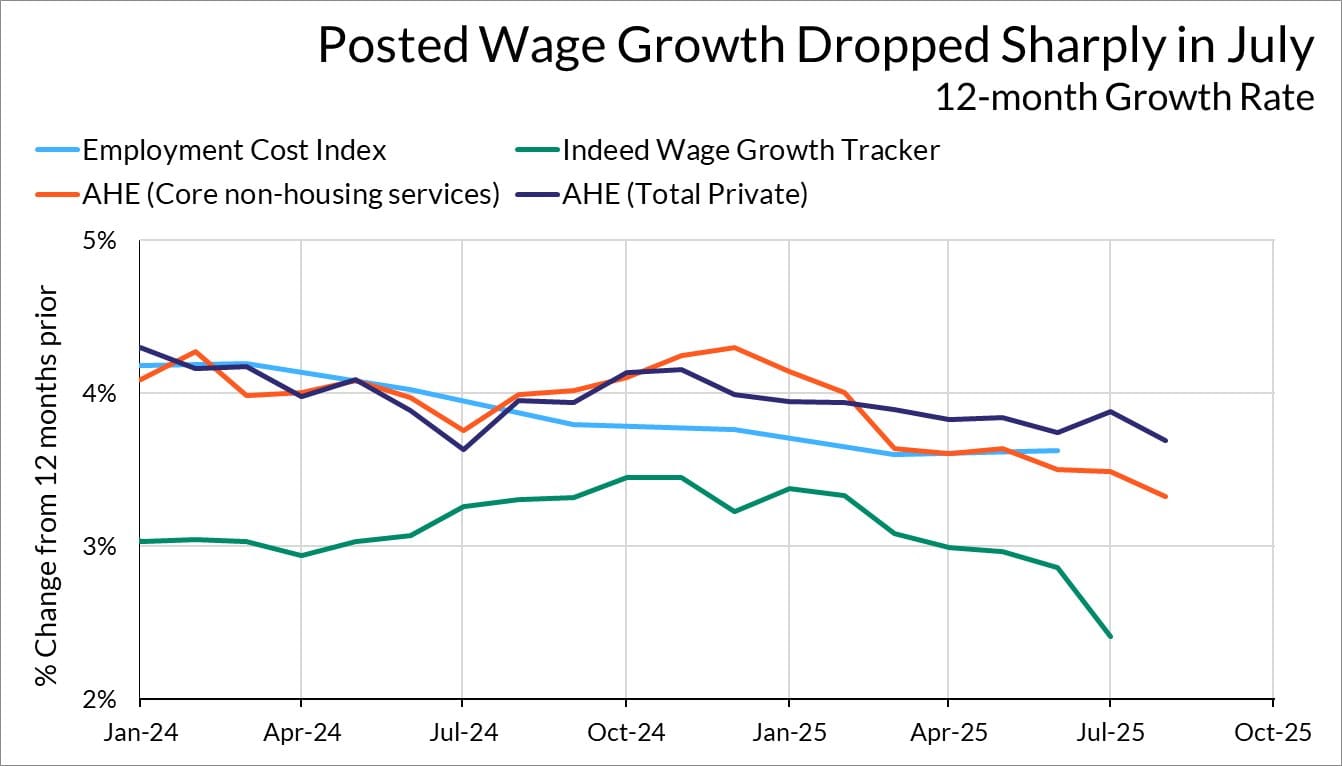
Turning to wage growth, average hourly earnings continued to slow in August, with average hourly earnings for private workers falling to 3.69%. The clearest sign of a slowdown in labor demand comes from the Indeed Wage Tracker, which showed posted wage growth falling sharply in July (the last available month), from 2.9% year-on-year to just 2.4%. Given the low rate of turnover in the labor market, it may take some time for this to be reflected in the overall wage numbers. The slowdown in wage growth is strongly indicative that even if labor supply is slowing so too is labor demand.
A Fed Cut Looks Like a Lock Now
Given the softness of this jobs report, the downside risk to the labor market looks bad enough that the Fed will almost certainly cut at their September meeting. A 50 bp cut is possible, but the Fedspeak indicates that enough weight has shifted from the payrolls numbers to the household survey that it seems unlikely (markets are pricing in a 1-in-8 chance of a 50 bp cut in September, and 25 bp cuts at the October and December meetings).
What’s interesting is that a good chunk of the Committee has been arguing that low payrolls numbers alongside steady unemployment rate numbers are nothing to worry about, given the lower rate of immigration. This jobs report is somewhat of a Rorschach test for the Committee, with members like Daly and Waller able to point to the payrolls number to argue for cuts, while members like Hammack will point to the household survey to argue for more patience. On the whole, the Committee will be persuaded to start easing, but the debate over exactly how much labor market risk there is will continue.
The link has been copied!
Your link has expired. Please request a new one.
Your link has expired. Please request a new one.
Your link has expired. Please request a new one.
Great! You've successfully signed up.
Great! You've successfully signed up.
Welcome back! You've successfully signed in.
Success! You now have access to additional content.