Labor Market Recap December 2025
Like pretty much every report this year, it’s a low-hire, low-fire report with weakness on the margins—but not quite as dire as the unemployment rate suggests.

Like pretty much every report this year, it’s a low-hire, low-fire report with weakness on the margins—but not quite as dire as the unemployment rate suggests.
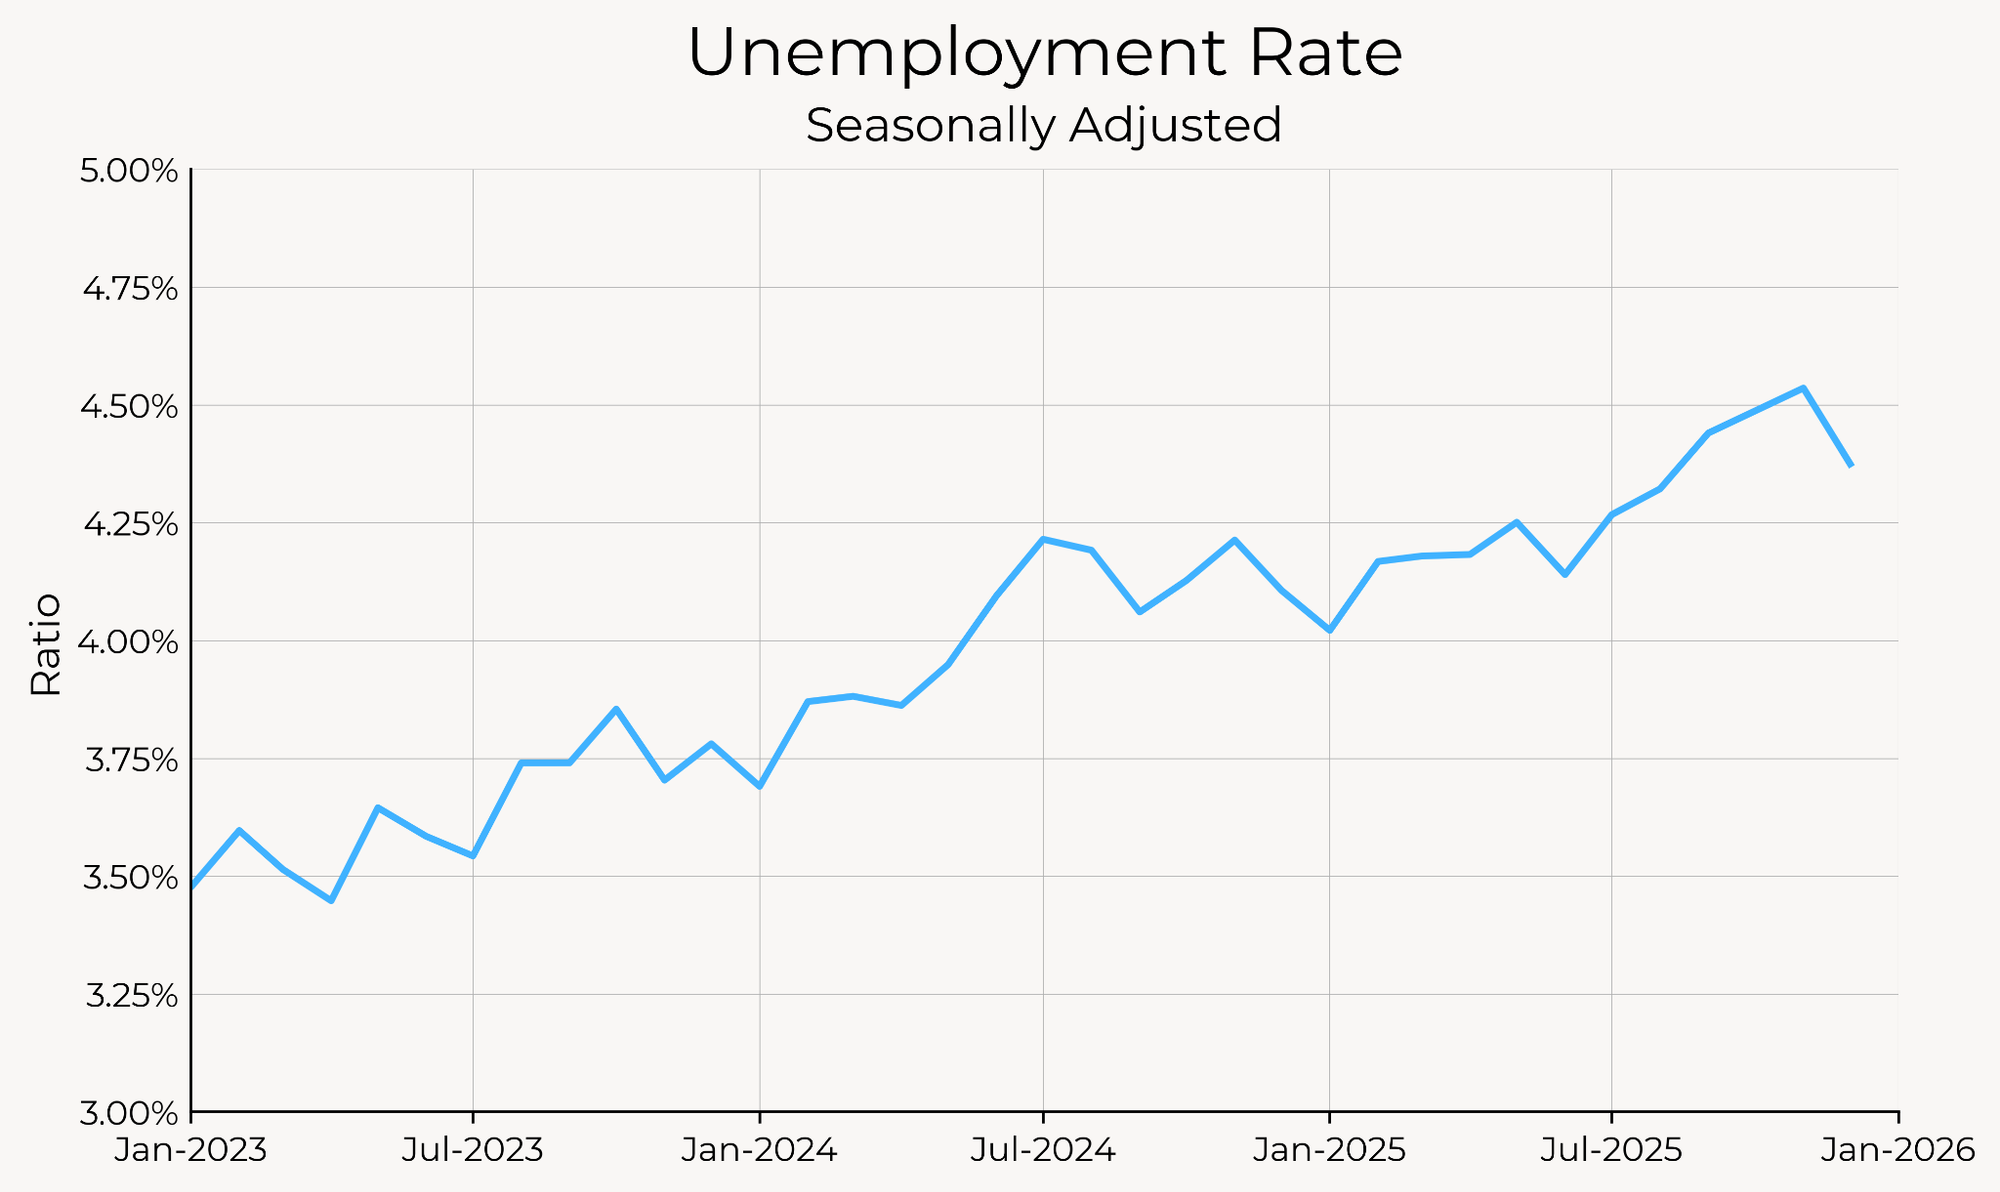
The labor market added 50,000 jobs in December. The unemployment rate fell to 4.38% from 4.56% in December, and prime-age employment matched its year-high at 80.7%. There were significant downwards revisions to previous months, with October’s job losses revised further downwards from -105,000 to -173,000 (-65,000). All of these revisions are from the government sector; the private sector saw minimal upwards revisions in November. 12-month average hourly earnings ceased its fall, and grew from 3.62% to 3.76%. Short-term wage growth, which troughed in mid-2025, has now been holding steady at just below 4%, despite a significant fall in posted wage growth in the Indeed data.
While overall payroll growth including revisions, doesn’t look great this month, on the whole it’s not a bad report. The private sector avoided negative revisions, and the household survey looks pretty decent. Like pretty much every report this year, it’s a low-hire, low-fire report with weakness on the margins—but not quite as dire as the unemployment rate suggests. With the 2025 data (almost) fully in hand (sadly, we will never get the October household survey), the key themes of the 2025 labor market are:
| Labor Market Dashboard | |||||
| For December 2025 | |||||
| Change from | |||||
|---|---|---|---|---|---|
| Household Survey | Current | 1M Ago | 3M Ago | 12M Ago | 2019 Avg |
| Employment Rate (Prime-age) | 80.7% | +0.1% | 0.0% | +0.2% | +0.7% |
| Unemployment Rate | 4.38% | -0.16% | -0.07% | +0.27% | +0.71% |
| Sahm Indicator | 0.35% | 0.00% | +0.12% | -0.05% | +0.33% |
| Black-white Gap | 3.7% | -0.6% | -0.2% | +1.2% | +0.9% |
| Participation Rate (Prime-age) | 83.8% | 0.0% | +0.1% | +0.4% | +1.3% |
| Payroll Growth (3-month avg., thous.) | Current | 1M Ago | 3M Ago | 12M Ago | 2019 Avg |
| Total Nonfarm | -22 | -19 | -74 | -232 | -188 |
| Total Private | 29 | -22 | -27 | -147 | -119 |
| Government | -52 | +3 | -46 | -84 | -70 |
| Cyclical | -47 | -24 | -24 | -84 | -92 |
| Acyclical | 25 | +4 | -49 | -147 | -96 |
| Wage Growth | Current | 1M Ago | 3M Ago | 12M Ago | 2019 Avg |
| Average Hourly Earnings (3m/3m) | 4.0% | +0.1% | +0.1% | -0.4% | +0.8% |
| ECI Total Comp. (3-month) | 3.8% | N/A | +0.2% | +0.4% | +1.1% |
| Atl. Fed. Median Wage Growth (yoy) | 3.8% | N/A | -0.3% | -0.5% | +0.1% |
| Indeed Postings Wage Growth (yoy) | 2.3% | -0.0% | -0.4% | -1.1% | -0.9% |
| JOLTS | Current | 1M Ago | 3M Ago | 12M Ago | 2019 Avg |
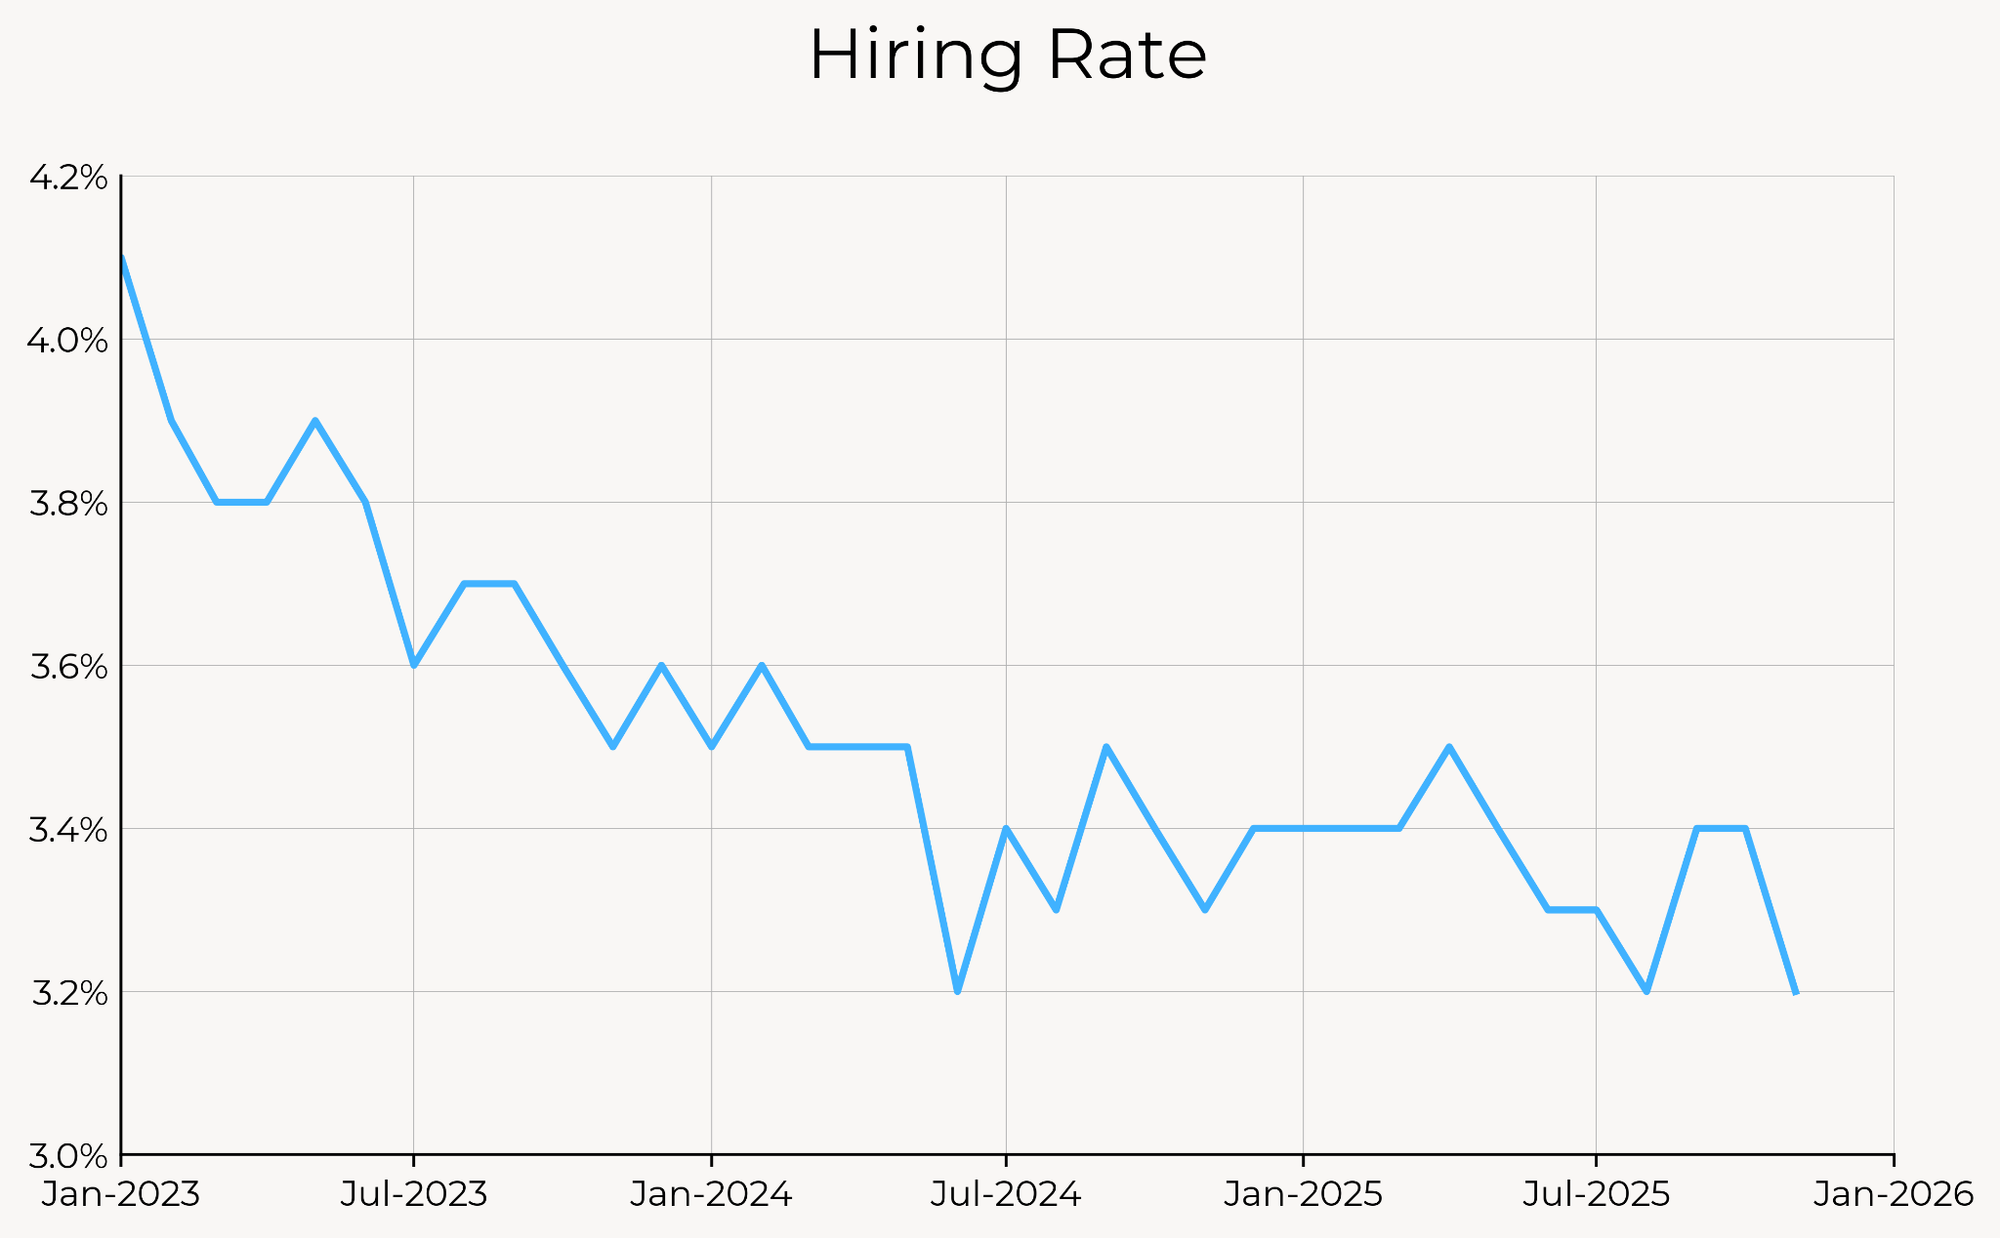
| Hiring Rate | 3.2% | -0.2% | 0.0% | -0.1% | -0.7% |
| Quit Rate | 2.0% | +0.1% | +0.1% | +0.1% | -0.3% |
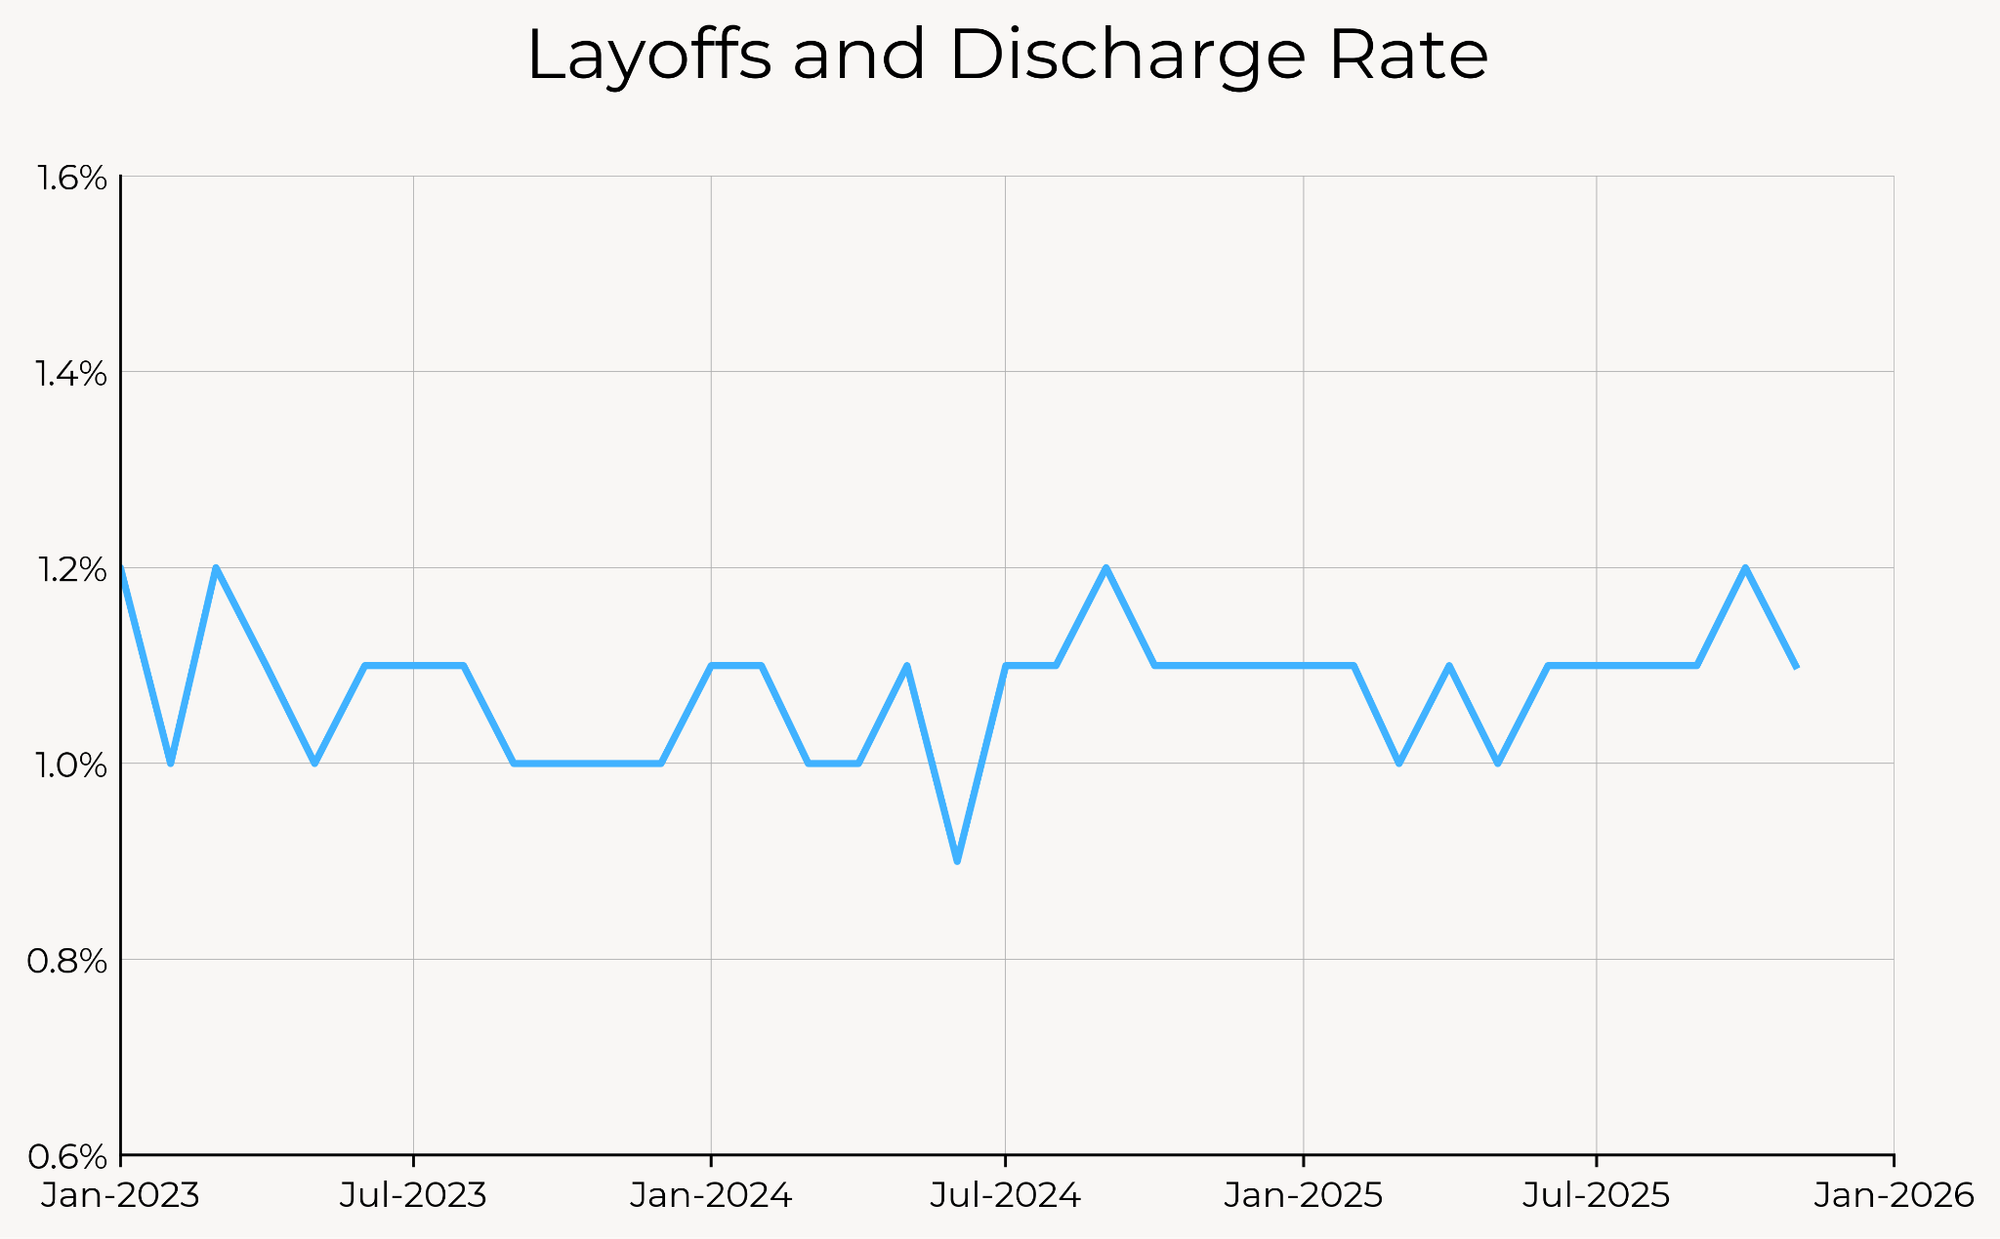
| Layoff Rate | 1.1% | -0.1% | 0.0% | 0.0% | -0.1% |
| Job Openings Rate | 4.3% | -0.2% | 0.0% | -0.5% | -0.2% |
Source: Bureau of Labor Statistics, Author’s Calculations. Red indicates weaker labor market development; green indicates stronger. *Previous month figures for these indicators refer to the as-reported numbers from the previous month, not the previous month’s figure in the current vintage. For an explanation of why, see this post.
We’ve always pointed to the prime-age employment rate, which avoids complications around an aging population and correctly parsing unemployed vs. non-participating workers, as the best barometer of the labor market. The prime-age employment rate, at 80.7%, is not far from its cycle high of 80.9%, and 0.7pp above its average level in 2019.
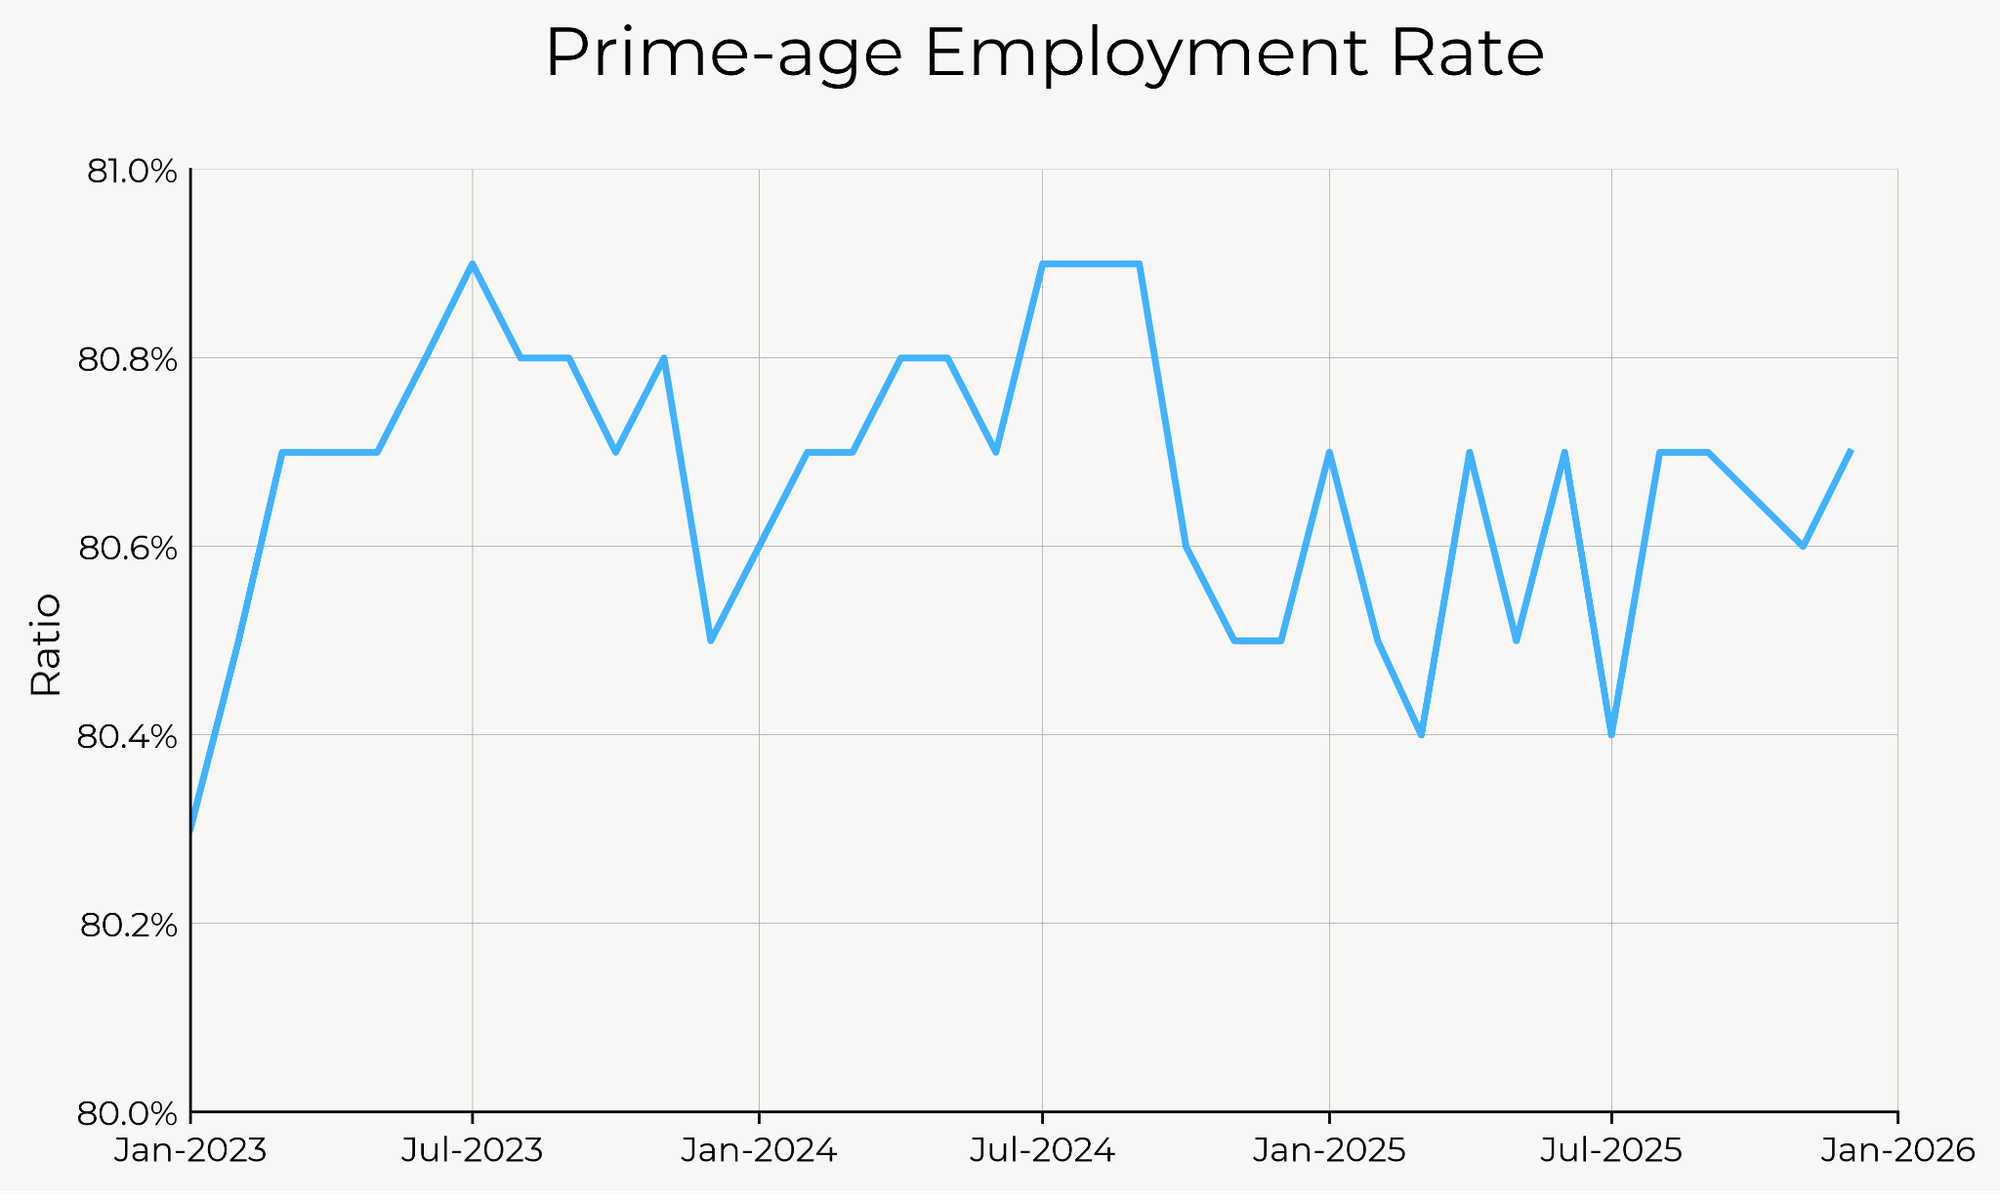
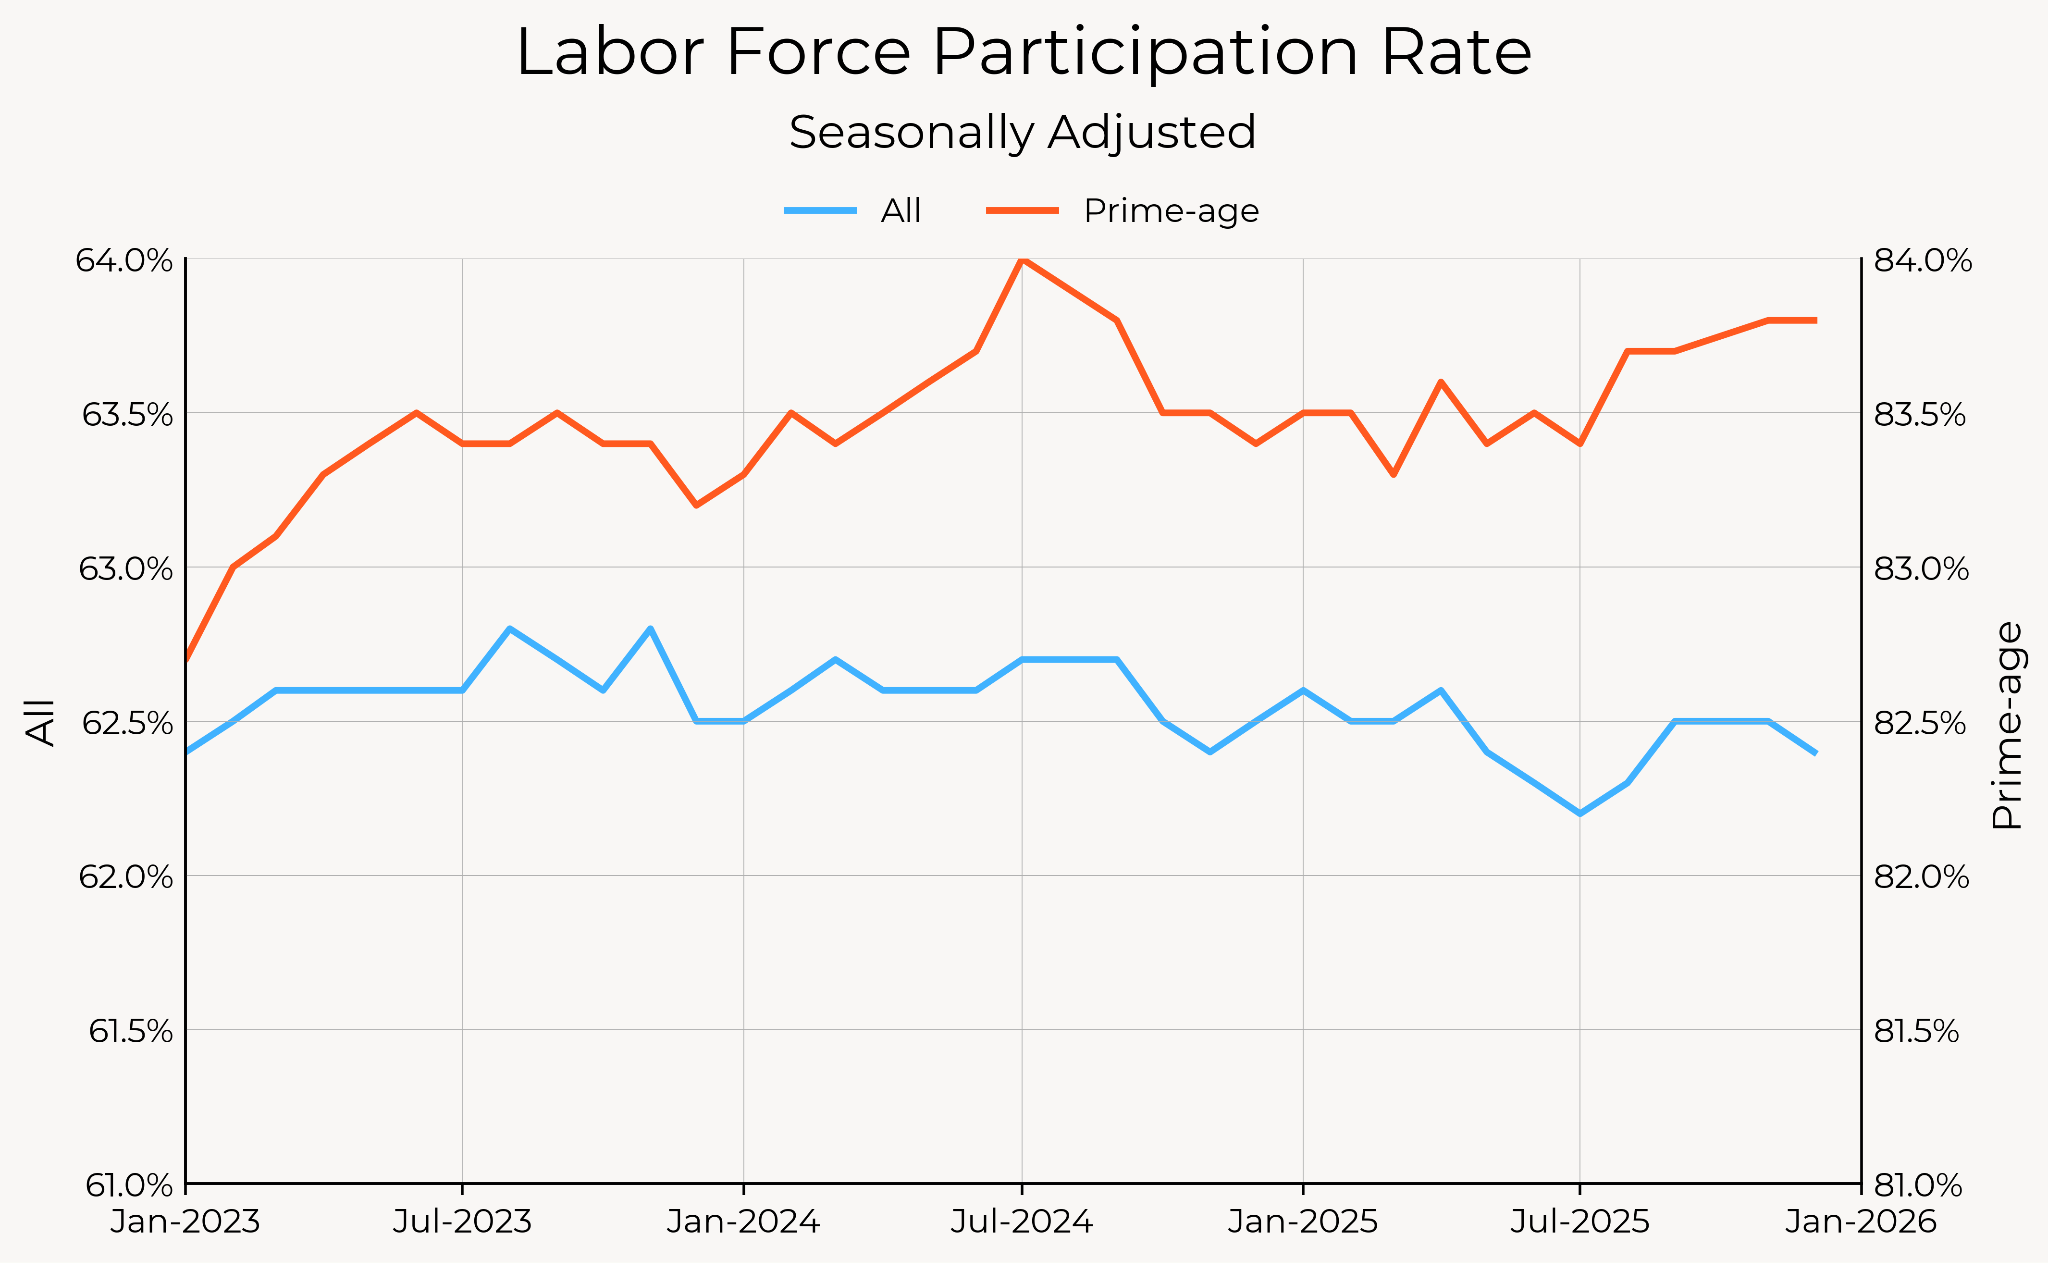
Participation rates, especially prime-age participation rates, have also been healthy. The prime-age labor force participation is a full 1.3pp above their 2019 average, and has actually been increasing over the course of 2025.
Despite the sluggish hiring behavior this year, it’s remarkable how durable the job gains from the rapid post-2020 recovery have been. People who may not have otherwise been in the labor market have been pulled off the sidelines, and that hasn’t gone away.
Still, the unemployment rate has increased appreciably over the same period. This steady, gradual increase in the labor market is virtually unprecedented in the post-war history of the U.S. labor market, which is dominated by quick deteriorations followed by gradual recoveries.
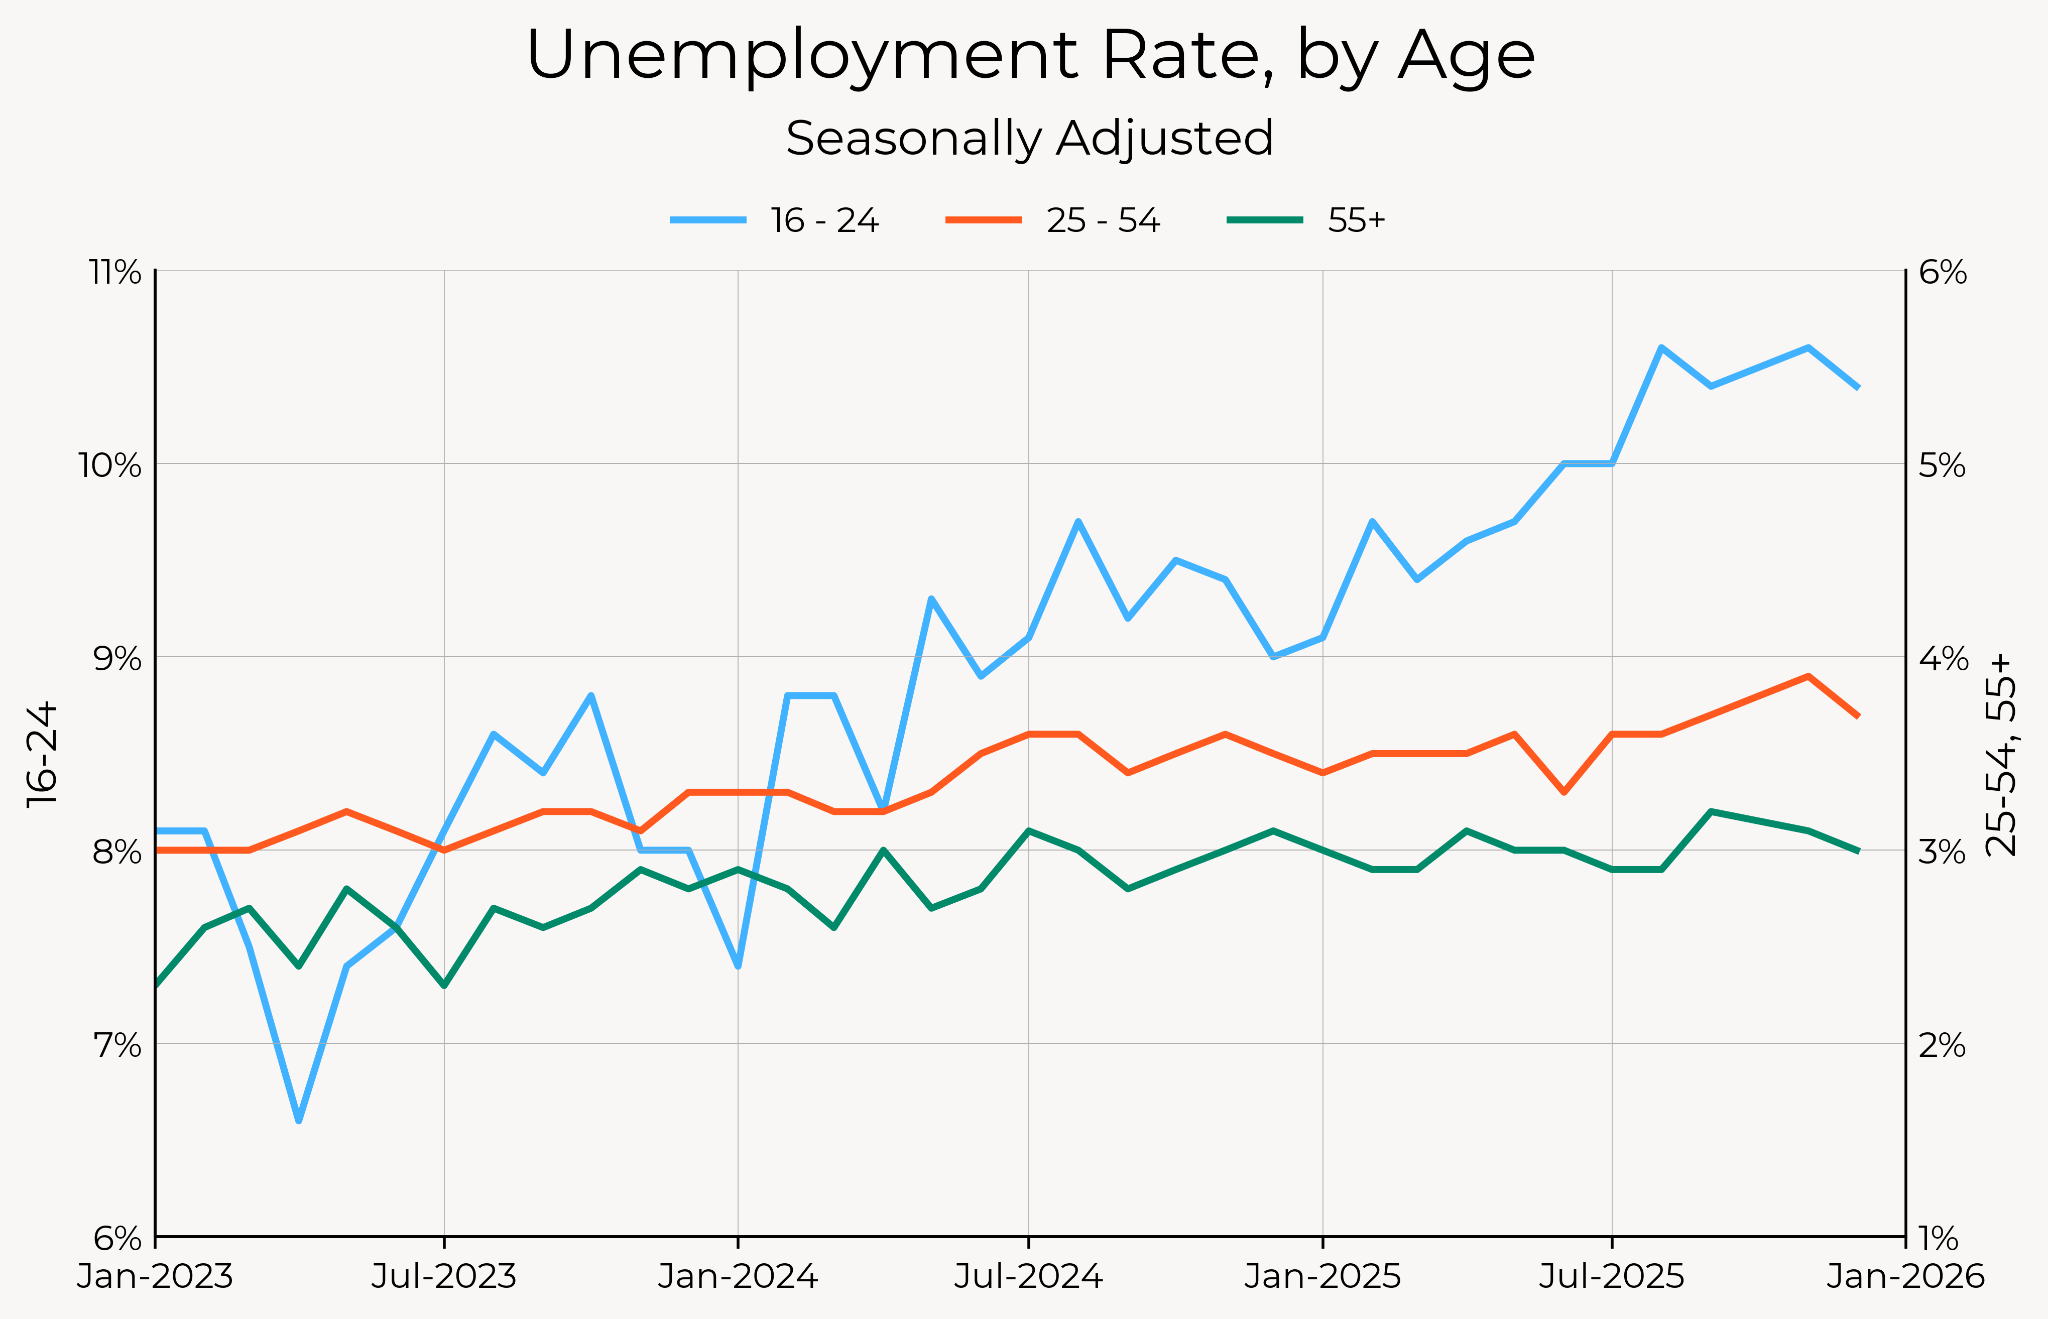
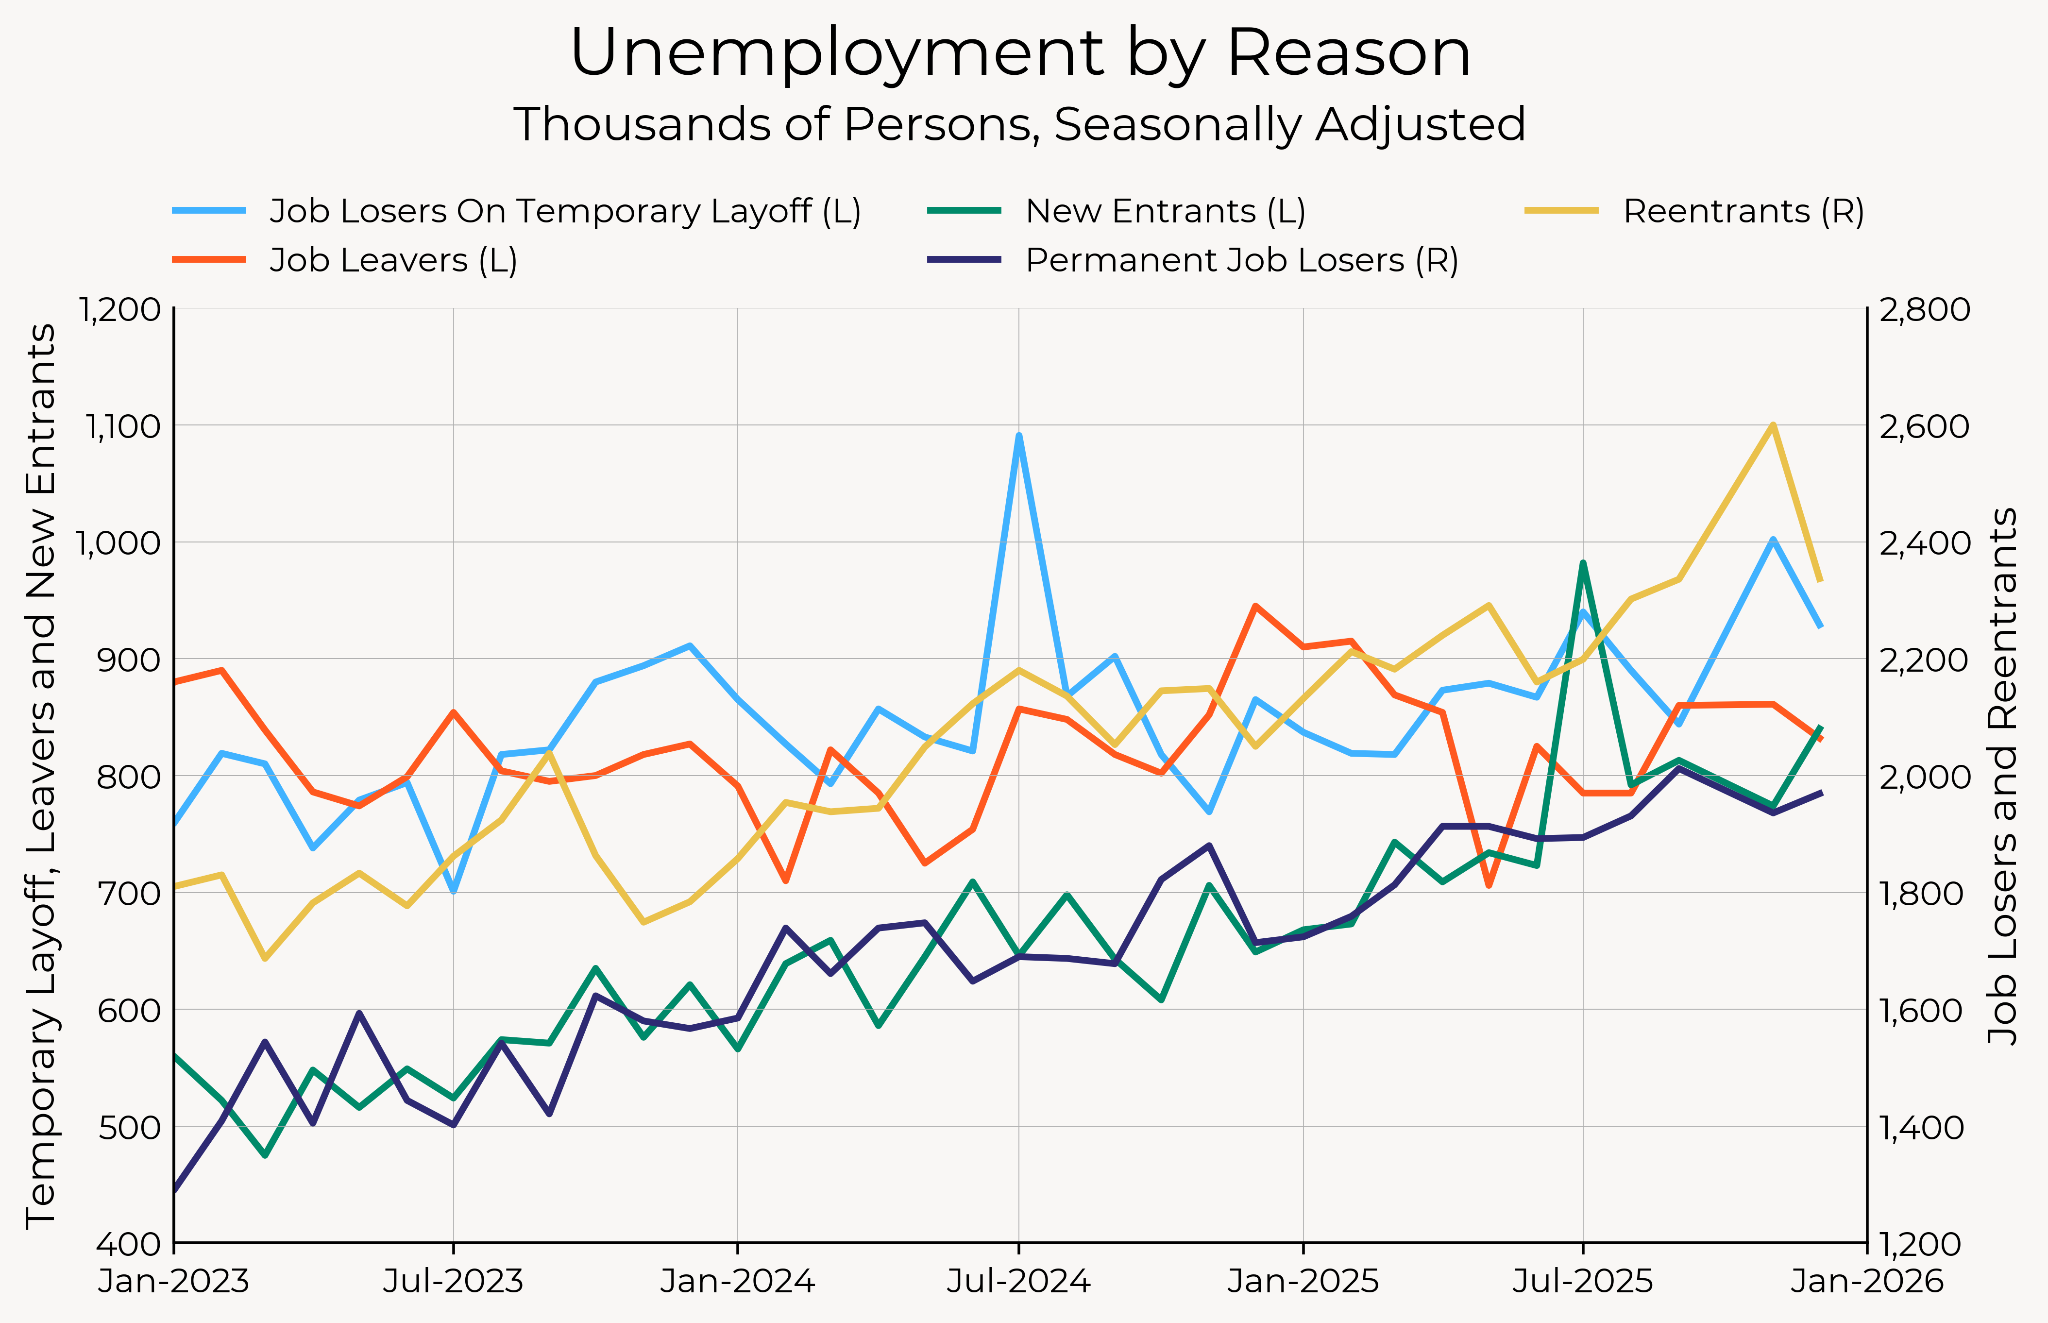
That increase in youth unemployment is large relative to other age groups, but it’s still not as sharp or large as the increase in youth unemployment rates during recent recessions. Meanwhile, the unemployment rate in prime-age workers and older workers has only increased marginally over the past twelve to eighteen months.
While hiring behavior is the predominant driver of employment and unemployment movements, historically speaking, the unemployment rate increases so quickly during recessions because there is a wave of layoffs at the beginning of recessions. Usually there is a precipitating event—a financial crisis or stock market crash—that causes firms to suddenly want to have fewer workers, or causes firms to go out of business.
But today, there simply wasn’t a precipitating event like a stock market crash or financial crisis that caused a sudden fall in businesses’ desired employee counts. Instead, the increase in the unemployment rate has been caused by a gradual slowdown in the hiring rate, which is now near-Great Recession level
We can see this in the breakdown of unemployed workers by the reason they report being unemployed. A large fraction of the increase in unemployment comes from unemployed new entrants and reentrants. When unemployment increases among those, it’s a hiring problem, not a firing problem. The gradual increase in unemployed “permanent job losers” also likely represents a hiring problem (permanent job losers are slower to find new jobs, rather than more people permanently losing jobs).
While wage growth has steadily declined from its peaks a few years ago, but still remains in a relatively strong range between 3.5% and 4.0%. Short-term wage growth has even picked up somewhat over the second half of this year.
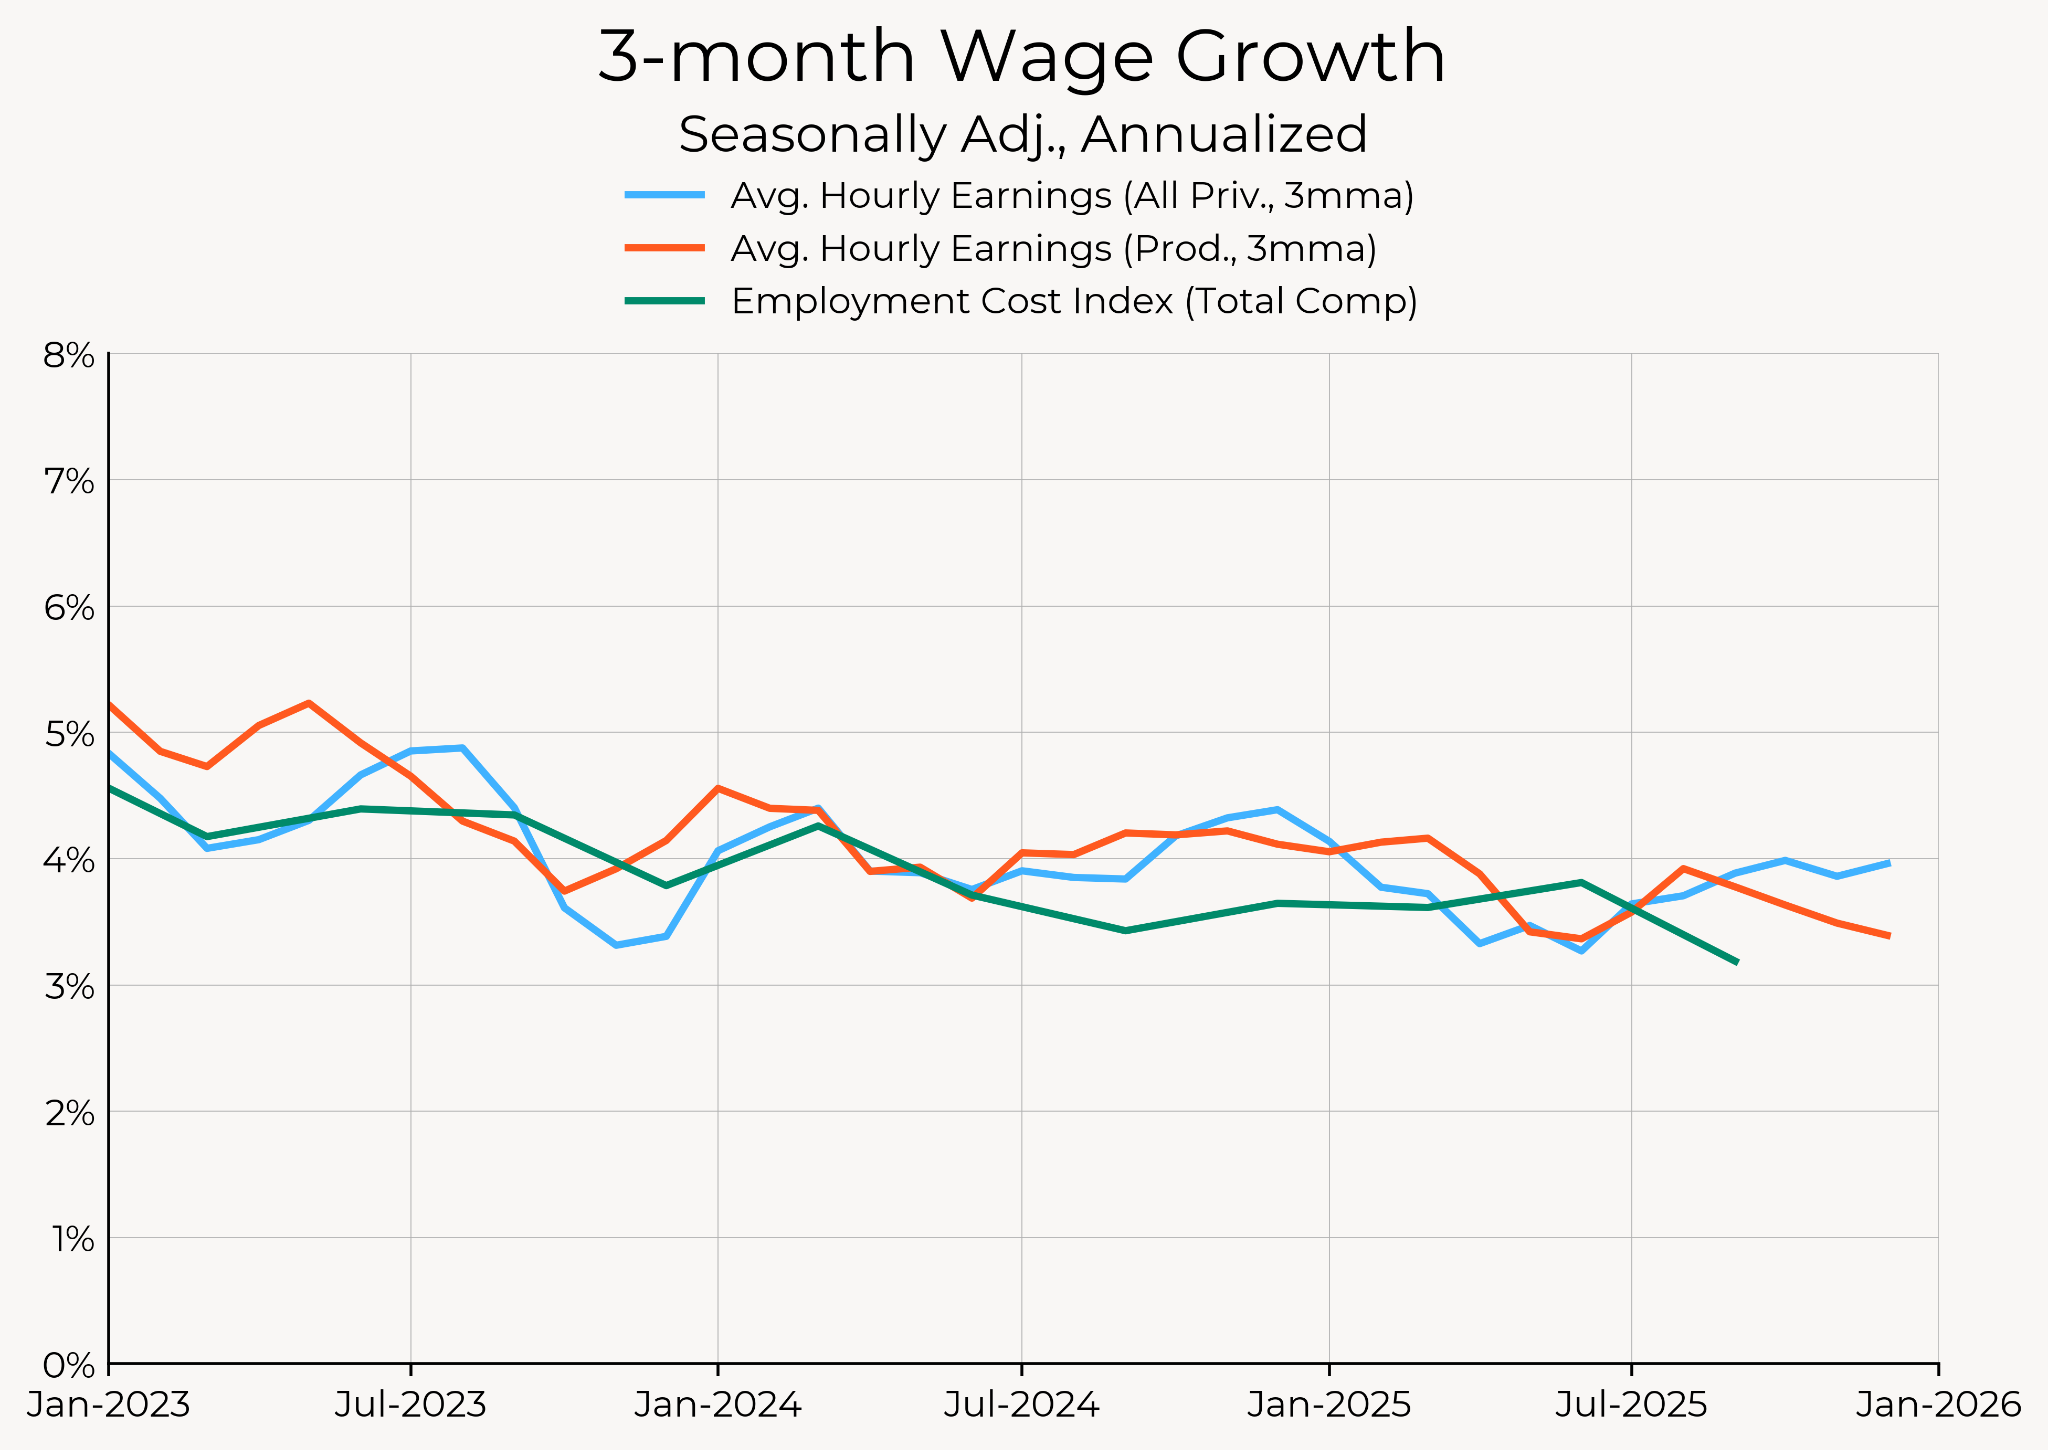
However, the prospects for future wage growth are not great. Posted wage growth is at its lowest point since 2020, with posted wage growth declining from nearly 3.5% earlier this year to just 2.3% in the latest release of the Indeed Hiring Lab's data. Given the low hiring rates and job turnover, this may take a while to filter into realized wage growth.
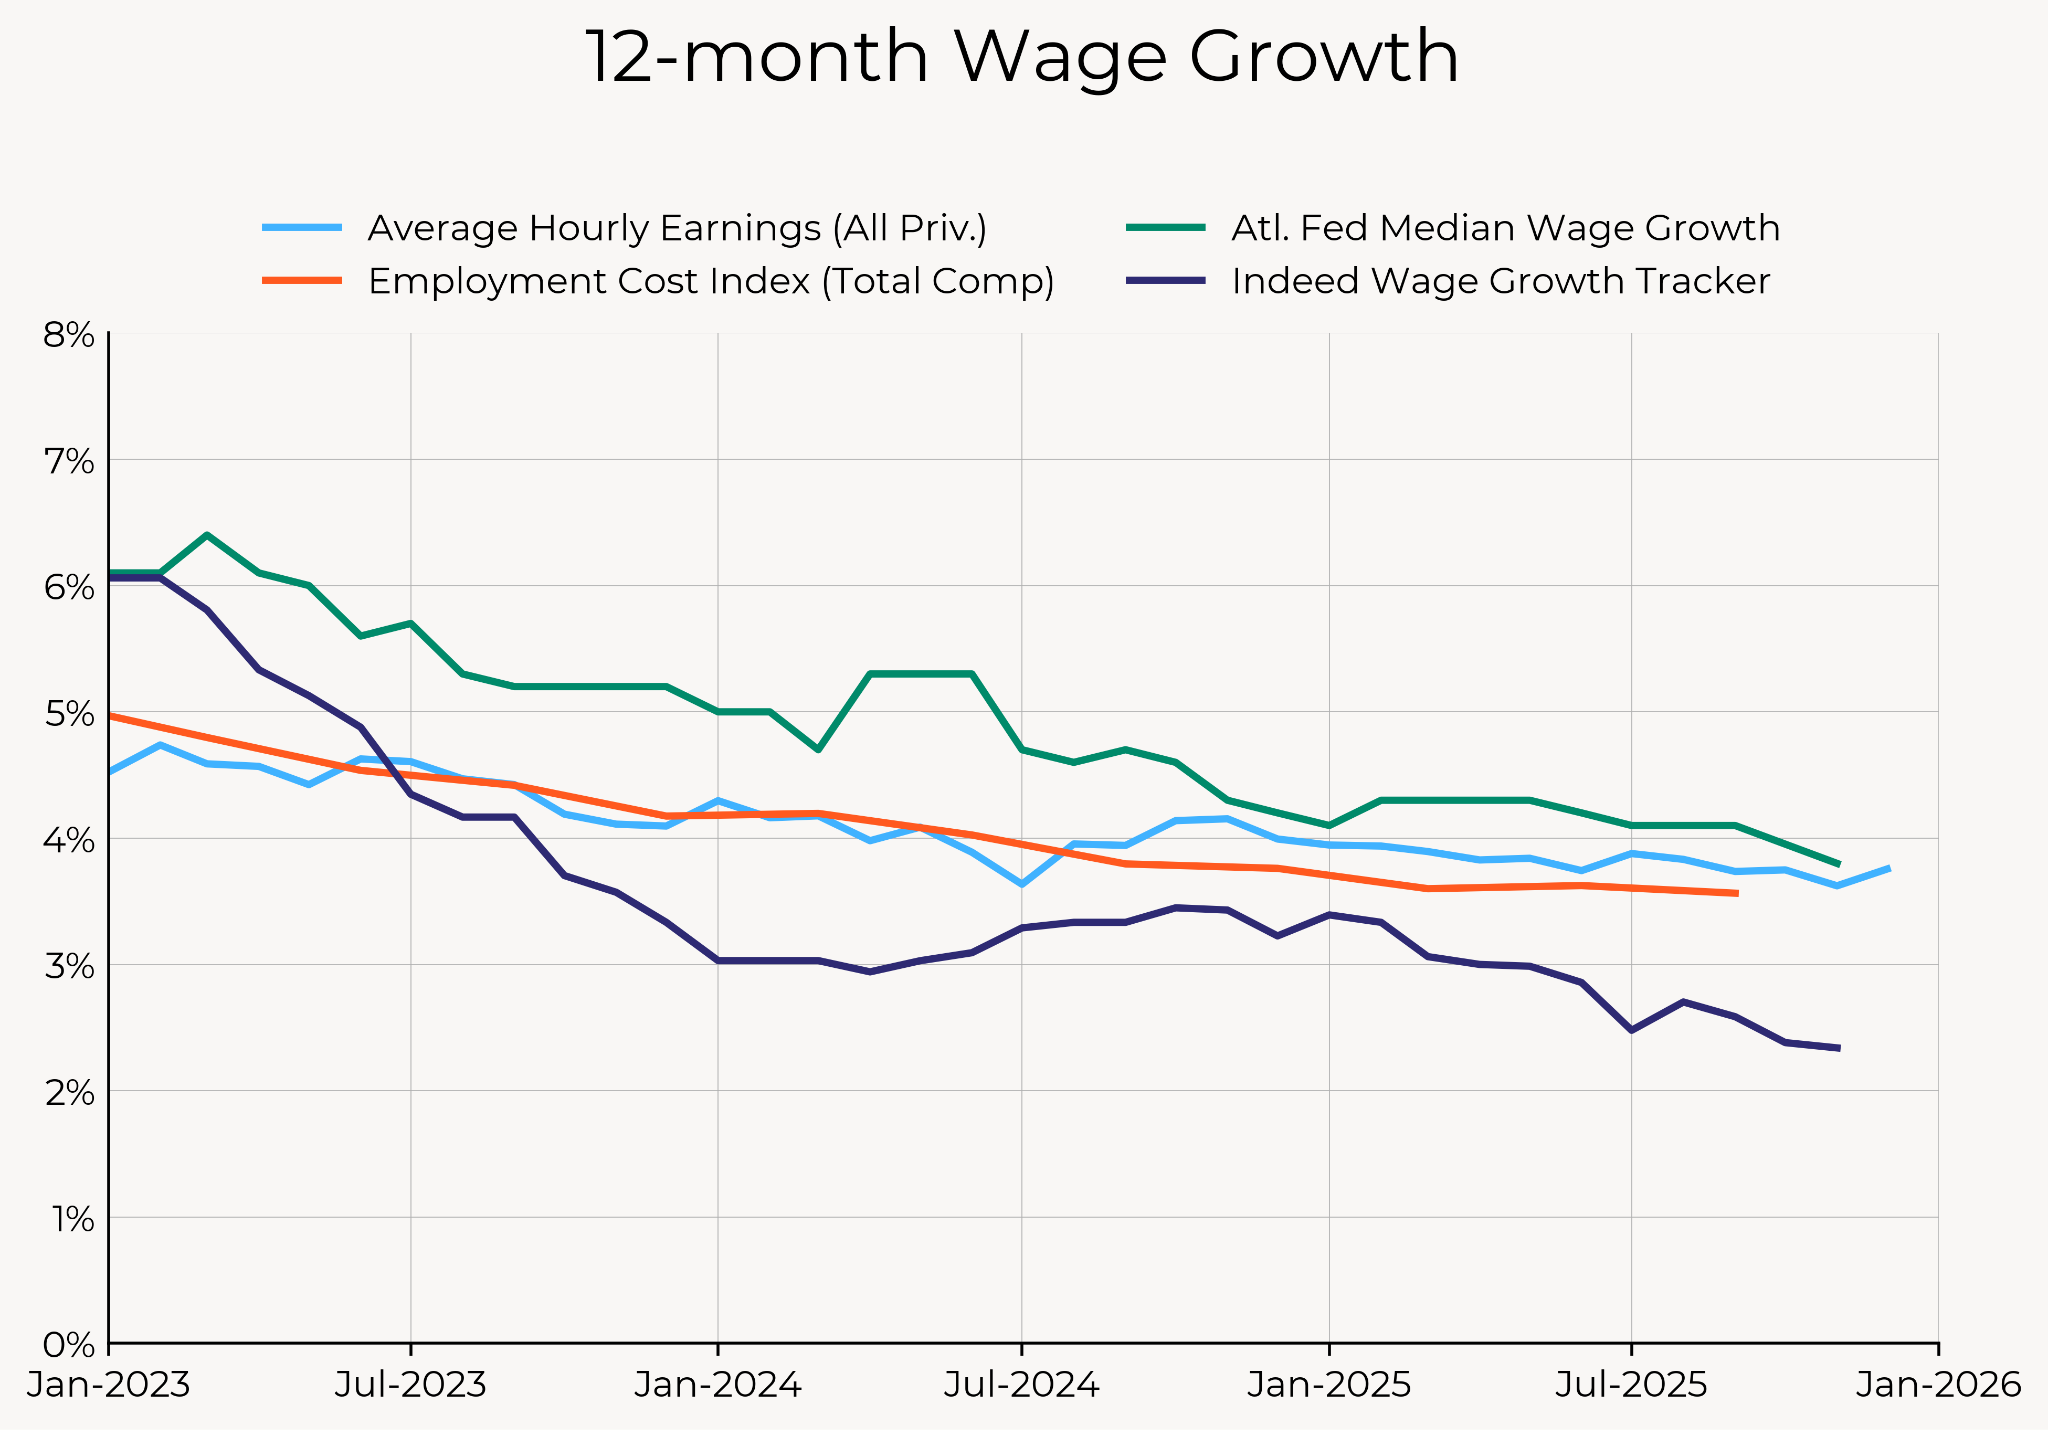
Between slowing absolute job growth (due to lower immigration) and the threat of slower wage growth, it's hard to see where strength in labor income (which fuels consumption) might come from in 2026. Aggregate weekly payrolls growth fell to a cycle low of 4.29% in December, somewhat below its levels in the late-2010s.
For months, we’ve been highlighting the risk that payroll employment growth is limited to an increasingly narrow set of sectors, mostly services that are known for being less cyclical sensitive than goods-producing and construction sectors. Now, even those acyclical sectors are starting to show weakness.
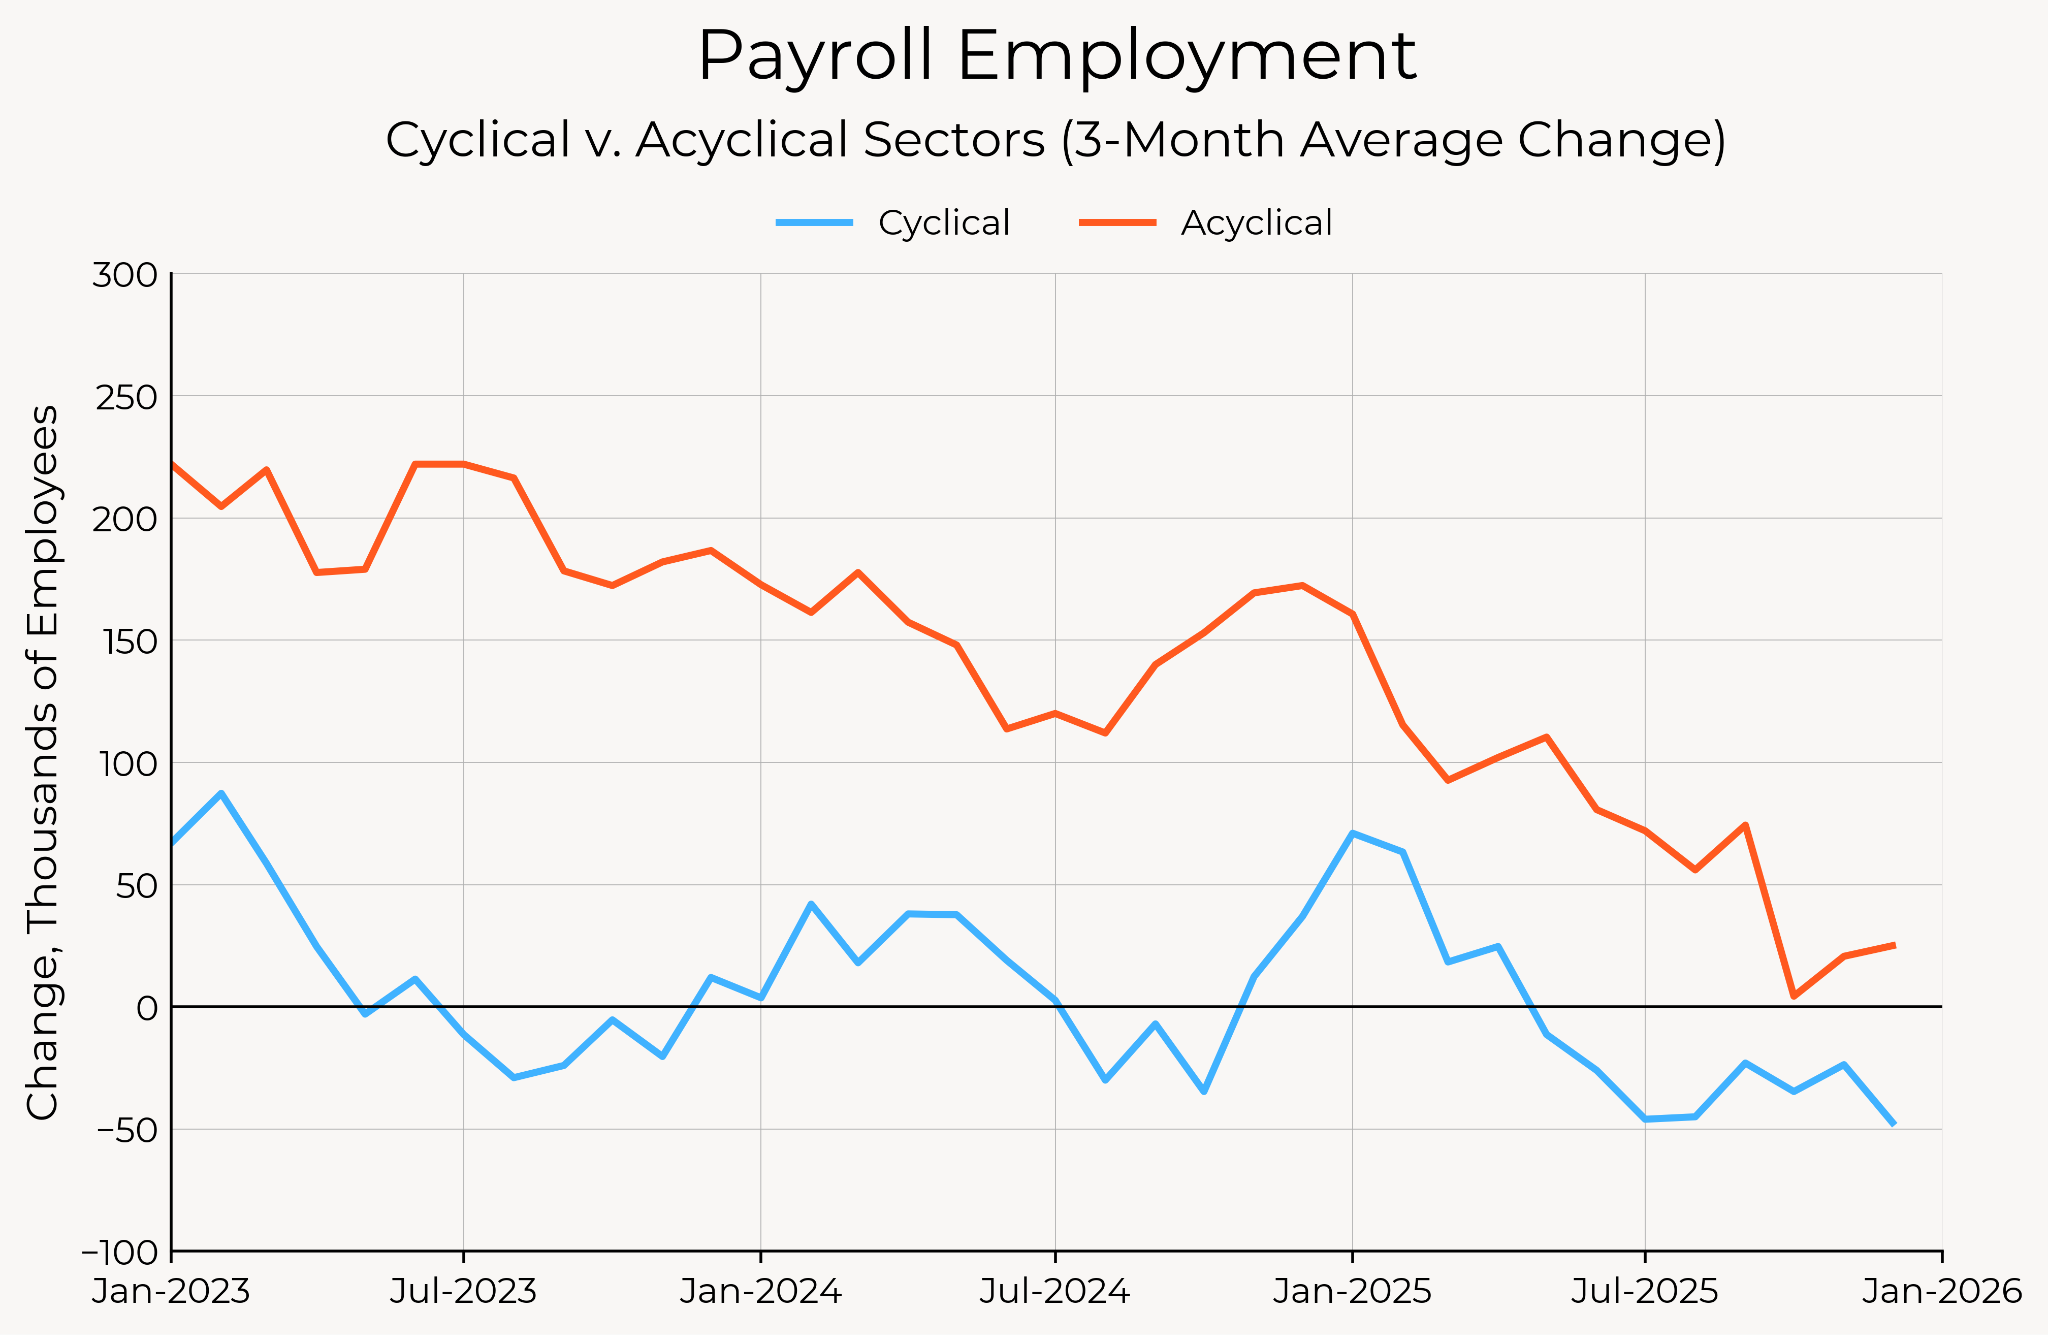
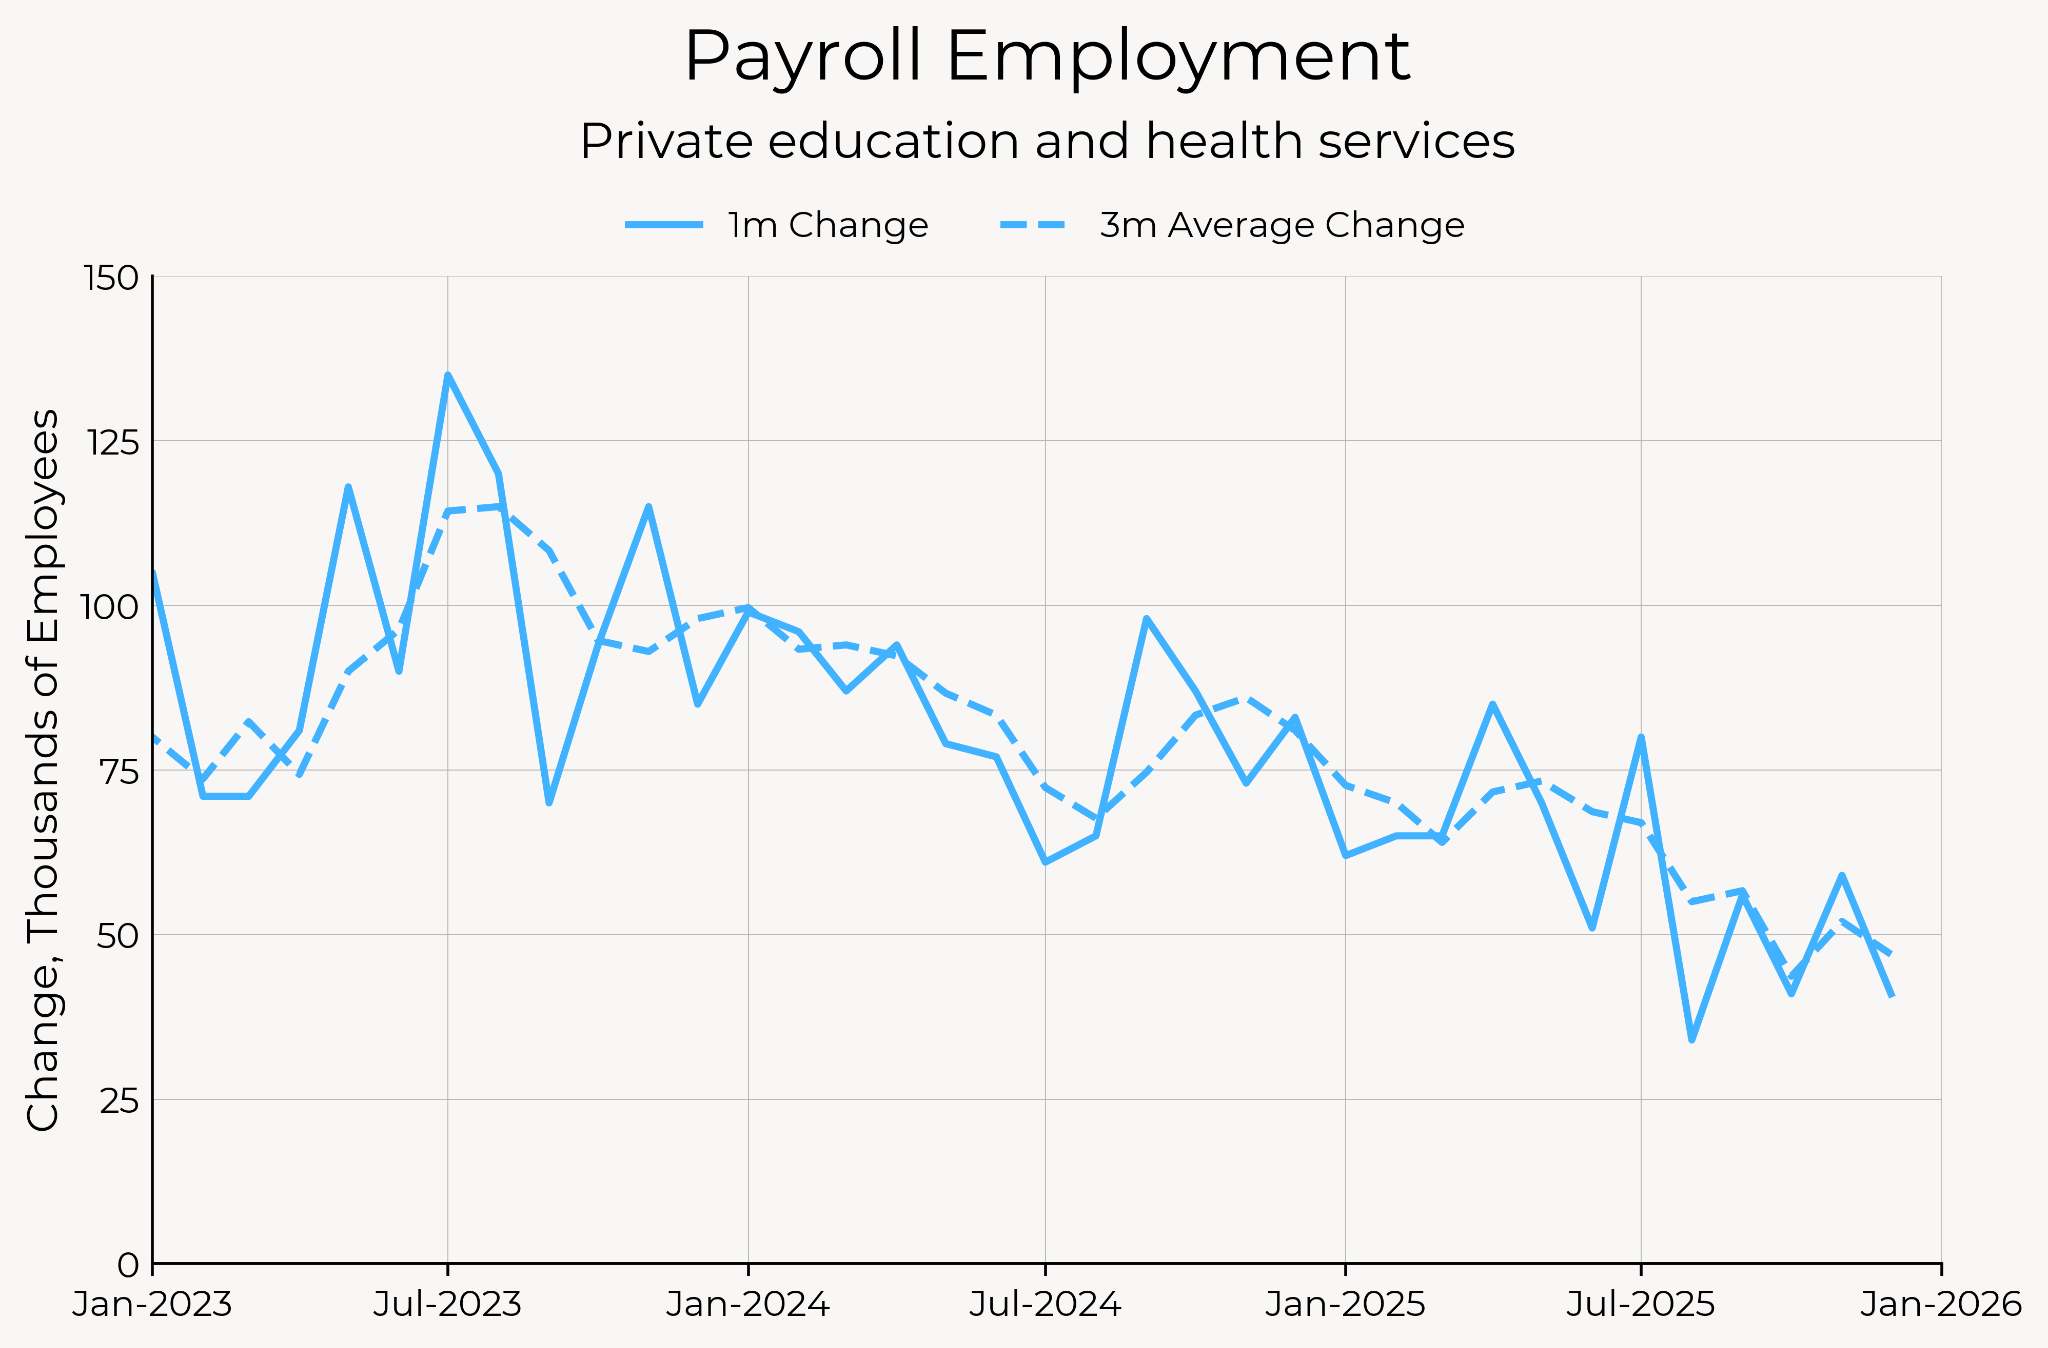
Most of the slowdown in the past three months has to do with the government shutdown. However, even the last remaining jobs powerhouse, education and health services, has slowed this year.
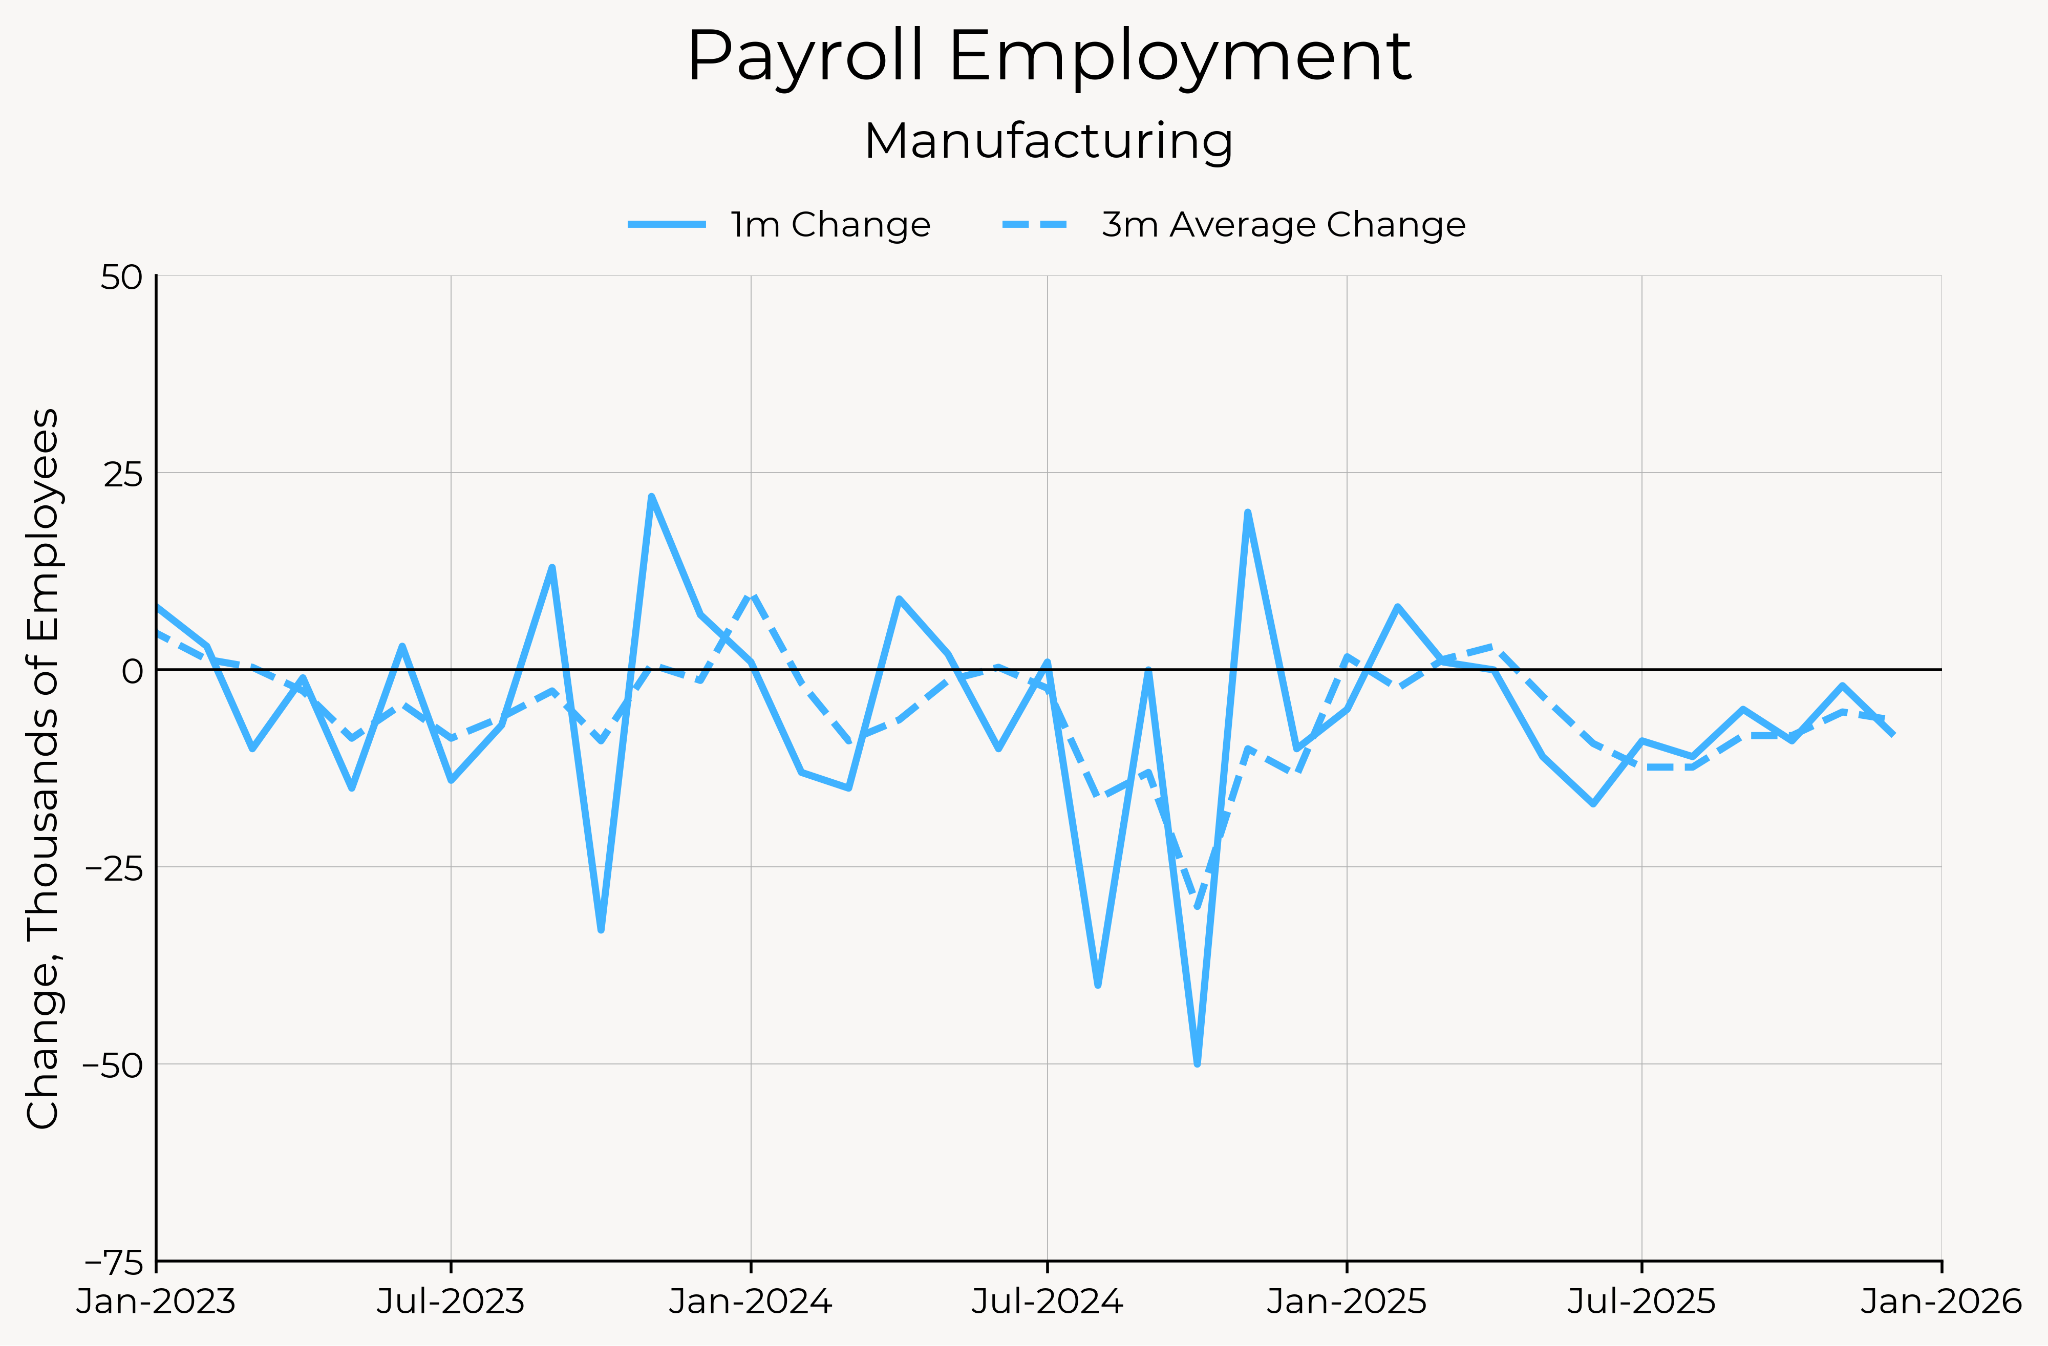
Meanwhile, despite the promised manufacturing boom, manufacturing jobs have steadily declined this year, starting right about when tariffs were announced.
The jobs data from December kills any chance of a cut at the January meeting, and raises the bar for a cut in March. The Fedspeak from even doves like Paulson has leaned against a cut any time soon. The fall in the unemployment rate will give the Fed reason to think it can take the time for an extended pause.
While inflation is still elevated and they wait for clarity around how much companies will continue tariff pass-through in 2026, they are unlikely to cut further without further visible deterioration in the labor market. This month’s job data doesn’t have that visible deterioration, and it will take a few bad job reports for the Committee to be convinced that they haven’t done enough to prevent a sharper deterioration.