During the pandemic recovery, the US has experienced substantially higher inflation than Europe. In 2021, the US Harmonized Index of Consumer Prices (HICP) grew 8.1%, compared with the 4.9% in the Euro Area (18 countries). Some commentators have attributed this difference to the larger fiscal stimulus done in the US, but the reality is much more complicated.
Today we are going to look at the specific components driving inflation in the US and Europe. In this piece, we break down the divergence in US and European inflation during the recovery, and see which components in particular are responsible for inflation in each region. To the extent that the data allow, we will compare inflation at the most granular level that we can.
When we disaggregate the aggregate inflation statistics, we find that the sources of high inflation in the US and Europe are different. In the US, the main story was motor vehicle transportation. High prices of cars and fuel account for a large portion of the excess inflation in the US. Hotels, restaurants, food, rent and home durables also contributed. Meanwhile, European inflation suffers from a larger increase in electricity and natural gas prices. Some of the sources of excess inflation in the US were likely related to high consumer demand. However, other sources, especially auto transportation, were affected by salient supply chain issues. Simply attributing the inflation difference to stimulus-driven demand is too simple, even if one conveniently strips out non-core food and energy.
Some may argue that inflation is simply determined top-down by concepts like aggregate demand and supply and that any micro-level approach to explaining inflation is prima facie illegitimate. Yet these same commentators will turn around and argue that certain narrower measures of inflation (such as “core” inflation) are ideal indicators of aggregate supply and demand, and justify this using micro-based arguments about the susceptibility of food and energy inflation to volatile shocks unrelated to demand. As we explained before, this is having it both ways and the same arguments could apply just as easily to other components.
As we explored in our previous piece on global inflation, there are many ingredients that go into the inflation cake. Price indices are not created using the same methods in different countries. Prices are determined for a myriad of reasons, not all of which are necessarily related to fiscal stimulus and aggregate demand. Different countries face and have different responses to supply shocks in different sectors. Price-setting behavior can vary across countries, with some countries imposing stricter price controls in certain sectors.
In future pieces, we’ll dive deeper into the potential causes of divergence for specific inflation components that appear to be at the heart of the variation between US and European inflation outcomes. Many of these components were not only affected by the greater fiscal stimulus in the US; some were subject to profound supply shocks and others were subject to different price regulations. For these components, we will examine the points at which demand, supply, or other factors played a role in the evolution of prices in each region and component.
Granular Comparisons
Comparing US and Euro Area (EA) inflation at a granular level is not straightforward. While European HICP data is available at very granular levels, the US HICP data is only reported at the level of broad categories (e.g. “Transportation” and “Food”). However, the HICP in the US is just a modification of the CPI, with the expenditure weights modified to account for rural consumption and exclude owner-occupied housing.
So, we can make a tentative comparison of the US and EA inflation data by comparing the granular CPI data – on which the US HICP is built – to components in the EA HICP. While the mapping between CPI categories and HICP categories is imperfect, the two measures share enough similar categories for us to get a better understanding of the underlying components that drive inflation in each region.
For each component, we can calculate the price change, weight, and contribution to the aggregate inflation rates in each region. In the EA, this is the contribution to the overall HICP. For the US, this is the contribution to the CPI less owner-occupied economic rent. This comparison comes with a few caveats. The first is that the weights for the CPI are derived from urban expenditures, while the HICP weights include rural expenditures. The second is that sometimes the CPI and HICP categories are not always clearly comparable; for example, bicycles are included in the transportation category in the HICP, but lumped in with recreational vehicles in the CPI. This means that our comparison leaves out certain items, although we are able to compare most items. Finally, as we explored in the previous piece, collection and calculation of price indices are subject to different processes, even at a granular level.
In the first table, we report large categories, and then explore.
Category
US Contribution
EA Contribution
Difference
Food and Beverages
0.99%
0.79%
0.21%
Clothing
0.17%
0.15%
0.02%
Rent
0.43%
0.08%
0.35%
Electricity and Natural Gas
0.51%
1.72%
-1.20%
Household Goods
0.57%
0.26%
0.31%
Medical Services
0.19%
0.04%
0.15%
Transportation
3.83%
1.31%
2.53%
Restaurants and Hotels
0.82%
0.34%
0.49%
All Items
9.07%
5.81%
3.26%
Particular components stand out for their outsized contribution to US inflation. Transportation is the elephant in the room. To a lesser extent, rent, restaurants and hotels, and household goods also contributed to higher inflation in the US. Meanwhile, non-transport-related energy (electricity and natural gas) contributed far more to inflation in Europe than in the US.
Automobiles and Transport
Category
US Contribution
EA Contribution
Difference
New autos
0.61%
0.12%
0.49%
Used autos
1.50%
0.09%
1.41%
Tires
0.05%
0.01%
0.04%
Motor fuel
1.47%
0.94%
0.53%
Auto repair
0.09%
0.10%
-0.01%
Non-auto transit
0.10%
0.04%
0.06%
Airfare
0.09%
0.02%
0.07%
Auto insurance
0.12%
0.01%
0.11%
Sources: Bureau of Labor Statistics, Eurostat, and Author’s Calculations. Contributions are to the 12-month change, ending February 2022, in the CPI less owner-occupied economic rent in the US and the HICP for EA-18. Contributions are calculated using the Ribe method (HICP Methodological Manual pg. 182).
A large portion of the difference between inflation in the US and Europe is explained by the prices of cars, in particular used cars. Despite making up only 10.9% of expenditure weight in the non-owner-rent CPI, new and used cars accounted for nearly a quarter of inflation over this time period. Part of this difference is due to the fact that Americans simply spend more on cars than Europeans – the combined weight of new and used cars is only 3.5% in Europe. But prices of cars, especially used cars, have increased far faster in the US than in Europe.
Sources: Bureau of Labor Statistics, Eurostat, and Author’s Calculations. US Prices are the 12-month change in the component CPI; EA prices are the 12-month changes in the component HICP for EA-18.
While we will explore further in future pieces, a demand-only story of transportation inflation is too simplistic and ignores many of the supply issues of obviously high salience here. The chip shortage significantly hampered domestic new auto production, and the subsequent shortage of new autos increased reliance on used automobiles. As noted in our previous piece, a global automobile supply crunch is likely to have an outsized effect on prices in the US relative to Europe, where multiple modes of transport are available and the used car market is far less relevant as a result. At the same time, car rental agencies in the US also bid up prices of used cars after offloading large parts of their fleet earlier in the pandemic. Oil has also faced significant physical capacity issues stemming from capital discipline in the sector, even as motor fuel consumption in the US has yet to return to pre-pandemic levels.
Source: Board of Governors, Energy Information Administration
Rent
Tenant-occupied rent has been another area where US inflation has run ahead, with rental inflation at 3.3% in the US and 1.2% in Europe in 2021. It’s tempting to see this dynamic as a consequence of elevated aggregate demand in the US. After all, rent is highly sensitive to changes in labor income. Rent is also plausibly less subject to spillover effects than, for example, tradable goods, since rental services are almost entirely consumed locally. But is that the whole story? There are a few reasons to be skeptical that differences in rental inflation straightforwardly reflect differences in fiscal stimulus.
First, European rents are subject to a much more rigorous regime of price controls than in the US. To the extent that this allows US rental prices to increase faster, the difference in rental inflation is a reflection of the difference in policies, not fiscal support.
Second, US rental inflation has historically run substantially higher than European rent inflation, perhaps in part due to persistent underinvestment in new housing and social housing in the US. Much of the post-pandemic increase in rent in the US is simply a return to pre-pandemic levels: US rental inflation now only modestly exceeds pre-pandemic levels.
Source: Bureau of Labor Statistics and Eurostat
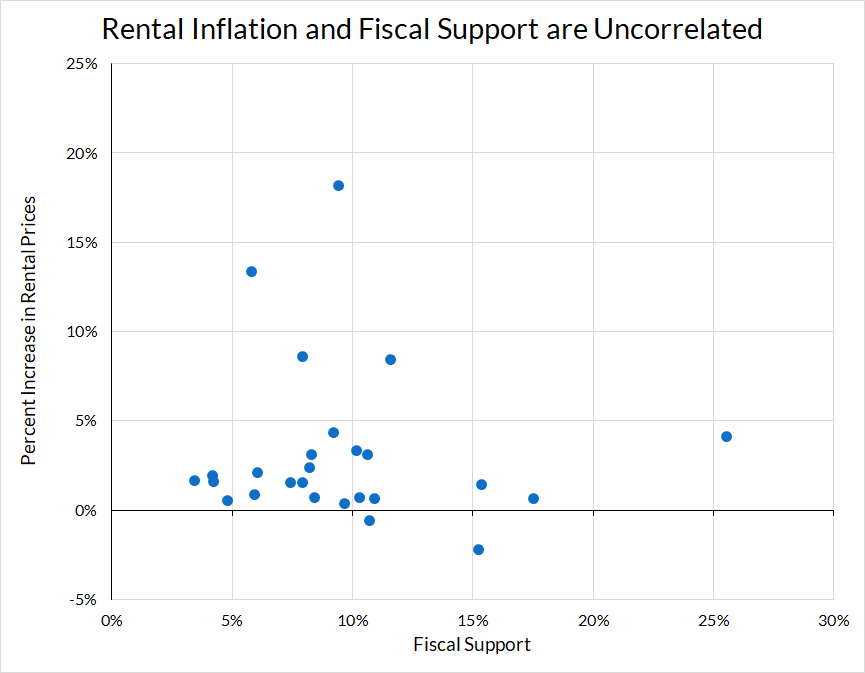
Finally, if one looks closer at the European data, rental inflation is uncorrelated with fiscal support. The graph below plots rental inflation against fiscal support. Rental inflation is defined as the 12-month change in the rental component of the HICP (for European countries) or CPI (for the US), ending February 2022. Fiscal support is taken from the IMF Database of Fiscal Policy Responses to COVID-19, and is defined as the total additional discretionary spending or foregone revenues from January 2020 through September 2021, as a percentage of GDP in 2020.
Source: Bureau of Labor Statistics, Eurostat, and IMF.
While both rental inflation and fiscal support in the US were higher than Europe, within Europe – where rent control policies are likely more similar than different – there does not appear to be any connection between the two.
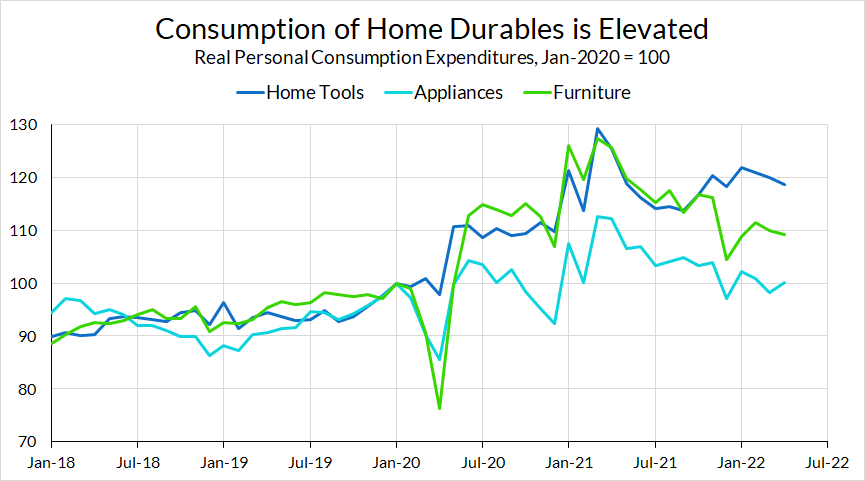
Home Goods
Household goods are another category that made outsized contributions to aggregate US inflation, due to the faster growth of prices of furniture, appliances, tools, and other consumer durables in the US.
Category
US Contribution
EA Contribution
Difference
Household furniture
0.21%
0.10%
0.11%
Household appliances
0.02%
0.02%
0.00%
Major household appliances
0.01%
0.02%
-0.01%
Small electric appliances
0.01%
0.00%
0.01%
Tools and equipment
0.13%
0.01%
0.11%
Cleaning, maintenance products
0.03%
0.01%
0.02%
Sources: Bureau of Labor Statistics, Eurostat, and Author’s Calculations. Contributions are to the 12-month change, ending February 2022, in the CPI less owner-occupied economic rent in the US and the HICP for EA-18. Contributions are calculated using the Ribe method (HICP Methodological Manual pg. 182).
This is an area where consumer demand does appear to have a more proximate relationship with certain price increases. Real consumption of household durable goods is substantially above pre-pandemic levels, though we have recently seen some reversion to pre-pandemic trends—if not levels—of consumption.
Source: Bureau of Economic Analysis
Electricity and Gas
While most items contributed more to US inflation than in Europe, household energy (electricity and natural gas) is the one major area where Europe has seen substantially stronger price increases than the US.
Category
US Contribution
EA Contribution
Difference
Electricity
0.29%
0.96%
-0.67%
Natural gas
0.22%
0.75%
-0.53%
Sources: Bureau of Labor Statistics, Eurostat, and Author’s Calculations. Contributions are to the 12-month change, ending February 2022, in the CPI less owner-occupied economic rent in the US and the HICP for EA-18. Contributions are calculated using the Ribe method (HICP Methodological Manual pg. 182).
Source: Bureau of Labor Statistics and Eurostat
As others have pointed out, this difference is not due to elevated demand in Europe. Rather, a reliance on imported resources for producing critical energy services means Europe is more susceptible in the face of a global natural gas shortage. Even before the invasion of Ukraine, European gas supply was hit particularly hard by tightening Russian exports of gas (even before the invasion of Ukraine) and a particularly cold winter. These factors led to much faster inflation in natural gas and electricity in Europe, despite the prevalence of price controls and caps on energy there. In the absence of such an aggressive set of “consumer shielding” price control measures, European headline HICP inflation would be meaningfully higher and the divergence between US and European inflation outcomes would be less obvious, despite the different underlying dynamics.
Restaurants and Hotels
Restaurants and hotels have also contributed to the excess inflation in the United States. Like many other areas, prices in this sector have been affected by a myriad of factors. Disentangling the effects of the goods-service rotation, labor shortages, pent-up demand, and fiscal support is difficult.
Inflation in restaurants has consistently measured higher in the US than in Europe, and diverged over the course of 2020. It’s worth noting that since the ARP was passed, restaurant inflation in both the US and Europe have risen.
Source: Bureau of Labor Statistics and Eurostat
Hotel prices in the US did increase far faster than in Europe following the ARP, although part of this can be attributed to the fact that hotel prices in the US fell in 2020, whereas European hotel prices remained relatively steady (compared to 2019), leading to larger base effects in the US.
Food
Finally, food is a category that is worth disaggregating. While food in general contributed more to inflation in the US, this was not true across the board. In fact, some items, such as breads and fresh vegetables, saw less inflation in the US than in Europe.
Category
US Contribution
EA Contribution
Difference
All Food and Beverage
0.99%
0.79%
0.21%
Bread and cereals
0.11%
0.14%
-0.04%
Bread
0.02%
0.06%
-0.04%
Breakfast cereals
0.01%
0.00%
0.01%
Meat
0.19%
0.13%
0.06%
Beef and veal
0.10%
0.04%
0.06%
Pork
0.06%
0.01%
0.05%
Poultry
0.06%
0.04%
0.02%
Fish and seafood
0.04%
0.05%
-0.01%
Fresh or chilled fish
0.02%
0.03%
0.00%
Eggs
0.02%
0.02%
0.00%
Oils and fats
0.03%
0.06%
-0.03%
Fruit
0.08%
0.06%
0.02%
Unprocessed vegetables
0.03%
0.11%
-0.08%
Sugar and Sweets
0.03%
0.02%
0.01%
Non-alcoholic beverages
0.08%
0.05%
0.03%
Coffee, tea and cocoa
0.03%
0.03%
0.00%
Other soft drinks
0.05%
0.02%
0.03%
Alcoholic beverages
0.02%
0.02%
0.00%
Spirits
0.00%
0.00%
0.00%
Wine
0.01%
0.01%
0.00%
Beer
0.01%
0.01%
0.00%
Sources: Bureau of Labor Statistics, Eurostat, and Author’s Calculations. Contributions are to the 12-month change, ending February 2022, in the CPI less owner-occupied economic rent in the US and the HICP for EA-18. Contributions are calculated using the Ribe method (HICP Methodological Manual pg. 182).
Meat in the US stands out as a significant contributor to inflation that could be plausibly linked to the fiscal stimulus checks and faster recovery in the US labor market. Meat consumption has been running higher than pre-pandemic levels. Early in the pandemic, this was likely due to consumers substituting food at home for restaurants, yet, even as restaurant consumption picked back up in 2021, at-home meat consumption remained elevated.
Source: Bureau of Economic Analysis
Conclusion
Inflation is by definition an aggregation of individual price changes. Any argument that relies on differences in inflation aggregates between economies must be founded on a solid understanding of both the aggregate phenomenon and the disaggregated component prices. Note that an inquiry into the disaggregated phenomena does not diminish the potential relevance of macro- demand-related phenomena to still matter at the micro level. As our analysis has shown, when one breaks down inflation differences between the US and Europe to its granular components, one can still find that fiscal stimulus likely played some role, even as the composition of price increases suggest additional dynamics of relevance. Fiscal stimulus mattered, but so too did supply shocks, price control policies, and differences in economic structure across countries. Without understanding which factors were at play in each component, pointing to differences in headline inflation as evidence against the necessity of fiscal stimulus misses crucial parts of the story.
In the next installment of this series, we’ll take a closer look at these other factors. Armed with an understanding of which components mattered for the divergence in inflation between the US and Europe, we’ll proceed to try to understand the causes of the divergence in these components. This understanding will put us in a better position to speak to how much of the inflationary difference can be reasonably attributed to elevated demand in the US, and in particular, the American Rescue Plan.
The link has been copied!
Your link has expired. Please request a new one.
Your link has expired. Please request a new one.
Your link has expired. Please request a new one.
Great! You've successfully signed up.
Great! You've successfully signed up.
Welcome back! You've successfully signed in.
Success! You now have access to additional content.