Not So Scary After All: Disinflation and the Phillips Curve
In our previous piece in our vacancies series, we took a deep dive into Ball, Leigh and Mishra (2022), “Understanding U.S. Inflation During the COVID Era,” a paper presented at the Brookings Papers on Economic Activity Conference in September 2022. The paper, which warned that the Fed’s...
In our previous piece in our vacancies series, we took a deep dive into Ball, Leigh and Mishra (2022), “Understanding U.S. Inflation During the COVID Era,” a paper presented at the Brookings Papers on Economic Activity Conference in September 2022. The paper, which warned that the Fed’s inflation target was not likely to be achieved without substantial increases in unemployment or extremely optimistic assumptions, relied on a Phillips curve with mechanisms that we have been consistently skeptical about: inflation expectations and job openings.
In this piece, we take a look at how the predictions of that model have held up. Since the paper was released, unemployment has remained low, vacancies have remained high, but inflation in both prices and wages came down quickly. Acknowledging that the model did not make unconditional predictions about inflation, I feed in the realized path of the variables that supposedly explain inflation, which the authors did not know at the time.
Even with full access to the data since the time of publishing, the model does not predict the rapid disinflation that happened in 2022 Q4. While the path to returning to 2% inflation is likely to remain bumpy in the upcoming months, the fact that the model with full information does not forecast any disinflation should cast serious doubt on the use of reductive Phillips curve thinking in setting policy during this pivotal time, especially when the model calls for a substantial increase in joblessness to achieve disinflation.
Introduction
In our vacancies series we wrote about the pitfalls of using vacancies to gauge the labor market and the challenges of using Phillips Curve-style regressions to forecast inflation. One paper we covered in that series was Ball, Leigh and Mishra (2022), “Understanding U.S. Inflation During the COVID Era”, which was presented in September 2022 at the Brookings Papers on Economic Activity, an influential conference attended by high-profile economists.
It’s worth taking a look at what was said at the time. One commentator called the assumptions that the Beveridge Curve would shift back “incredibly optimistic” and the notion that inflation expectations would normalize to be “absolutely out of the question.” Another called for even tougher Fed action, saying that “the recession is probably going to be a serious recession.”
The ironic thing is, they were half-right. The Beveridge Curve did not shift back. The inflation expectations used in the paper did not fall. Despite all that, we’ve seen disinflation in both prices and wages against a backdrop of historically low unemployment and sky-high vacancies. We should dispense with the idea that unemployment is always necessary to reduce inflation.
The main takeaway of the paper was that under the Fed’s projections for unemployment at the time (which had unemployment rising to 4.1% by the end of 2024), inflation would only return to near its target rate under the most optimistic assumptions. Under less benign assumptions, substantially higher unemployment would be required to achieve disinflation. The release of the paper was covered with some frightening headlines:
Since the paper was released, inflation has come down substantially. The three-month annualized change in the CPI fell from 11% in June 2022 (7.9% for core) to 1.8% in December (3.1% for core). On the wage front, the annualized growth rate of the Employment Cost Index fell from 5.4% to 4.0% over the same period. All this has happened even against a backdrop of record-low unemployment and persistently high job openings, resulting in a high VUR. While VUR has dropped slightly from its post-pandemic peak in March 2022, the level is still higher than at any point in 2021 and far higher than during the pre-pandemic era.
Source: Bureau of Labor Statistics
Why has inflation fallen much harder and much more quickly than Ball, Leigh and Mishra (2022) predicted? In this piece, I take another look at the model and its conditional forecasts. The paper made conditional forecasts of inflation, depending on the way that inflation expectations, the Beveridge Curve, and inflation shocks played out.
I find that this Phillips curve-style model[1] cannot explain the disinflation in 2022 Q4. On one hand, inflation shocks (as defined by the paper) came in negative in the latter half of 2022. On the other hand, the Beveridge Curve remains shifted outwards, in between the “optimistic” and “pessimistic” scenarios in the paper. Inflation expectations increased in 2022 Q4, in between the paper’s moderate and pessimistic scenarios.
Source: Bureau of Labor Statistics, Cleveland Fed, Survey of Professional Forecasters, Author’s Calculations using Ball, Leigh and Mishra (2022). The “optimistic scenario” is the model’s implied path of median CPI inflation given the June, 2022 SEP forecast of the unemployment rate trajectory, a Beveridge Curve that shifts back quickly inflation expectations that return to 2.2%, and headline shocks equal to zero starting in August 2022. The “full-information model” is the model’s implied path of median CPI inflation given the actual path of inflation expectations, VUR, and headline shocks.
Given the actual path of vacancies, unemployment, shocks, and expectations, the model predictions do not change substantially: the model still predicts persistently high inflation through the end of 2022. While there were some negative headline shocks that lower the predicted inflation path, the fact that the VUR remains high keeps the predicted median CPI inflation rate at around 7.5% throughout 2022. These results stand in contrast to the actual path of median CPI since then: median CPI growth spiked in August but quickly fell below the predictions of the model, growing at a rate of 6.5%, 5.6%, and 4.6% during the last three months of the year. In short, the model cannot explain the recent disinflation, even given full information about expectations, vacancies, and headline shocks.
The Phillips Curve Model: Expectations, Shocks, and Vacancies
Ball, Leigh and Mishra (2022) sought to explain the evolution of core inflation, measured using the Cleveland Fed’s Median CPI. They modeled the growth in core inflation as a function of the following:
Inflation expectations, measured by the median 10-year forward CPI forecast from the Survey of Professional Forecasters;
The 12-month average of VUR;
The 12-month average of “headline shocks”, defined as the difference between monthly growth in headline and median CPI.
The authors estimated their model using historical data, then generated inflation forecasts for trajectories of the unemployment rate. In the model, the forecasts are dependent on assumptions about the future path of headline inflation shocks, the extent to which the Beveridge Curve would shift, and the extent to which inflation expectations would remain anchored or adapt to high inflation readings.
The central result of the paper was that higher unemployment would be required to bring inflation down; just how high depended on how much the Beveridge Curve shifts, what happens with headline shocks, and how inflation expectations evolve. Below are the authors’ inflation forecasts under various assumptions about the Beveridge Curve and expectations and using the June 2022 Summary of Economic Projections (SEP) forecasts for unemployment, which put unemployment at 3.7%, 3.9% and 4.1% at the end of 2022, 2023 and 2024 respectively.
Source: Bureau of Labor Statistics, Cleveland Fed, Survey of Professional Forecasters, Author’s Calculations using Ball, Leigh and Mishra (2022). The “optimistic” Beveridge Curve is one that shifts back towards its pre-pandemic state, while the “pessimistic” Beveridge Curve remains outwards at its pandemic-era levels. Solid, dashed, and dotted lines indicate the optimistic, moderate, and pessimistic scenarios for inflation expectations, respectively. In every case, headline inflation shocks are assumed to be zero starting in August 2022.
Because the model’s predictions hinge on the level of VUR, the extent to which the Beveridge Curve shifts back is key to the model’s predictions. If the Beveridge Curve remains shifted outwards, vacancies are high for any given level of the unemployment rate, so VUR at any level of unemployment is higher, leading to higher inflation in the model. Inflation expectations also play a secondary, but significant role in the model. If inflation expectations reanchor quickly (the “optimistic” case), inflation is lower; however, if inflation expectations are more adaptive (the more pessimistic cases), expectations will rise and feed into actual inflation.
In short, we are currently beating the paper’s most optimistic scenarios on both the Beveridge Curve and expectations fronts. But why? A fair assessment of this model would not be to simply compare the conditional forecasts of the model to what actually transpired. The authors were careful to point out that they did not know the trajectory of headline inflation shocks or unemployment at the time, and it would not be entirely fair to judge the model based on that. What the authors forecasted was the trajectory of inflation conditional on the path of headline shocks, the Beveridge Curve, and inflation expectations. In the next section, I explore how each of those have evolved since the paper was released.
The Path of Unemployment, Vacancies, Inflation Shocks, and Expectations
Unemployment and Vacancies
Since the paper was published, the unemployment rate in the last half of 2022 bounced around 3.5% and 3.7%, and never rose to the level of the June SEP forecast. In the figure below, I plot the realized VUR against the VUR implied by the paper’s “optimistic” and “pessimistic” Beveridge Curves. The “optimistic” case is one where the Beveridge Curve shifts back by one-quarter every month to its pre-pandemic state, and the “pessimistic” case is one where the Beveridge Curve stays at its pandemic level.
Source: Bureau of Labor Statistics, author’s calculations following Ball, Leigh and Mishra (2022)
While the Beveridge Curve has shifted back somewhat, the level of VUR is still far above where it would be under the pre-pandemic Beveridge Curve. Over the last three months of 2022, job vacancies were at a level somewhere in between the authors’ “optimistic” and “pessimistic” scenarios.
Headline Shocks
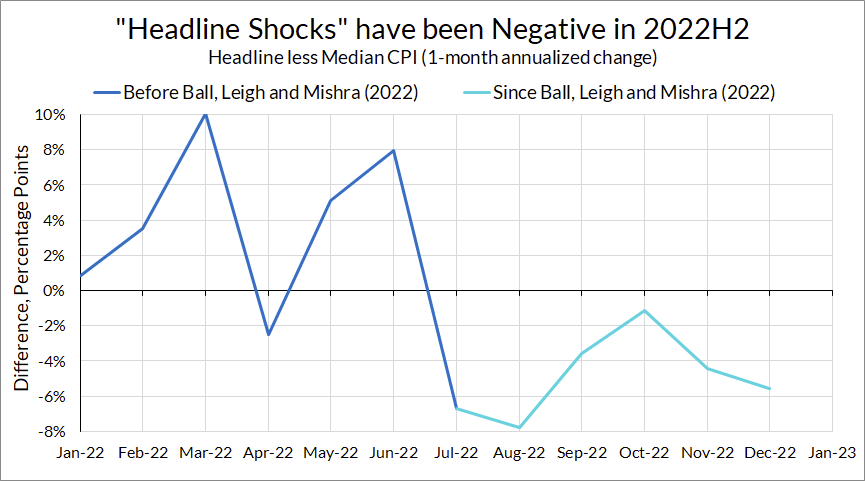
In their forecasts, the authors set future headline inflation shocks (the difference between headline CPI growth and median CPI growth) to zero, noting that these shocks have been “unpredictable and persistent” and leaving the door open to positive or negative shocks. Since the paper was released, these headline shocks have been negative:
Source: Bureau of Labor Statistics, Cleveland Fed, Author’s Calculations
Do these negative headline shocks explain why inflation came in better than expected? To test this, I compare the model forecasts for median inflation with zero headline shocks (as the authors did) and the realized headline shocks, under the actual path of the unemployment rate, an optimistic Beveridge Curve, and the most optimistic expectations scenario.
Source: Bureau of Labor Statistics, Cleveland Fed, Survey of Professional Forecasters, Author’s Calculations using Ball, Leigh and Mishra (2022).
While the actual negative headline shocks do lower the inflation forecast, the effect of these shocks does not change the model’s forecast dramatically. In other words, the fact that the paper did not account for the (at the time) unknown future inflation shocks does not explain the model’s failure to forecast disinflation in 2022 Q4.
Inflation Expectations
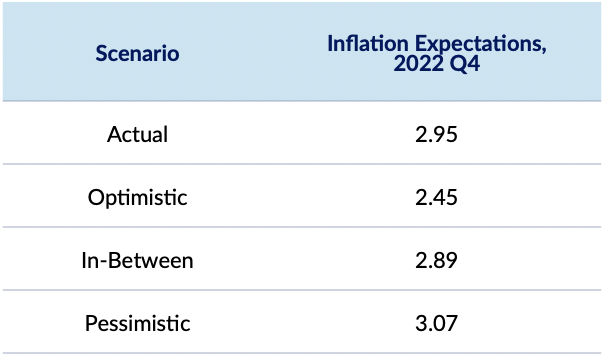
The authors posed three potential scenarios for inflation expectations. Under the optimistic case, inflation expectations would quickly return back to its pre-pandemic level of 2.2%, shifting back one quarter every month. Under the second scenario, inflation expectations would respond to actual inflation in a manner consistent with the pandemic period. Under the third, most pessimistic, scenario, inflation expectations would become far more adaptive and behave as they did during 1985-1998.
In reality, inflation expectations (measured using the SPF median 10-year CPI forecast) ticked upwards in 2022 Q4 from 2.8% to 2.95%. Given the path of realized CPI inflation, this increase is higher than what the first two scenarios would have forecasted, although not as high as the most pessimistic scenario.
Source: Bureau of Labor Statistics, Survey of Professional Forecasters, Author’s calculations following Ball, Leigh and Mishra (2022). Inflation expectations are the median Survey of Professional Forecasters 10-year forecast of CPI inflation.
Can this Phillips Curve Model Explain 2022 Q4 Disinflation?
To fairly test the model, I run a “full-information” scenario with the model. I feed in the realized path of all three of VUR, headline shocks, and inflation expectations through December 2022. Below, I graph the model’s forecasted and actual 1-month annualized change in the median CPI in 2022.
Source: Bureau of Labor Statistics, Cleveland Fed, Survey of Professional Forecasters, Authors’ Calculations. Model forecast uses historical VUR, headline shocks, and SPF 10-year CPI forecasts (the median SPF forecast for 2022 Q4 is assigned to November, and the expectations for December are linearly extrapolated). I use the authors’ estimates of the “core inflation gap” equation and add the estimated gap to actual SPF inflation expectations to obtain a model forecast for median inflation.
Even with all the available information since then, the model does not forecast the 2022 Q4 disinflation. In fact, it doesn’t forecast any disinflation at all, and would have predicted acceleration through the end of 2022. Recall from earlier that actual inflation is now lower than the most optimistic scenarios for the Beveridge Curve and inflation expectations that the authors used. Inflation has been falling, despite:
A lower unemployment rate path than the FOMC projections;
A VUR path that is higher than the most “optimistic scenario” in the paper;
Inflation expectations that are closer to the pessimistic scenario than the optimistic scenario in the paper.
Conclusion
Obviously inflation is not over. It could be the case that over the next few months we will get a few inflation prints that are uncomfortably high, and the path to disinflation is likely to be bumpy. However, the recent performance of the Phillips Curve in explaining recent disinflation should discourage policymakers from relying on it right now. Recent data from the labor market and inflation show that it is possible for inflation to fall without loosening the labor market.
There might be ways to salvage this—maybe playing around with the functional form (shall we use a quartic function this time?), swapping out the SPF inflation measure for another (the Michigan five-year inflation expectations, for example, have fell), or going to another measure of “core inflation” will rationalize the observed disinflation in 2022 Q4.[2] Maybe the JOLTS data is poorly measured given the recent fall in the response rate or the model’s lag structure is incorrectly specified. Or maybe there are one-off supply reasons that can provide an ex-post rationalization for the disinflation (rationalizations that could potentially be retrofitted to explain the initial run-up in inflation itself). While these could all be proffered for reasons to keep using this model for designing policy at this time, the fact that such ex-post explanations are necessary should instead lead Phillips curve users to be more circumspect and cautious about calling for high unemployment to bring down inflation.[3]
Shortly after the Brookings Conference, the Federal Reserve released a Summary of Economic Projections that raised the projected unemployment rate trajectory from 3.9% to 4.4% by the end of this year. This change crossed the line into putting the economy on a path consistent with previous recessions. Since then, wage and price deceleration has materialized in the face of tight labor market indicators. Given those developments, the Fed should back off from the view that significantly higher unemployment will be necessary to fight inflation.
Footnotes:
[1] Specifically, the model I will reference throughout this piece is the main monthly model of the paper forecasting median CPI inflation. I use the parameter estimates presented in Table 1, column 4 of Ball, Leigh and Mishra (2022).
[2] Two could play that game—when the paper was released there was a dispute at the time about whether or not median inflation should be calculated with or without shelter, due to the lags in measured sheltered inflation. While this choice did not change the results much for early 2022, measured shelter inflation has been above median inflation in late 2022, so the median inflation ex-shelter figure is now much lower than the all-items median. For example, the ex-shelter median CPI inflation grew a mere 1.7% annualized in December 2022.
[3] At the time the paper was released, the discussion about unemployment was how high the Fed would have to temporarily raise unemployment in order to bring inflation down. The model predicts, for example, that if the Beveridge Curve remained at its pandemic levels and inflation expectations re-anchor at 2.2%, then one would need 7.5% (the Summers (2022) case) for two years to return inflation to its target level. However, an unreported implication of the model was that further keeping inflation that low would require 7.5% unemployment forever absent a shift back of the Beveridge curve, since the rate of inflation is directly tied to the level of the vacancy-to-unemployment ratio.
The link has been copied!
Your link has expired. Please request a new one.
Your link has expired. Please request a new one.
Your link has expired. Please request a new one.
Great! You've successfully signed up.
Great! You've successfully signed up.
Welcome back! You've successfully signed in.
Success! You now have access to additional content.