The Argument for a Recession is Built on Weak Links: Inflation, Vacancies and Unemployment
This is the second piece of our vacancies series. In this piece, we refute specific vacancy-backed arguments that the Federal Reserve will need to engineer a recession in order to bring inflation under control.
This is the second piece of our vacancies series. Our previous piece explored general reasons to be skeptical of vacancies as a robust indicator of the state of the labor market. In this piece, we refute specific vacancy-backed arguments that the Federal Reserve will need to engineer a recession in order to bring inflation under control.
Introduction
As of the September 2022 FOMC meeting, the Federal Reserve has committed to the view that it will now require recession-level increases in unemployment to reduce inflation. This much is clear from the most recent Summary of Economic Projections, released at the meeting. The Fed now anticipates that the unemployment rate will increase from its current level of 3.5% to 4.4% over the same time period. If the Fed works to bring about these forecasts, the costs to workers will be tremendous. Even a one percent increase in the unemployment rate translates to over a million workers without jobs. Worse yet, it is without precedent that the unemployment rate has increased by 1% in a given 12-month period without increasing further.
The Federal Reserve is not alone in its view. In fact, compared to some commentators, they are relatively optimistic. Recently, Larry Summers has argued unemployment would need to exceed 5% for five years to bring inflation down. Jason Furman has suggested we may need 6.5% for two years to bring inflation back down. A key statistic that these commentators have leaned on is the vacancy-to-unemployment ratio (VUR), which has skyrocketed alongside inflation during the pandemic recovery. Commentators and policymakers argue that the former therefore caused the latter.
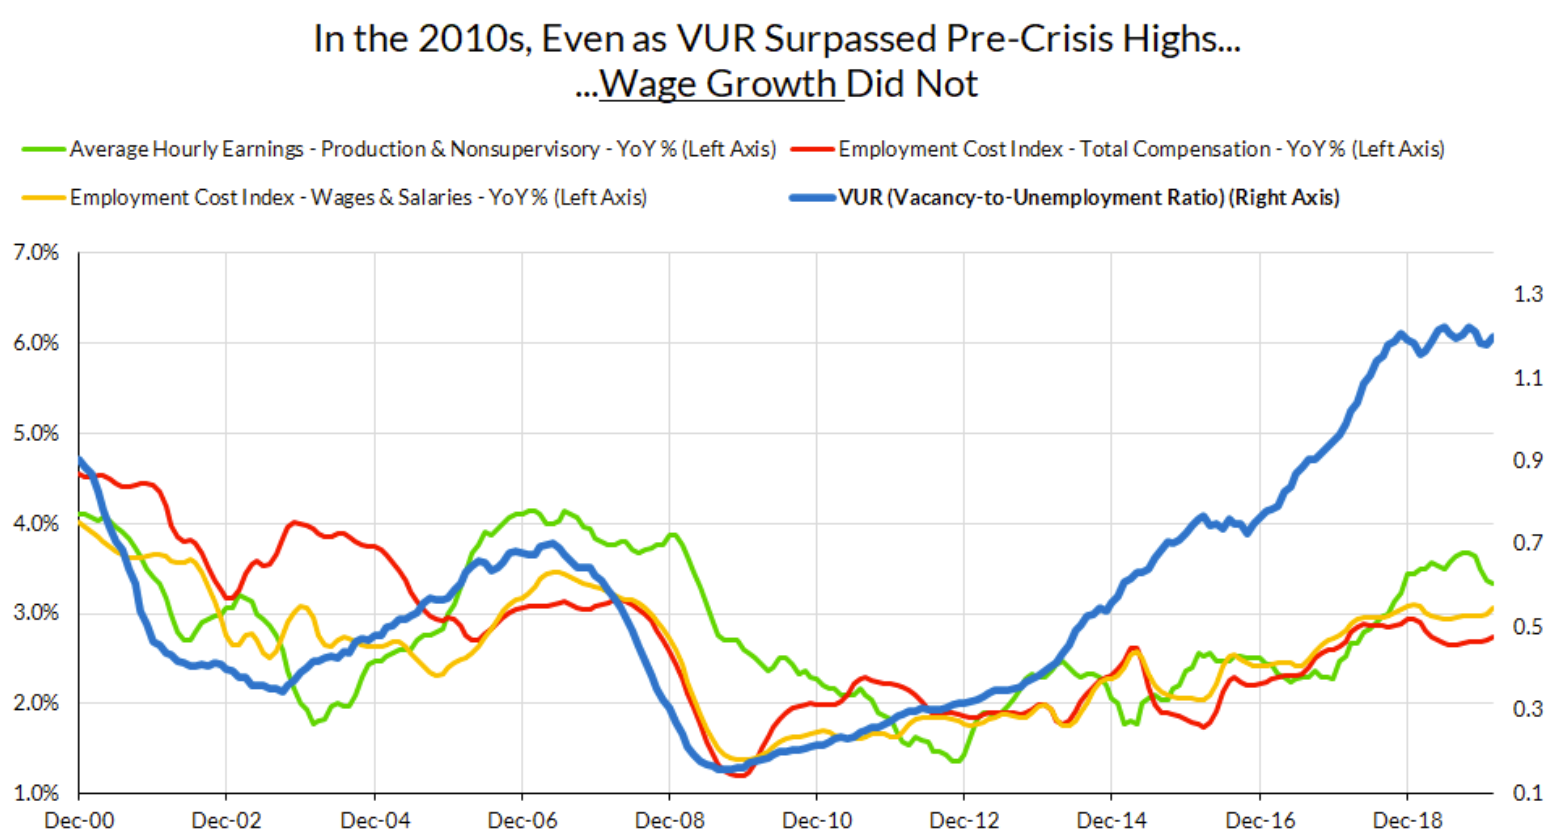
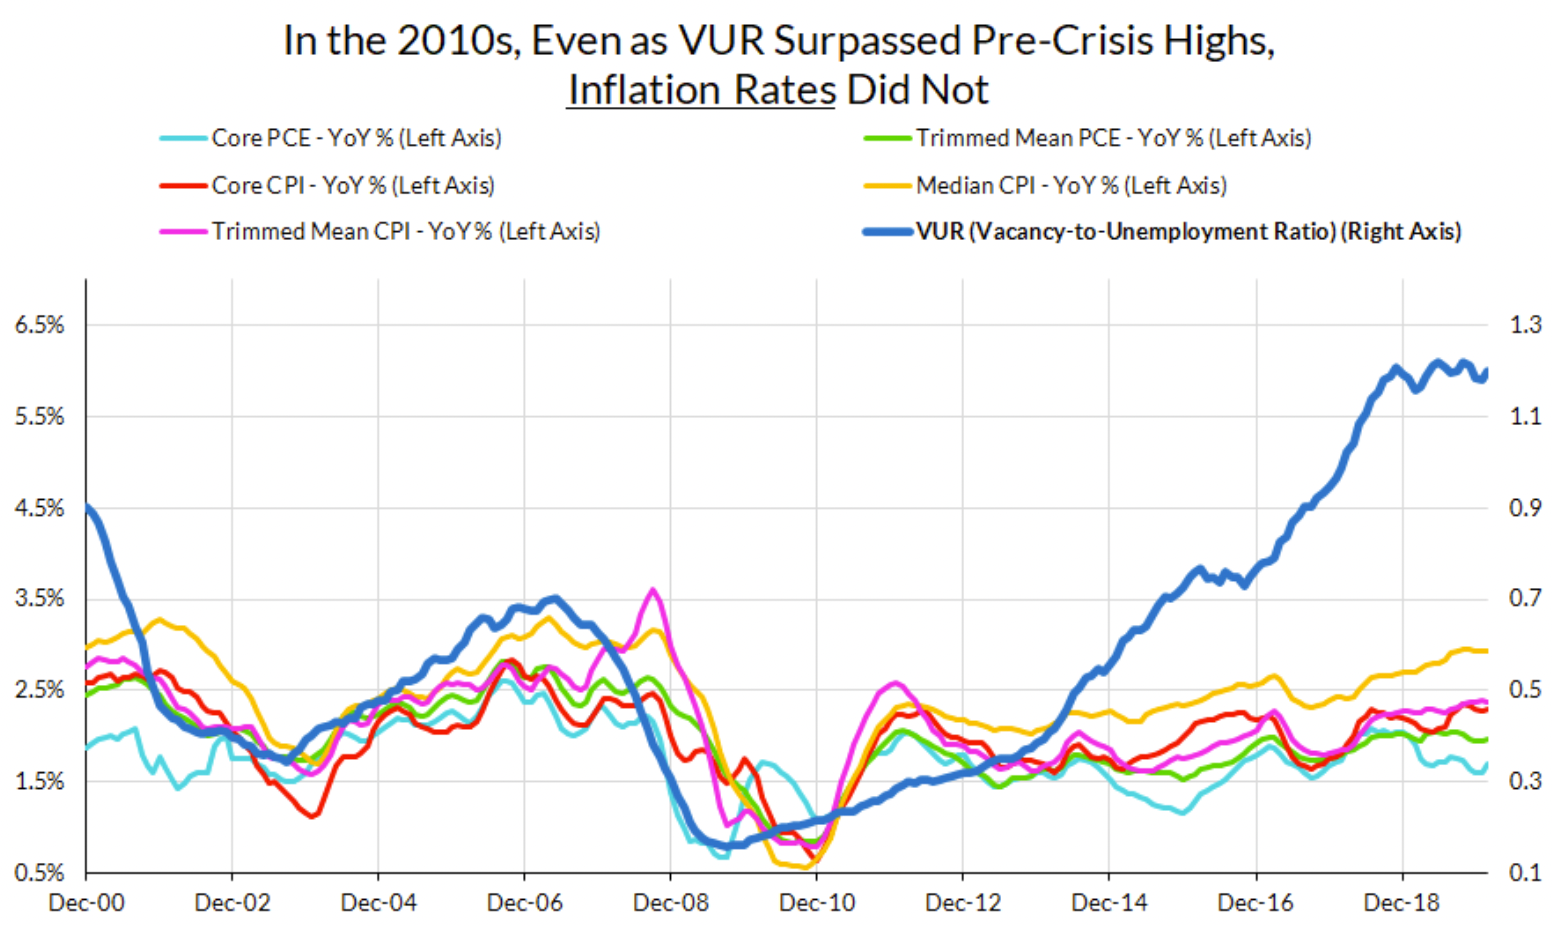
Yet if you look at previous historic highs in VUR, it neither coincided nor correctly anticipated the correct trajectory of inflation. The VUR surpassed its local pre-financial-crisis highs in the middle of 2015 itself. It then continued to make new highs in 2016, then in 2017, again in 2018, and once again in 2019. Despite 5 years of historically elevated VURs, why did nominal wage growth fail to surpass its pre-crisis highs? Why did both nominal wage growth and inflation remain so low? The lurch to now explain inflation and wage growth in terms of a strict level of VUR seems awfully convenient given that it was failing so badly in the previous half-decade. The Fed should think twice before putting so much of their weight on a cherry-picked statistic that fails to survive general robustness checks.
Source: Bureau of Labor StatisticsSource: Bureau of Economic Analysis, Federal Reserve Bank of Cleveland, Bureau of Labor Statistics
These dangerous VUR-centered arguments that the Fed will have to cause a recession and meaningfully higher unemployment to bring down inflation rely on a chain of reasoning with two key links. In the first, inflation is linked to the VUR through the Phillips Curve. The second link connects the VUR to the level of unemployment through the Beveridge Curve, which compares the level of unemployment to the level of job vacancies.
Alone, both of these arguments are empirically weak. We have written at length about the flaws in Phillips Curve type models, while the Beveridge Curve is historically highly unstable. Yet, when yoked together, they seem to present a convincing model to policymakers. So much so that during the September 2022 FOMC press conference, Jay Powell was unequivocal in his view that the vacancy-to-unemployment ratio was the metric by which he was judging labor market tightness:
Vacancies are still almost 2 to 1 ratio to unemployed people, [that] and quits are really very good ways to look at how tight the labor market is and how different it is from other cycles, which where the generally the unemployment rate itself is the single best indicator, we think those things have for quite a time now, really added value in terms of understanding where the labor market is.
Our claim today is that neither link in this causal chain is empirically robust. To demonstrate this, we first assess the link between inflation and the VUR by surveying a paper which claims that VUR is the best measure of labor market slack and the best predictor of wage and price inflation. We then assess the second link in the chain, between the VUR and level of unemployment via the Beveridge Curve, through a second paper which argues that controlling inflation will require reducing VUR, which will in turn necessitate a dramatic rise in unemployment. As we will demonstrate, both arguments stand on poor empirical footing, and do not represent a compelling justification for attempting to throw millions out of work.
Are Vacancies the Best Indicator of Labor Market Tightness?
To investigate the first link – between inflation and the VUR – we look to Domash and Summers (2022). The authors use Phillips Curve-style regressions to test the predictiveness of various slack measures for wage growth and show that the prime-age unemployment rate is more relevant than prime-age labor force participation, while the combination of vacancies and quits is more predictive than the unemployment rate alone. On this evidence, the authors conclude that the current labor market, with its unusually high vacancy rate, is tighter than implied by traditional labor market measures.
It’s not particularly surprising that the authors do not find that the unemployment rate is particularly good at predicting wage growth by itself. After all, the unemployment rate is also a deeply flawed metric for labor utilization. That is why we have advocated for using a variety of indicators, including the prime-age employment rate in addition to unemployment to assess the labor market.
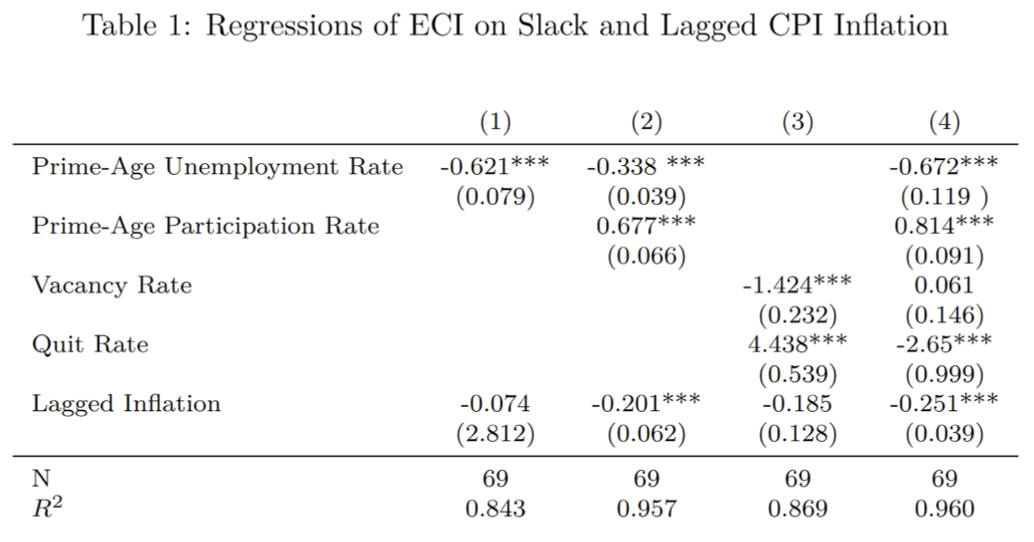
However, even if we follow this paper’s methodology, a model specification which uses both unemployment and labor force participation outperforms one which uses quits and vacancies. As can be seen below, the R-squared of the specification with prime-age unemployment and labor force participation is higher than the specification using the vacancy and quit rate. When the vacancy and quit rates are included in the specification alongside prime-age unemployment and participation, the fit improves only marginally and the vacancy rate is not significant.
Following the Phillips Curve specifications in Domash and Summers (2022), I regress changes in the ECI on the Slack measures (and their lags) and lagged CPI inflation.[1] I favor the ECI specification because unlike other average wage measures, it is adjusted for changes in the composition of the workforce and includes non-wage compensation.
Regressions follow the distributed-lag model with 4-quarter lags as described in Domash and Summers (2022), equation 2 on page 11. All specifications use quarterly data constructed following the description in Domash and Summers (2022), Section 2 and cover the period from 2002q4 to 2019q4. The dependent variable is the 4-quarter moving average of year-over-year changes of the Employment Cost Index (Total Compensation). Slack variables are 4-quarter moving averages of the slack variables. The lagged inflation term is a weighted average of year-over-year changes in the CPI.
Reported coefficients are the sum of the coefficients of the variables and their lags. Constant coefficient not reported for brevity. Newey-West standard errors (lag = 3) reported in parentheses.
This exercise is an illustrative example of the problems with attempts to empirically measure the Phillips Curve. When researchers run Phillips Curve-style regressions, they have a myriad of choices to make about how to model the relationship between inflation and unemployment. For example, researchers need to choose what price measure to use, what slack measure to use, the lag structure of the regression model, how to model (or measure) inflation expectations, and so on. All of these choices can yield different results.[2]
As Justin Wolfers said during the latest Brookings Papers on Economic Activity Conference:
In the end, there are more degrees of freedom than there are observations, which means whatever path inflation might take, some smart research can claim to have plausibly found a Phillips Curve that accounts for that path.
A deeper issue, we believe, is that the Phillips Curve is simply not a great way of describing the nuanced tradeoffs between aggregate labor market conditions and aggregate inflation. As we have written about before, these tradeoffs are dynamic and time-varying, and the labor market can, and has, exceeded levels that would once have previously been considered inflationary.
Does the Pandemic Prove VUR is the Best Indicator?
In a recent paper presented at Brookings, Ball, Leigh and Mishra (2022) also run their own Phillips Curve-style regression in an attempt to explain core inflation (as measured by the Cleveland Fed’s weighted median CPI) as a function of “headline shocks” (deviations of headline CPI inflation from the median), inflation expectations (as measured by the SPF 10-year forecast of CPI) and VUR. The authors claim that fitting this model to the pre-COVID data provides a good prediction of the COVID-era data, thus proving that the COVID-era relationship between inflation and VUR is consistent with the pre-COVID data.
This is already a fairly just-so model, and the model’s ability to fit the post-COVID data relies heavily on the researchers’ decision to fit a cubic function of inflation to the VUR. This cubic function means that the model implies accelerating effects of VUR on inflation at high levels of VUR. While polynomial functions can be useful for flexibly approximating nonlinear relationships between variables, relying on them for out-of-sample predictions is dubious.
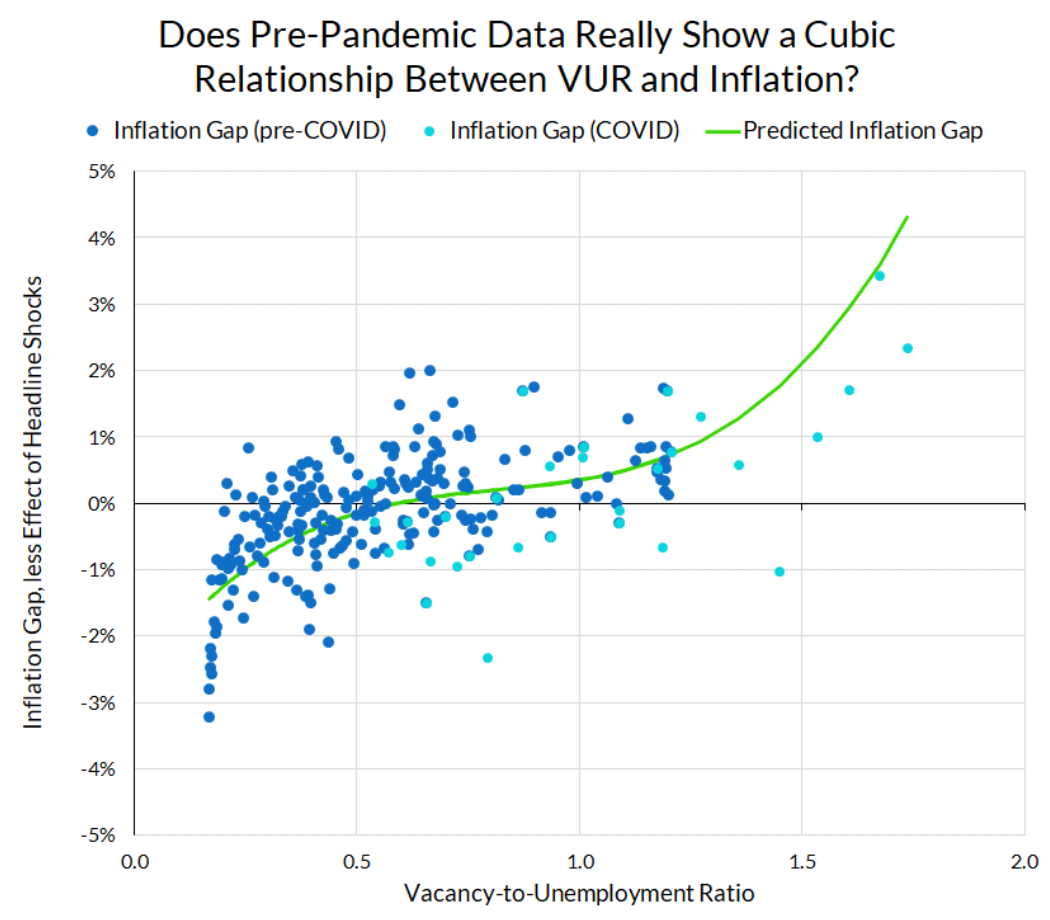
When plotted, it becomes clear how tendentious this conclusion is. The authors claim that the cubic model of inflation and VUR (represented by the green line) fitted to the pre-COVID data (plotted in dark blue) provides a good prediction of the post-COVID data (plotted in light blue).
Inflation gaps are calculated as the difference between weighted 12-month median inflation and the SPF 10-year forecast of CPI. Headline Inflation shocks are the 12-month average of the difference between monthly headline inflation rates and monthly Cleveland Fed weighted median inflation rates. The inflation gap less the effect of the headline shock is the inflation gap less the contribution of the headline shock implied by the regression results in Ball, et. al (2022), Table 1, Column 3. The vacancy-to-unemployment ratio is the 12-month average of the monthly vacancy-to-unemployment ratio. The predicted inflation gap is the predicted effect of the VUR on the inflation gap in a given month, using the cubic coefficients on VUR in Ball, et. al (2022), Table 1, Column 3.
However, the high levels of VUR during COVID—where the cubic function predicts a steep relationship between inflation and VUR—are completely out of the range of the pre-COVID data. It is hard to see any evidence of the accelerating relationship between inflation and VUR in the pre-COVID data. While the cubic model does fall close to the post-COVID data, it’s a huge stretch to say that this was informed by the pre-COVID data.
In the end, the authors’ claim that the high inflation in the post-COVID period is historically consistent isn’t actually based on decades of past data. Rather, the claim rests on a single episode—2022—where we see both unusually high inflation and VUR.
Will Bringing Down Inflation Require Sharp Rises in Unemployment?
With this model constructed, the authors then run scenario analyses on possible paths for unemployment and inflation. They argue that it won’t be possible for inflation to come down while unemployment remains low–arriving at a traditional unemployment-based Phillips Curve model through the back door.
In the paper, the authors game out implied inflation paths based on different unemployment paths. The basic recipe is the following:
Make some assumptions about the path of inflation expectations, unemployment, and headline shocks;
For a given path of the unemployment rate, use the Beveridge Curve to estimate how VUR would change;
From VUR, inflation expectations, and headline shocks, infer the path of core inflation.
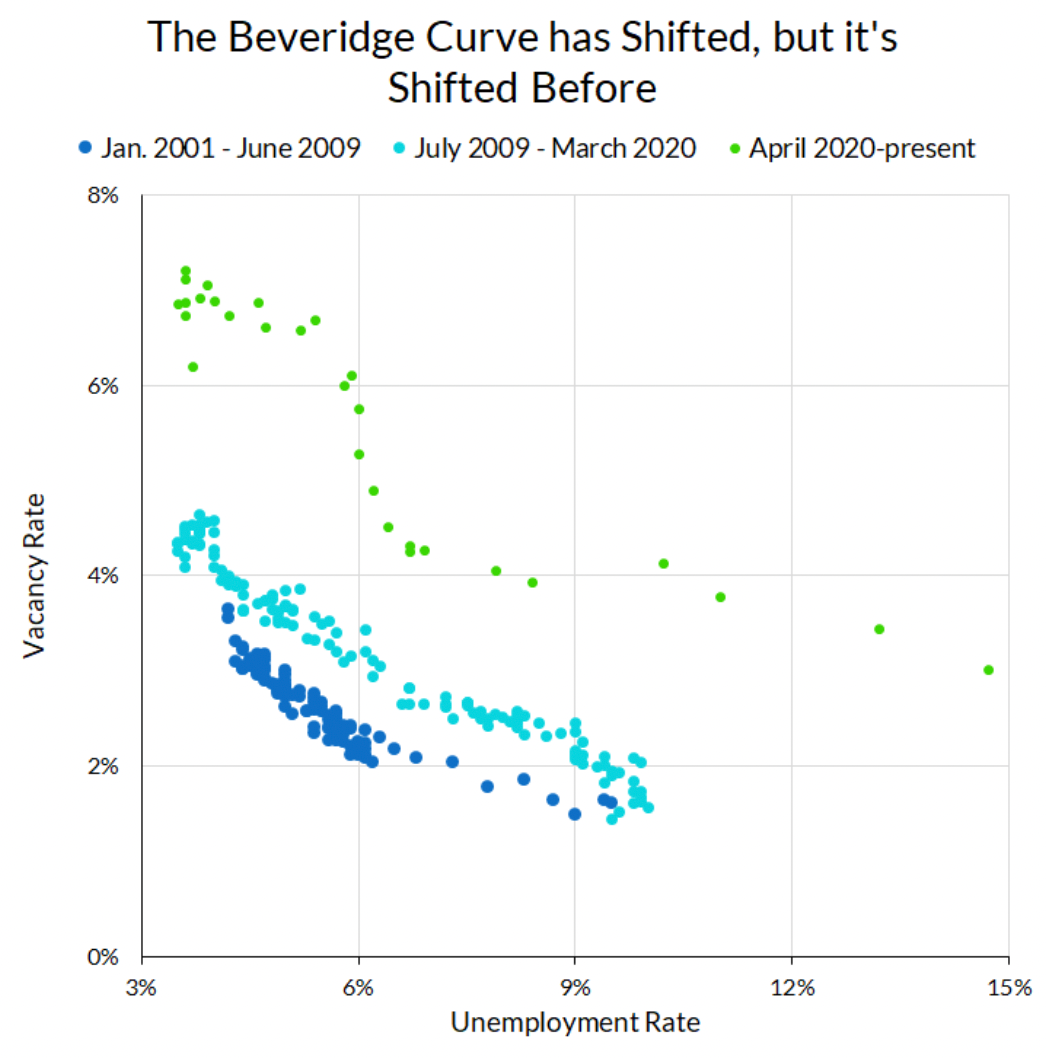
For unemployment to influence inflation in this model, it must pass first through the Beveridge Curve via the VUR before being combined with inflation expectations and headline shocks to predict inflation. In practice, this means the location of the Beveridge Curve determines how unemployment relates to vacancies, which determines the level of unemployment “necessary” to control inflation–the second link in the causal chain mentioned in the introduction.
If the Beveridge Curve shifts out—as it has during the pandemic, when unemployment and vacancies remained consistently elevated—then this model necessarily requires higher unemployment in order to achieve any given level of VUR. And, as the argument goes, if the economy needs VUR to return to pre-pandemic levels to see inflation return to low levels, that means we’ll need higher unemployment for any given target of inflation unless the Beveridge Curve completely shifts back to its prior level. They conclude that a plausible path to return to low inflation involves two years of unemployment at 7.5%, which would result in over 6 million more unemployed.The pandemic is not the first time the Beveridge Curve has shifted and it will likely not be the last. During the Great Recession, the Beveridge Curve shifted out and never returned to its pre-Recession state. If one were to bring this model back in time to 2009, one would have expected to see substantially higher inflation, and thought it necessary for the Federal Reserve to pursue higher unemployment to bring VUR back to levels consistent with low inflation. Thankfully, that didn’t happen.
Source: Bureau of Labor Statistics
Instead, the period after the Great Recession saw low unemployment, consistently rising VUR (exceeding its pre-crisis levels), and low and stable inflation at levels comparable to the pre-Recession period. It would have been an incredibly costly mistake for the Federal Reserve to slow the recovery (more than it already was) under the assumption that the relatively higher VUR would lead to higher inflation. Yet, we are asked to believe that this line of thinking is adequate for policymaking today.
To be fair, one could have said this about other labor market indicators as well. During the latter half of the 2010s, the economy broke through previous ceilings of “full employment”, delivering—by some metrics—a stronger labor market than before the Great Recession. The key takeaway here is that it is a mistake to assume that we must return to pre-crisis levels of job openings in order to defeat inflation. As we wrote in “Beyond the Phillips Curve”:
“The Fed must tread carefully to avoid an additional pitfall: that these estimates represent binding long-term values, and not interim targets and goals. As we have argued at length, the possibilities for “maximum employment” are dynamic, and change as the economy changes. By giving estimates for specific years, but not for a sui generis “longer run,” the Fed can help communicate to commentators and market makers that there is no ultimate, final point to labor utilization beyond which the economy cannot progress.”
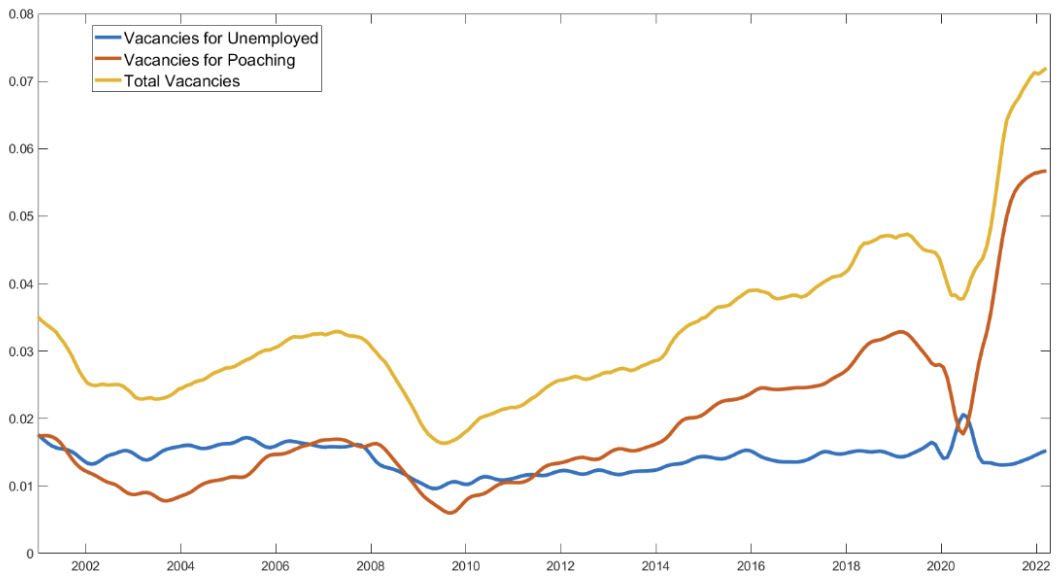
Why might the vacancy statistics be telling us a different story about the labor market during the COVID recovery? One possible explanation comes from a new paper from Anton Cheremukhin and Paulina Restrepo-Echavarria at the St. Louis Fed. Cheremukhin and Restrepo-Echavarria consider the important fact that the employer-to-employer transition rate has been extremely high during the COVID recovery, and propose a model where vacancies take two forms: one type of vacancy is targeted at the unemployed, and another is targeted at the already employed. When they fit this model to the data, they find that the reason for the observed shift in the Beveridge Curve is due to an increase in the vacancies target the employed.
This suggests a possible path to the soft landing that Summers, Furman and others have written off: the Fed taps the brakes and the economy slows without crashing as inflation falls. The “pain” inflicted on the labor market is felt through a slowdown in churn and poaching, which in turn should slow wage growth (Moscarini and Postel-Vinay (2022) show that the rate of employer-to-employer transitions is highly predictive of wage growth). This slowdown in gross labor income feeds through, eventually, into slower inflation—but without the nightmare scenario of rapidly rising unemployment. Recent events are encouraging on this front; since March 2022, the job openings rate has declined from its high of 7.3 to 6.2, but unemployment has remained steady during the same period.
If the interpretation of VUR really has changed over the past two years, then one can’t simply measure the state of the labor market by comparing today’s relatively high VUR readings to those from before the pandemic. Clearly, the COVID disruption has also caused disruptions to the relationship between the various labor market indicators, and there is a lot we still don’t know. In light of this uncertainty, the Fed should be wary about comparisons of the relatively high VUR to the pre-COVID period to rationalize the need to push the economy into a recession.
Conclusion
The Federal Reserve thinks it is necessary to raise unemployment substantially in order to tame inflation and some commentators want to go even further. These claims are often based on a strong reliance on a single dubious labor market indicator: the vacancy-to-unemployment ratio. The recent models which rely on VUR to establish the amount of labor market pain “necessary” to lower inflation are not robust, and translate low-quality data into tenuous claims.
Given the stakes and the thinness of the evidence, the Federal Reserve is unnecessarily risking the well-being and livelihoods of millions of Americans by charting a path to take the economy into a recession. It would be more appropriate to be cautious with the pace of rate increases; instead of engineering higher unemployment, a better and more prudent path can be pursued.
[1] The measure of ECI changes is the year-over-year change in the log ECI. The slack variable is the quarterly average of the monthly measure. The lagged inflation term is the weighted average of CPI inflation as described in Domash and Summers (2022), page 10.
[2] In the results I present here, I use the ECI as the measure of wages. However, I found that vacancies and quits perform similarly to unemployment and participation when using average wages from the Current Population Survey and the Occupational Employment and Wage Statistics. I favor the ECI specification because the ECI is adjusted for composition and includes benefits, not just wages and salaries, and is therefore the better measure of employment cost.
The link has been copied!
Your link has expired. Please request a new one.
Your link has expired. Please request a new one.
Your link has expired. Please request a new one.
Great! You've successfully signed up.
Great! You've successfully signed up.
Welcome back! You've successfully signed in.
Success! You now have access to additional content.