Jan Core-Cast Post-PCE: No Major Surprises But Jan-Feb Residual Seasonality Seems Likely To Headfake The Fed

Core-Cast is our nowcasting model to track the Fed's preferred inflation gauges before and through their release date. The heatmaps below give a comprehensive view of how inflation components and themes are performing relative to what transpires when inflation is running at 2%.
Most of the Personal Consumption Expenditures (PCE) inflation gauges are sourced from Consumer Price Index (CPI) data, but Producer Price Index (PPI) input data is of increasing relevance, import price index (IPI) data can prove occasionally relevant. There are also some high-leverage components that only come out on the day of the PCE release.
If you'd like to start a 90-day free trial of our exclusive content, you can do so using this link. If you have any questions or would like to see samples of our past content, feel free to get in touch with us.
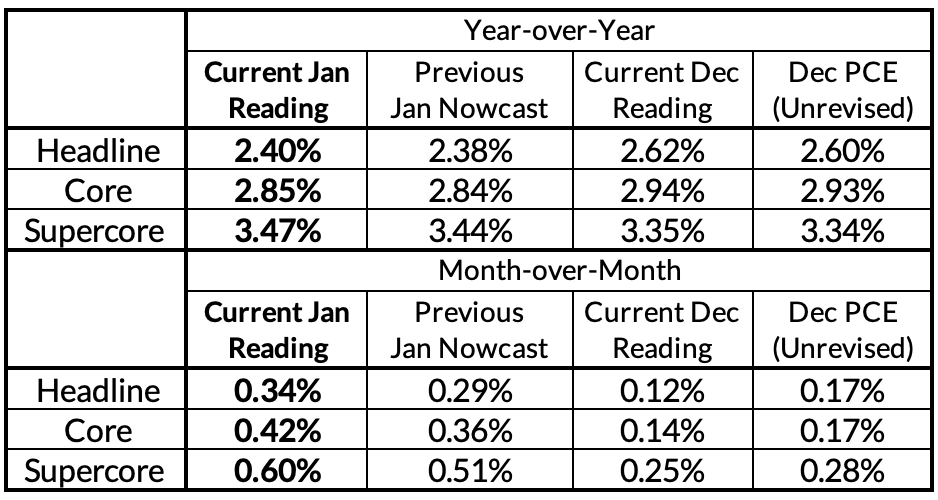
Relative to what we already learned from yesterday's GDP release, our nowcasts are left mostly unchanged on year-over-year basis. On the month-over-month estimates, we saw more downside in December relative to our nowcasts, and more upside in January.
Today's data leaves our baseline views for the inflation outlook and Fed policy relatively unchanged. We expect core inflation to reach 2% sometime between September 2024 and March 2025, depending largely on the scope for further goods deflation and the timeline for housing rent/OER deceleration. Guidance from BLS economists suggests that the pace of housing deceleration remains substantially uncertain (with higher OER in January vaguely attributed to changing weight on single-family rental units).
The Fed could cut as early as May (conditional on especially good February inflation data) but recent Fedspeak revealed how the Fed is more likely to be headfaked by residual seasonality in the Jan-Feb inflation data. We don't actually think inflation is genuinely "re-accelerating," but it can look that way if you don't fully appreciate how "new year, new prices" is hard to pick up in seasonal adjustment across both the January and February inflation data. As a result, in our modal view, the Fed is poised to wait until June to deliver its first interest rate reduction in 2024.
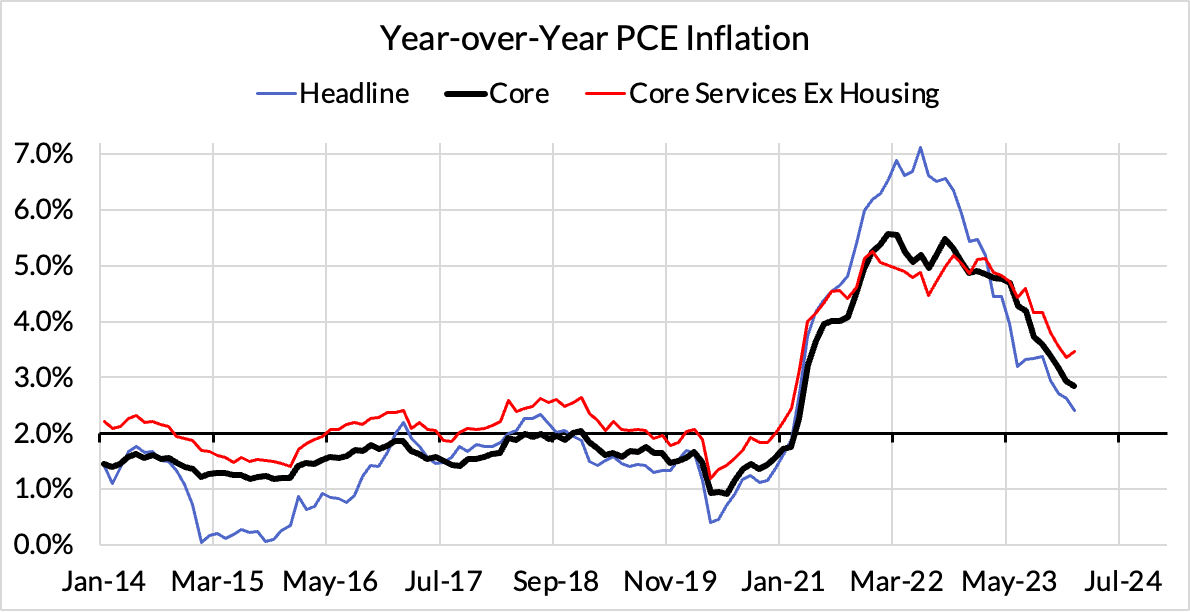
January and February are fat-tailed months for inflation data and deserve a firmer contextualization than simply looking at shorter-term annualized run rates. When seasonal patterns are in flux, year-over-year comparisons have relative wisdom (and why we did not think 6-month Core PCE run rates would serve as sufficient evidence for a cut on their own). Relative to the previous January and accounting for the equity market upside effect on core PCE in January 2024, the data is still reasonably encouraging. Year-over-year readings for core inflation continue to fall and should fall further in the coming months. As we get over the January-February hump, we should start to see more visible progress in the month-over-month Core PCE readings in outright terms.
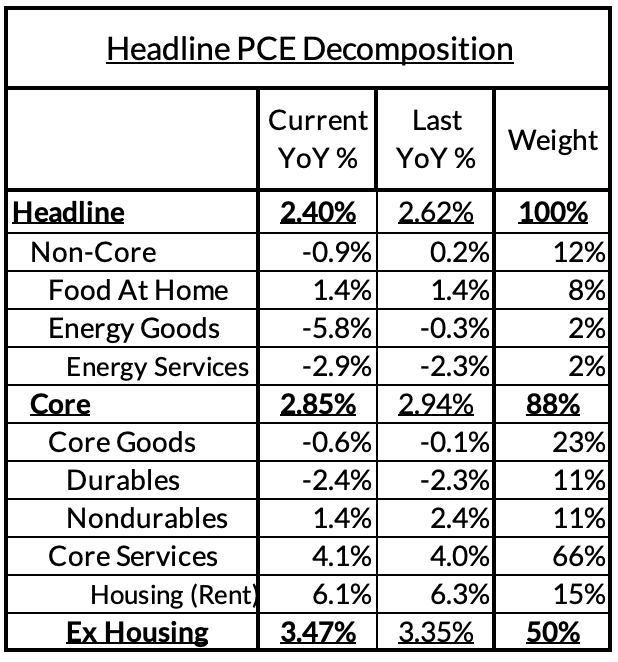
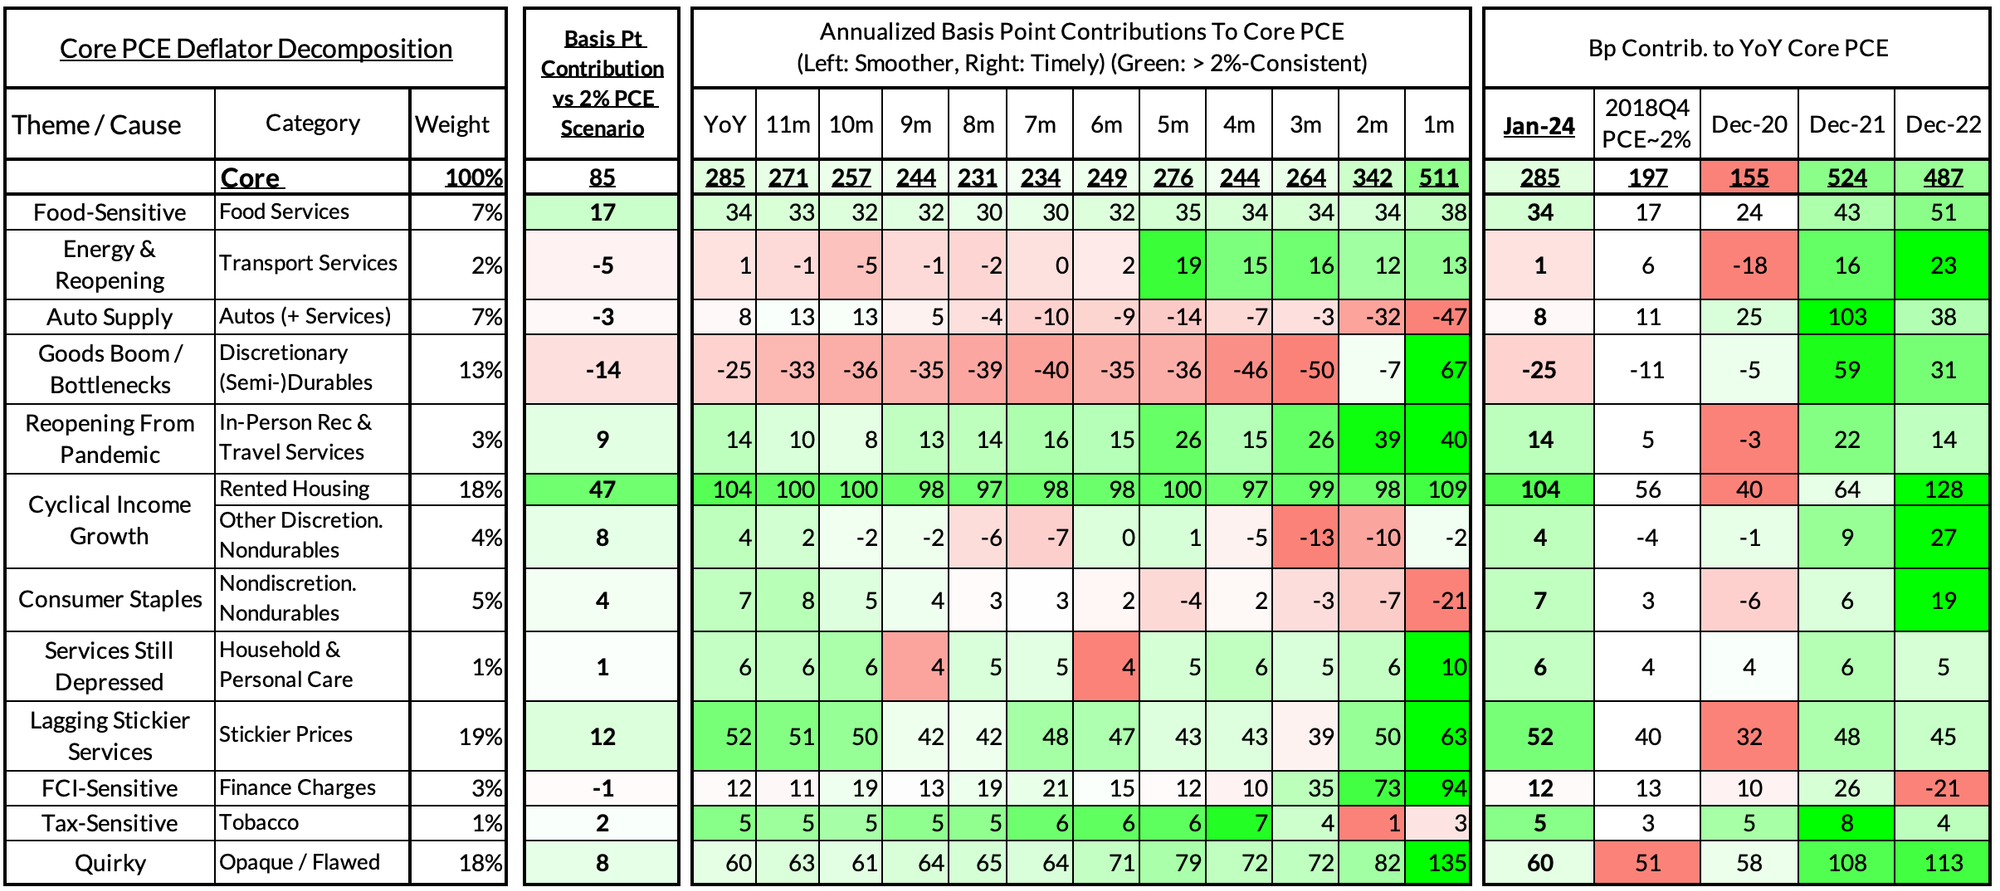
Core PCE (PCE less food products and energy) ran at a 2.85% year-over-year pace as of January, 85 basis points above the Fed's 2% inflation target for PCE. That overshoot is disproportionately driven by catch-up rent CPI inflation in response to the surge in household formation (a byproduct of rapidly recovering job growth) and market rents in 2021-22. Rent is contributing 47 basis points to the 85 basis point core PCE overshoot.
There are other contributors to the overshoot:
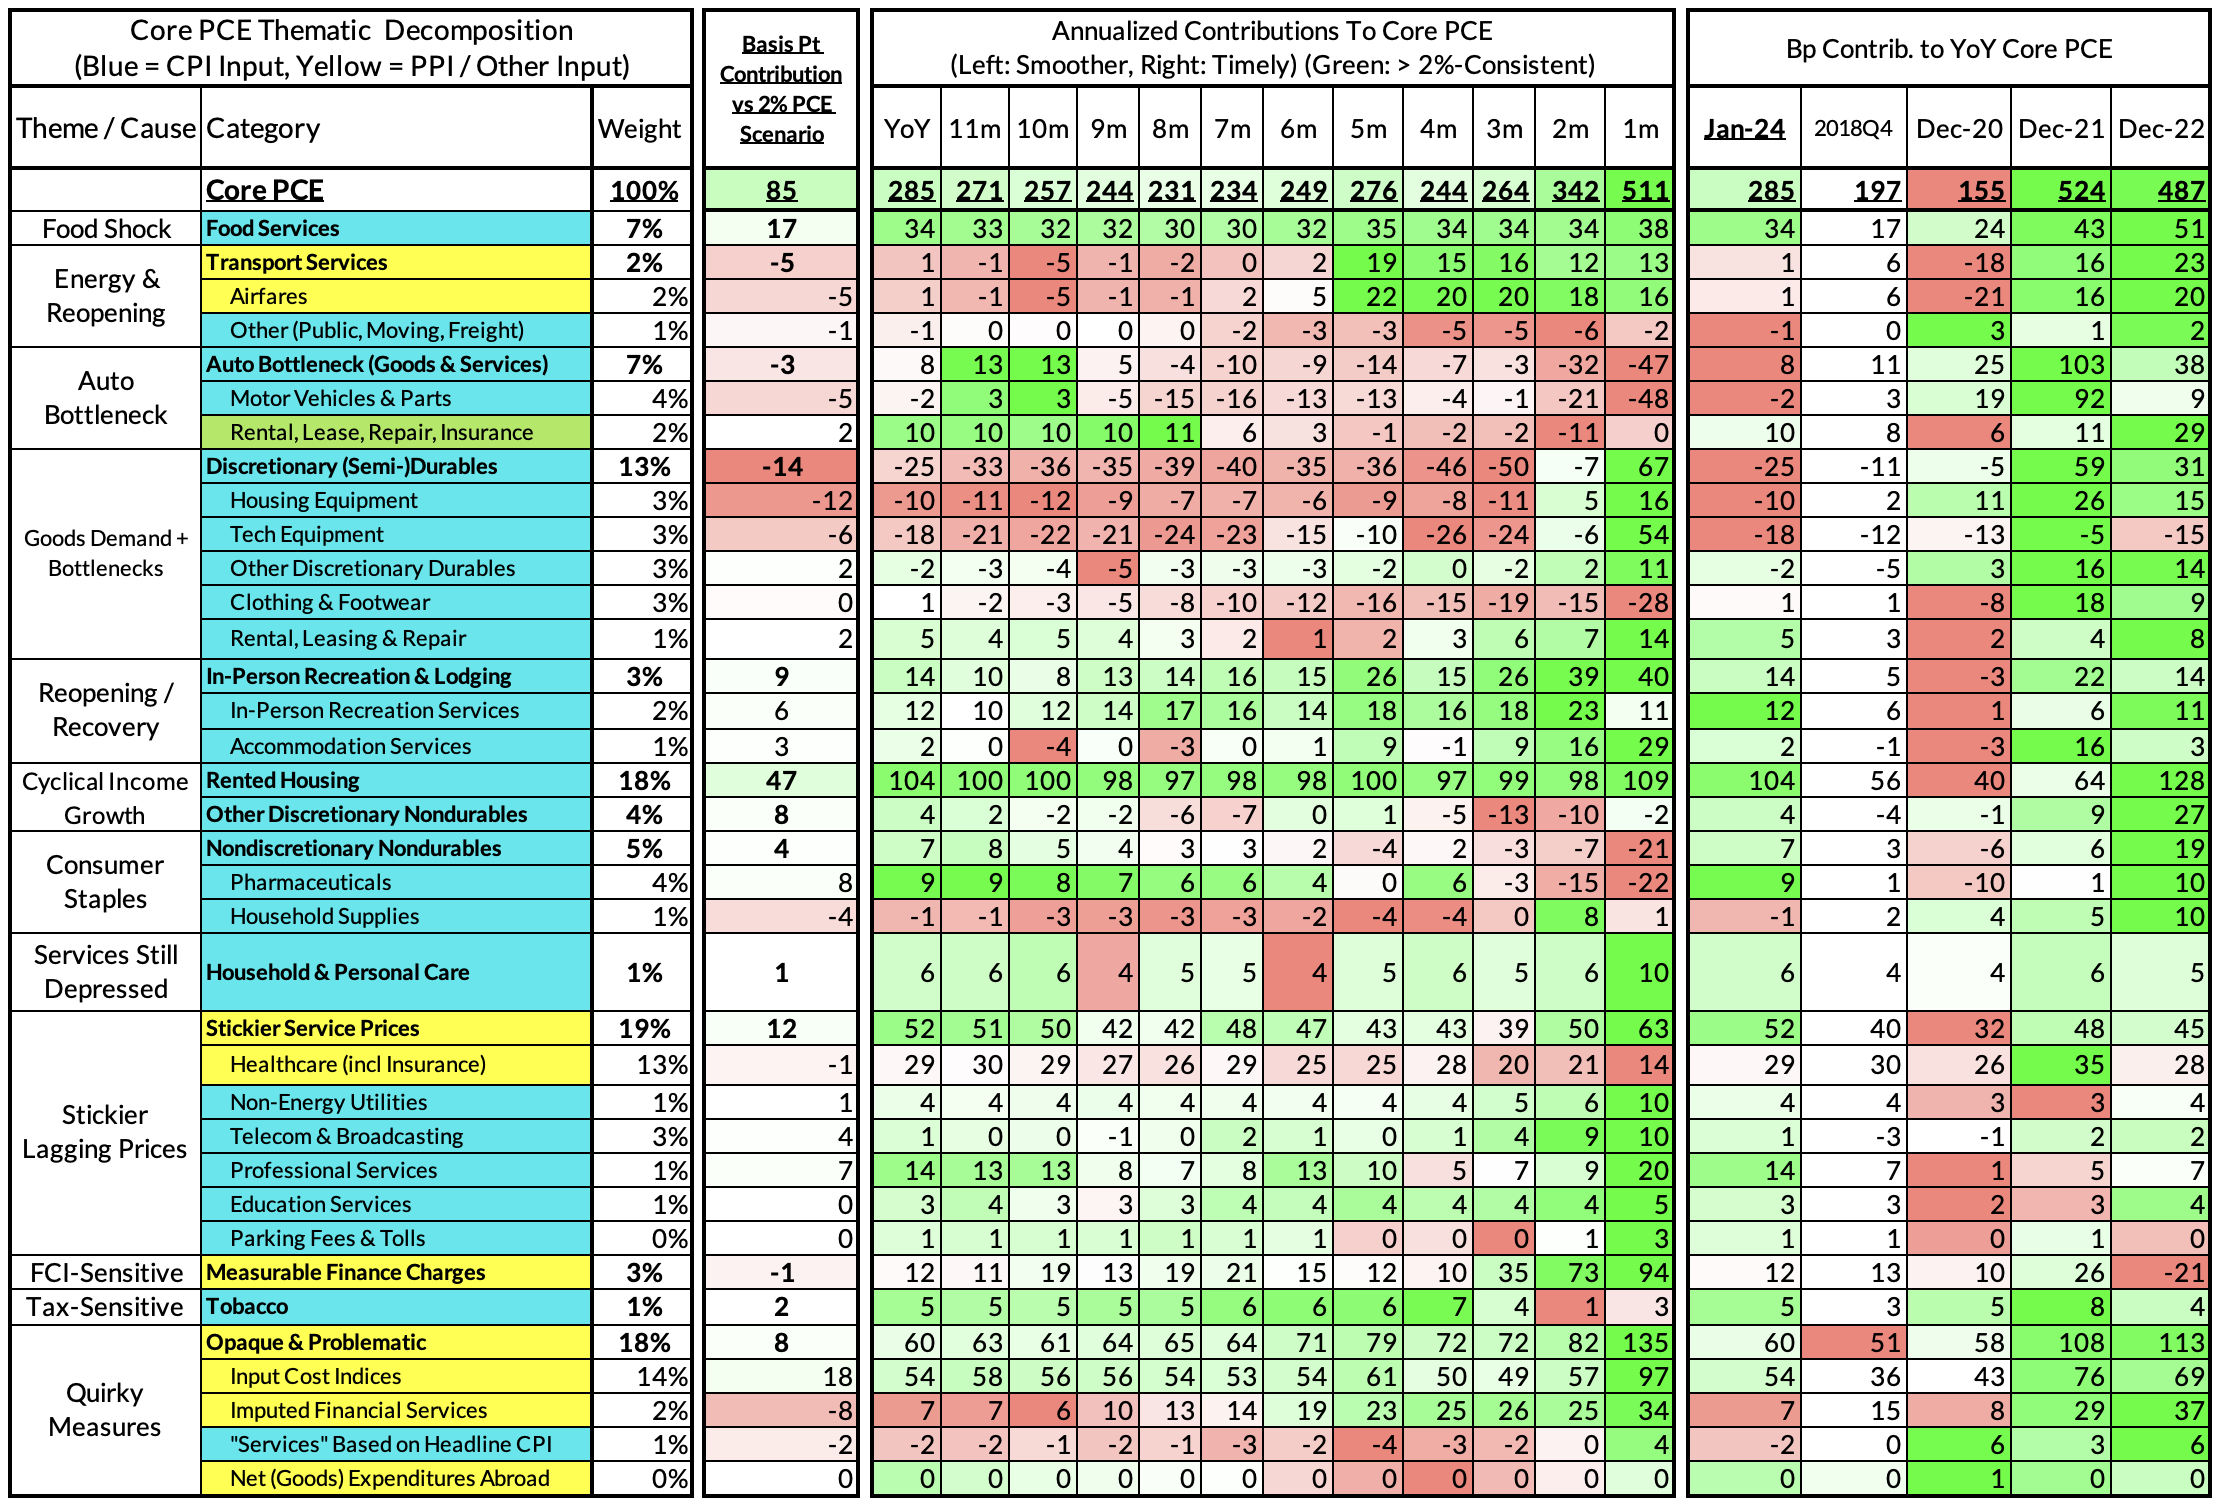
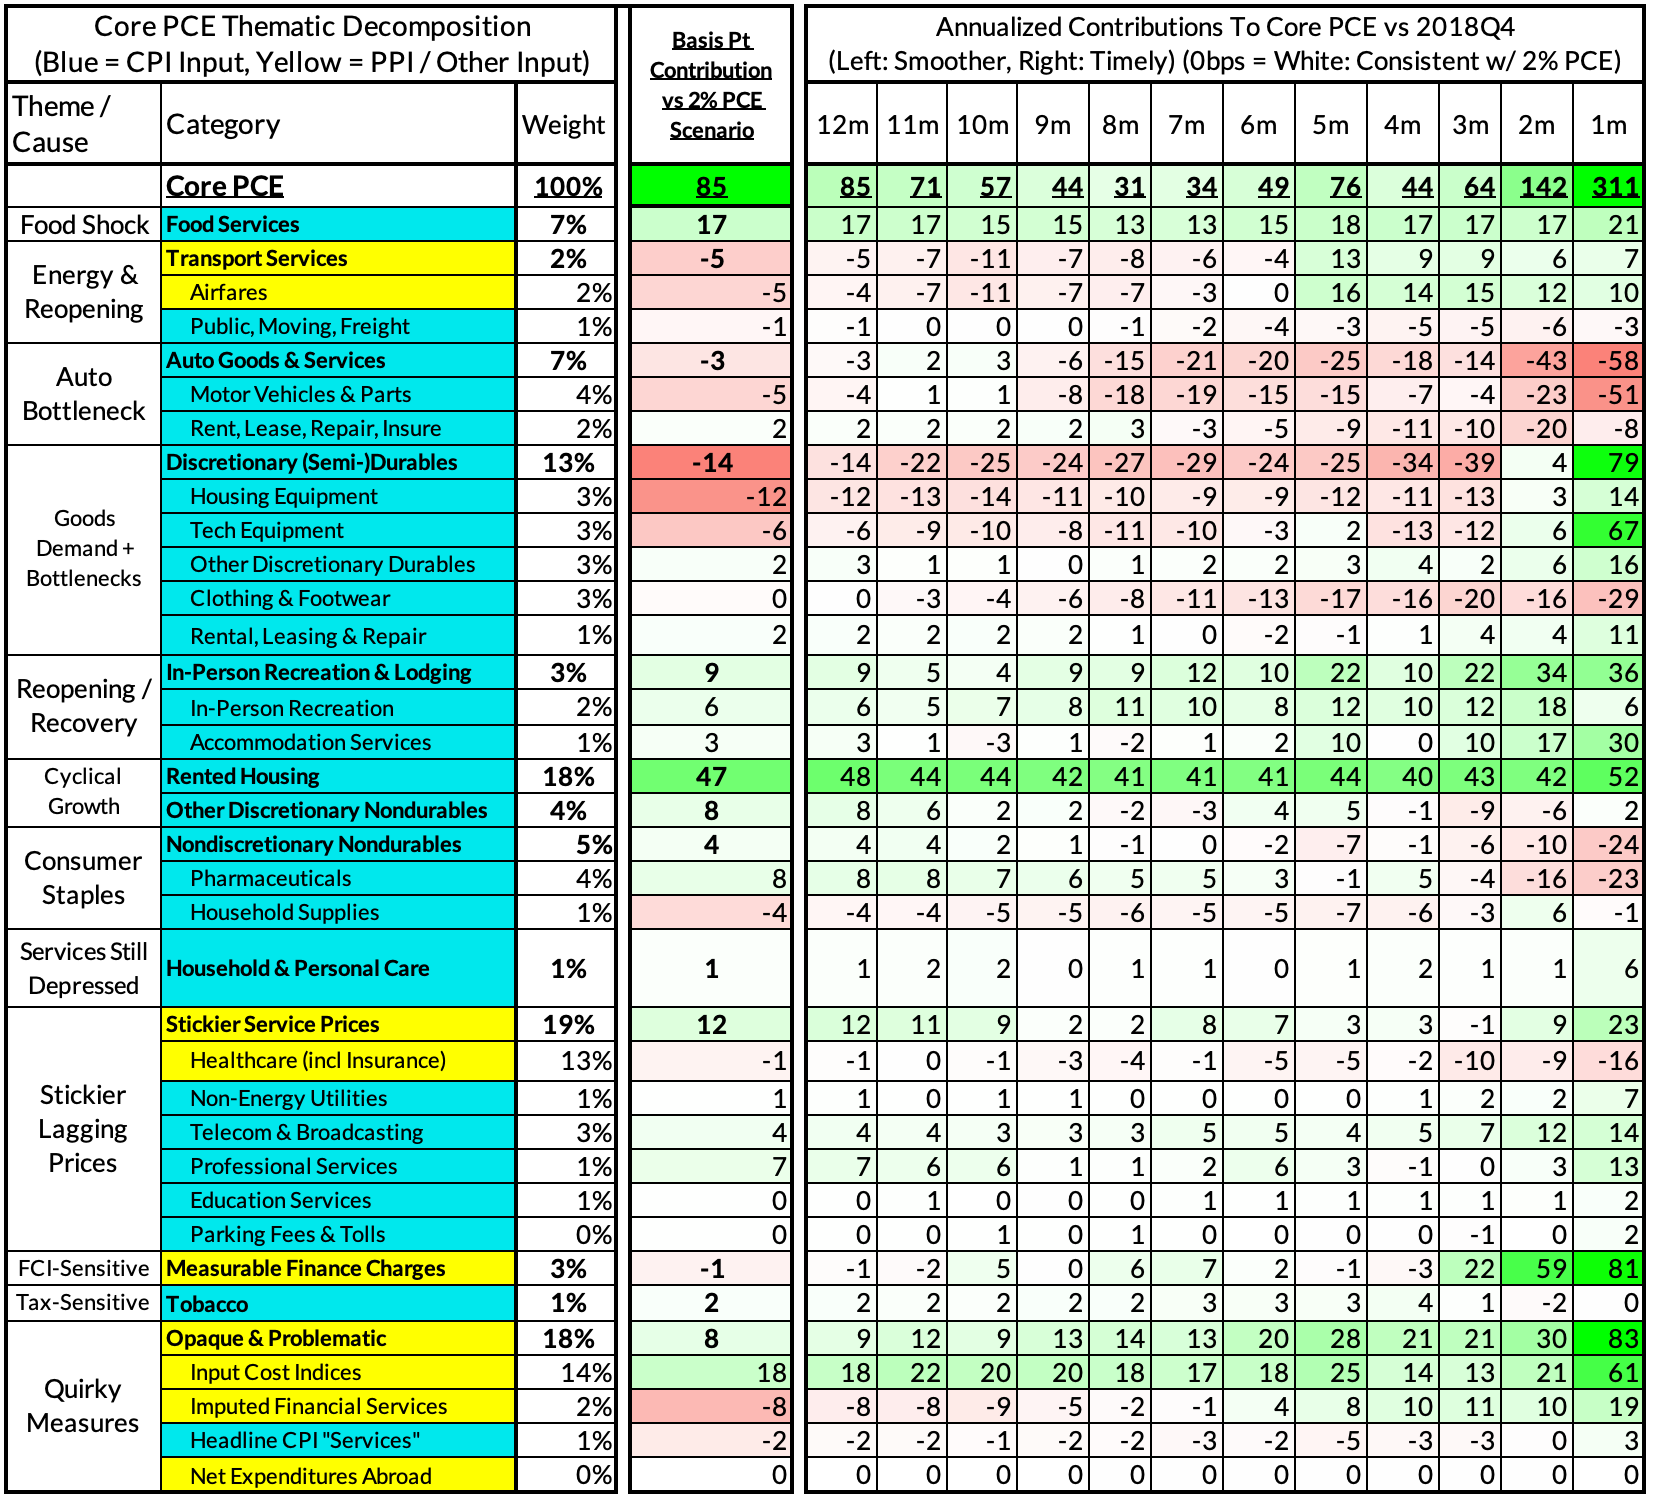
The subsequent heatmap below gives you a sense of the overshoot on shorter annualized run-rates. January monthly annualized core PCE yielded a 311 basis point overshoot vs 2% target inflation (5.11% annualized).
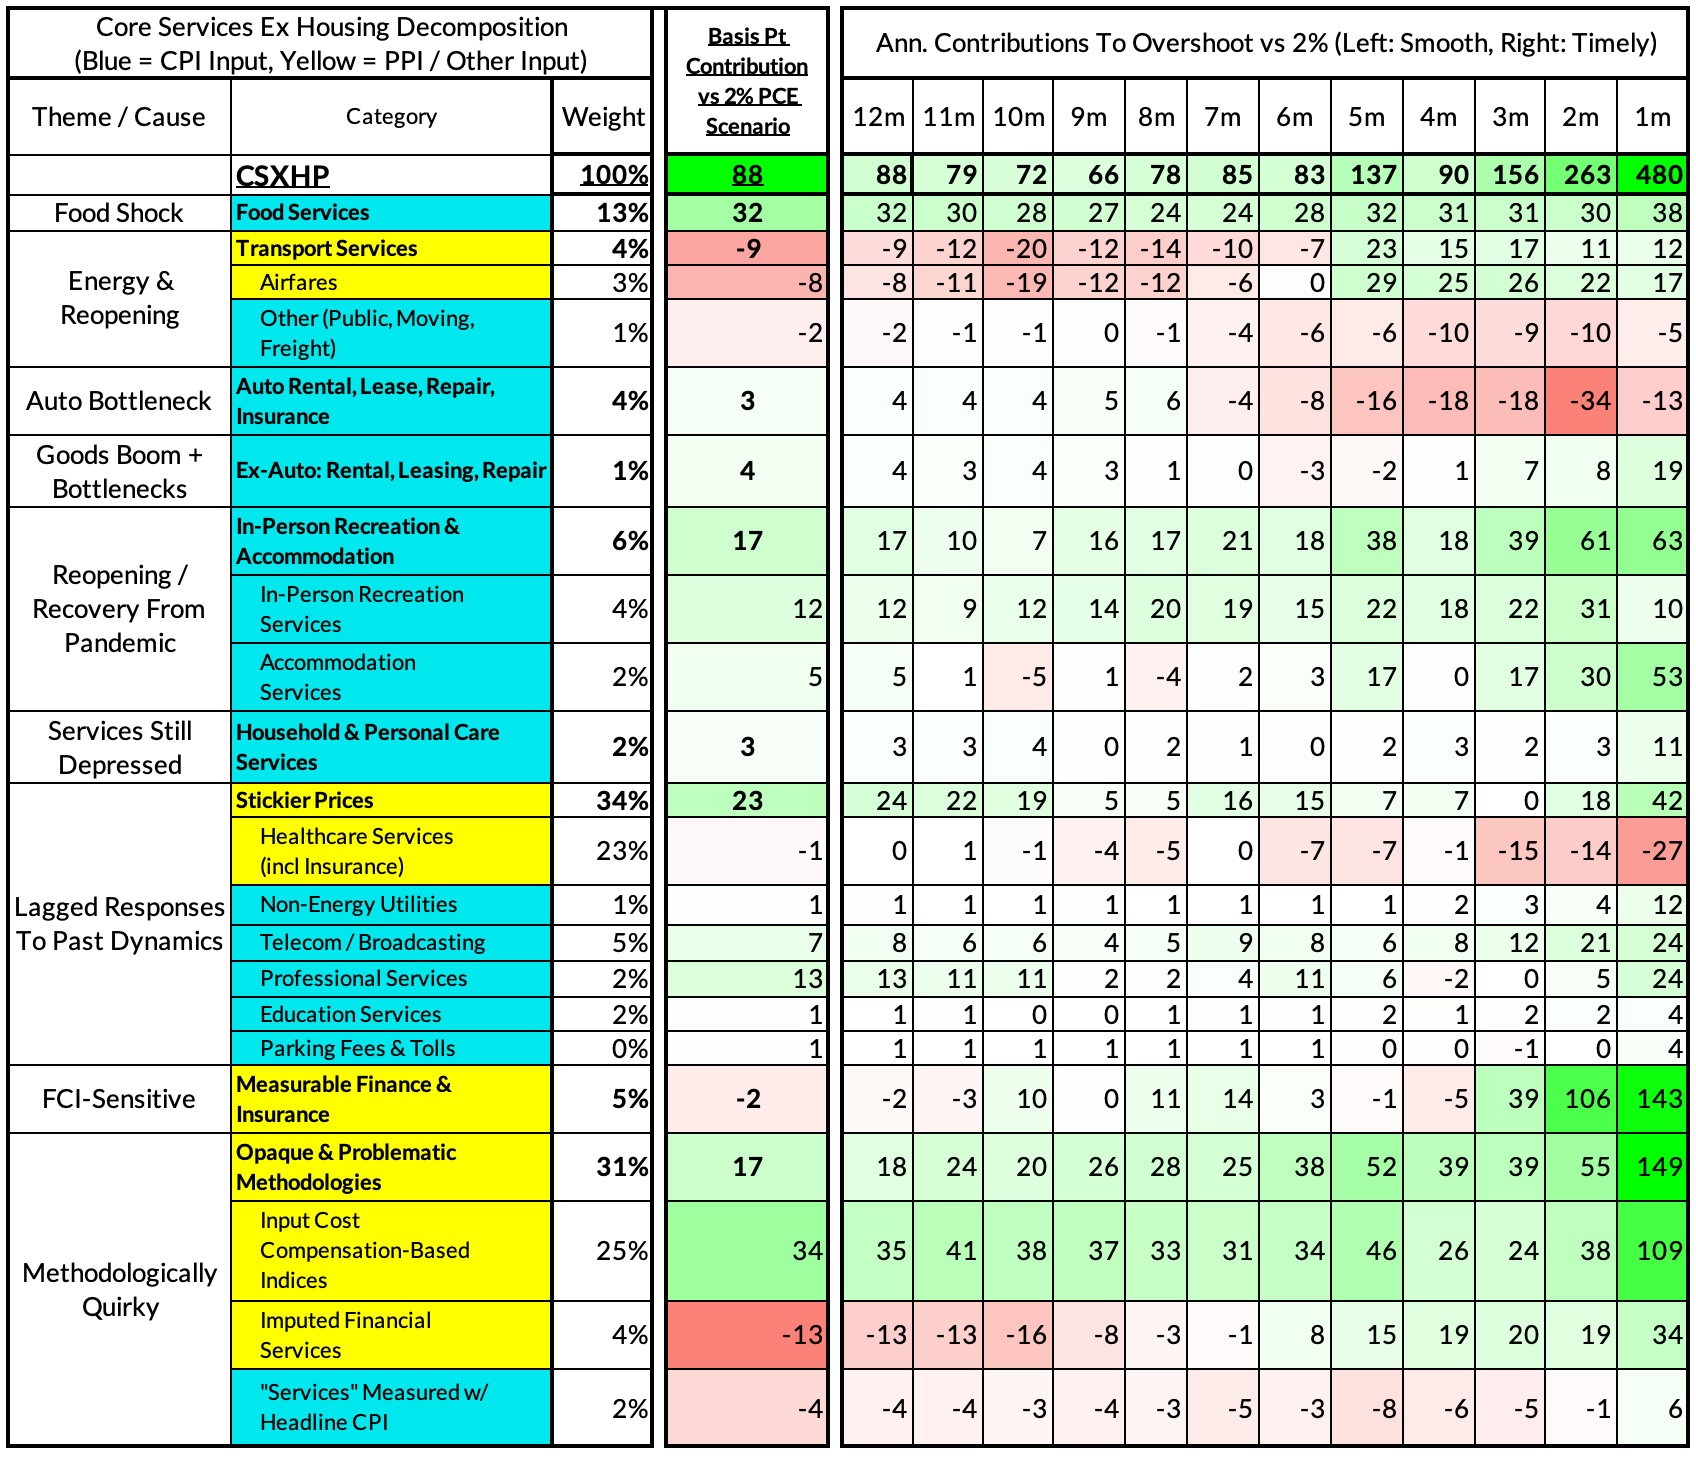
The January growth rate in "Core Services Ex Housing" ('supercore') PCE ran at 3.47% year-over-year, an 88 basis point overshoot versus the ~2.59% run rate that coincided with ~2% headline and core PCE.
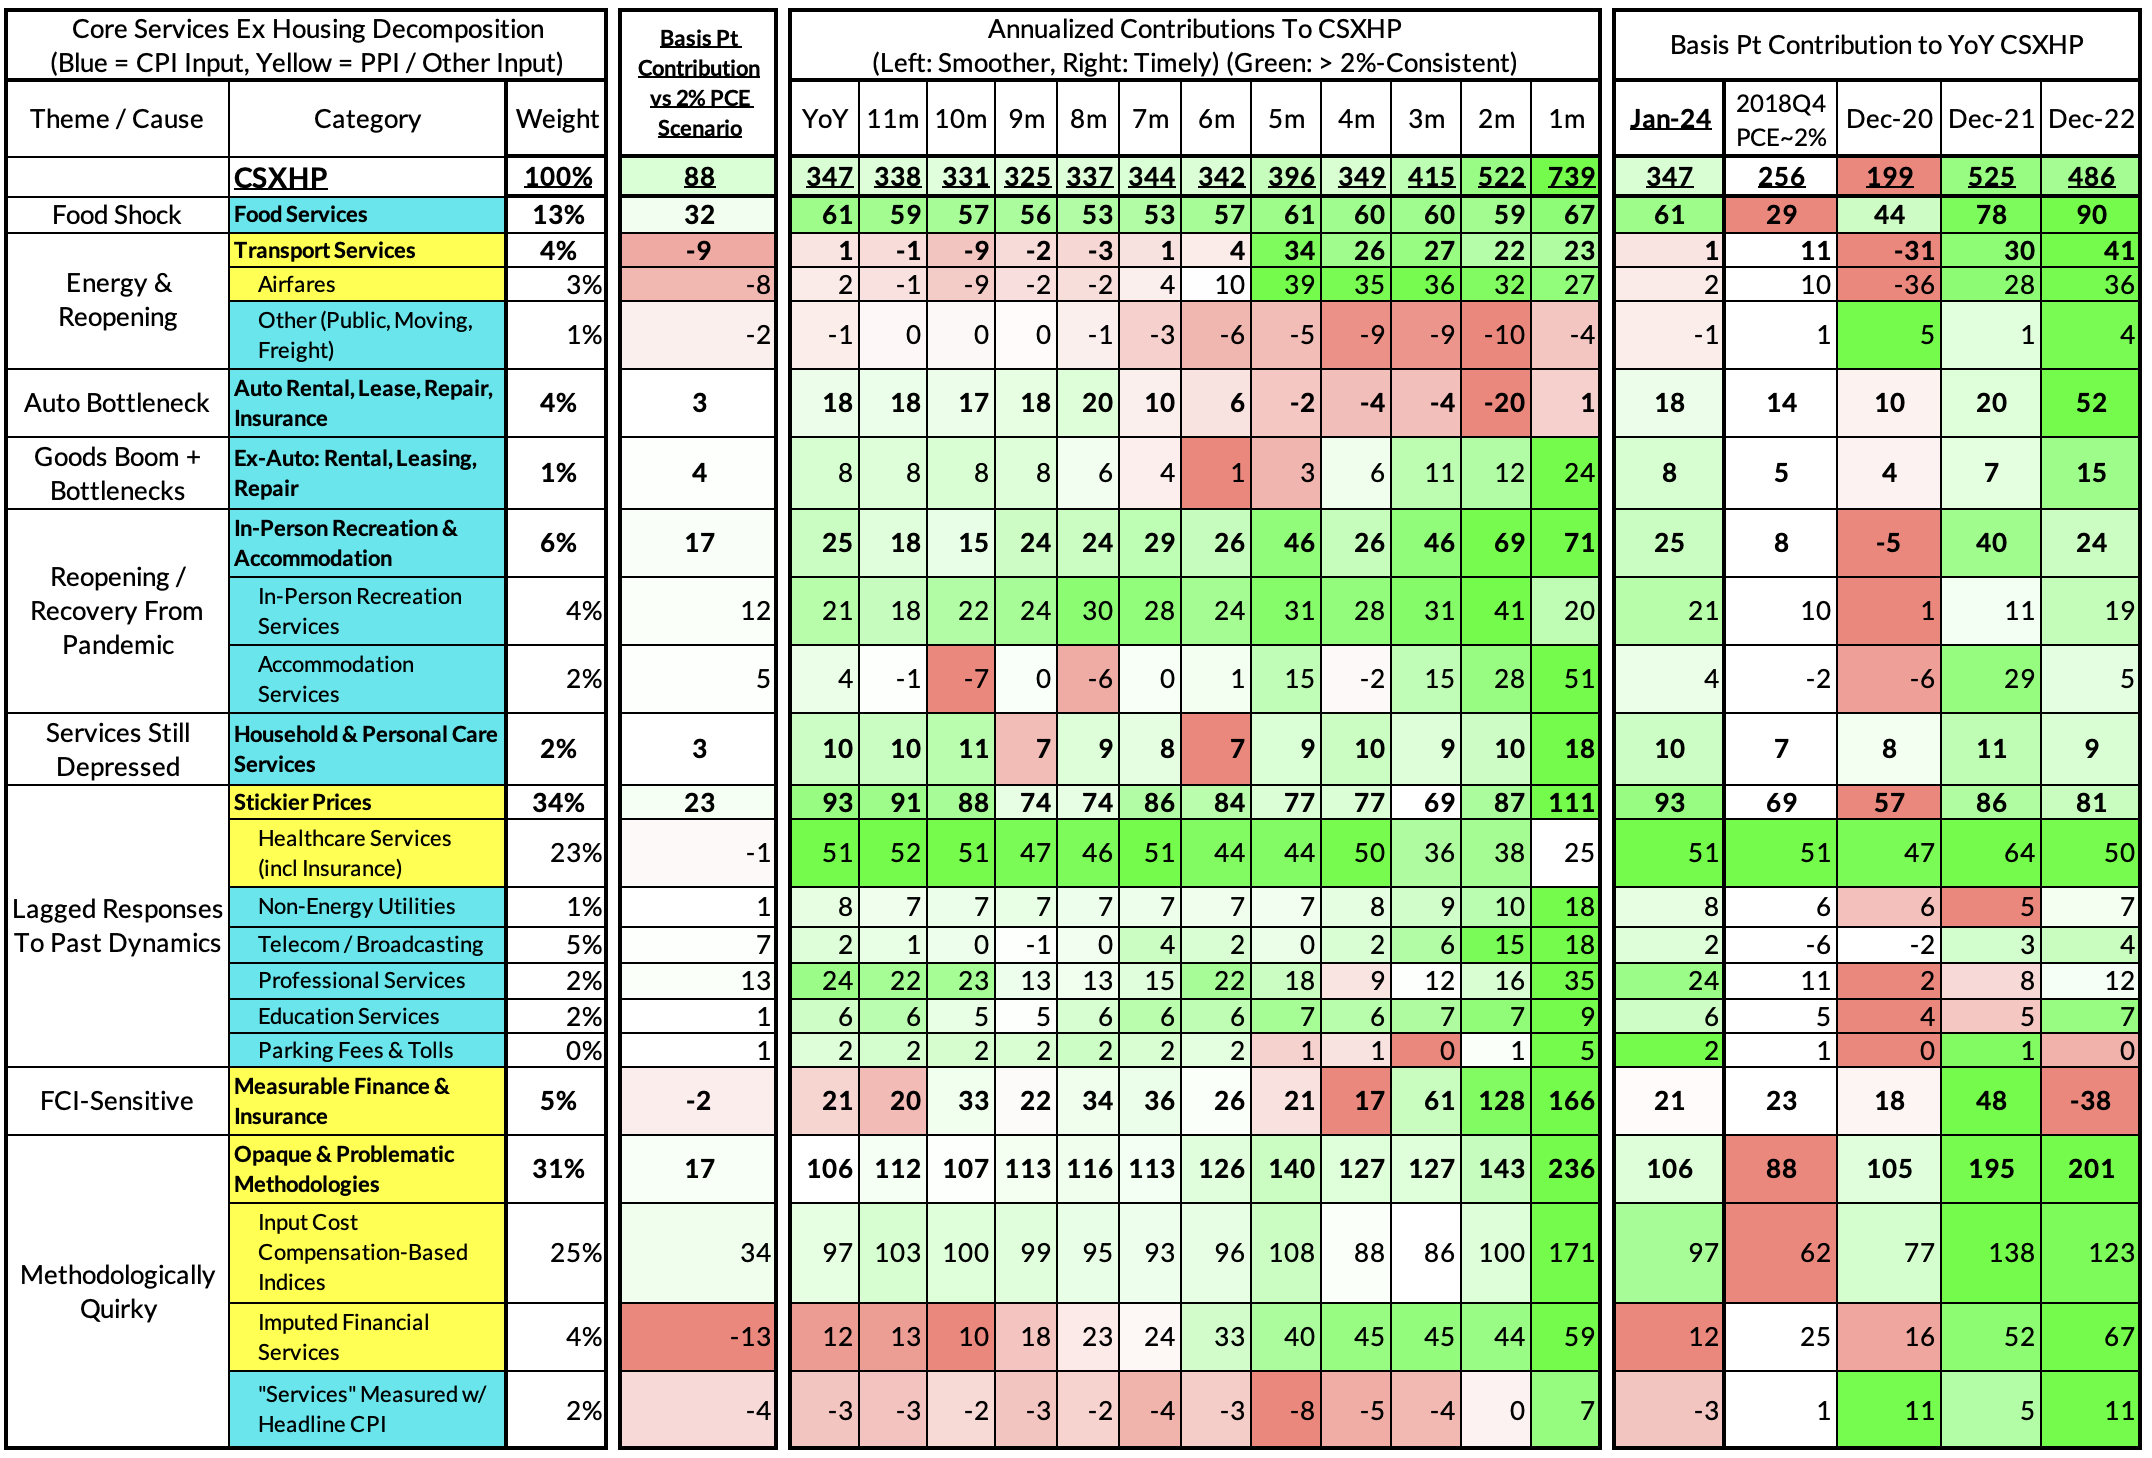
January monthly supercore ran at a 7.39% annualized rate, a 480 basis point overshoot of what would be consistent with 2% headline and core PCE. On a shorter run basis, this aggregation is highly sensitive to financial market dynamics.