February Core-Cast Post-PCE: The Dark Spaces Show Some Dovish Potential

Core-Cast is our nowcasting model to track the Fed's preferred inflation gauges before and through their release date. The heatmaps below give a comprehensive view of how inflation components and themes are performing relative to what transpires when inflation is running at 2%. If you are interested in more timely access to this content following the release of data, feel free to reach out to us here to gain access to our Premium Donor distribution.
Most of the Personal Consumption Expenditures (PCE) inflation gauges are sourced from Consumer Price Index (CPI) data, but Producer Price Index (PPI) input data is of increasing relevance, import price index (IPI) data can prove occasionally relevant. But as we will focus on in this post, there are some high-leverage components that only come out on the day of the PCE release.
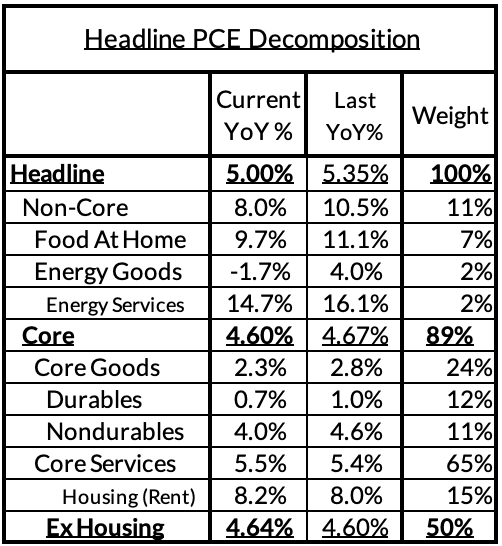
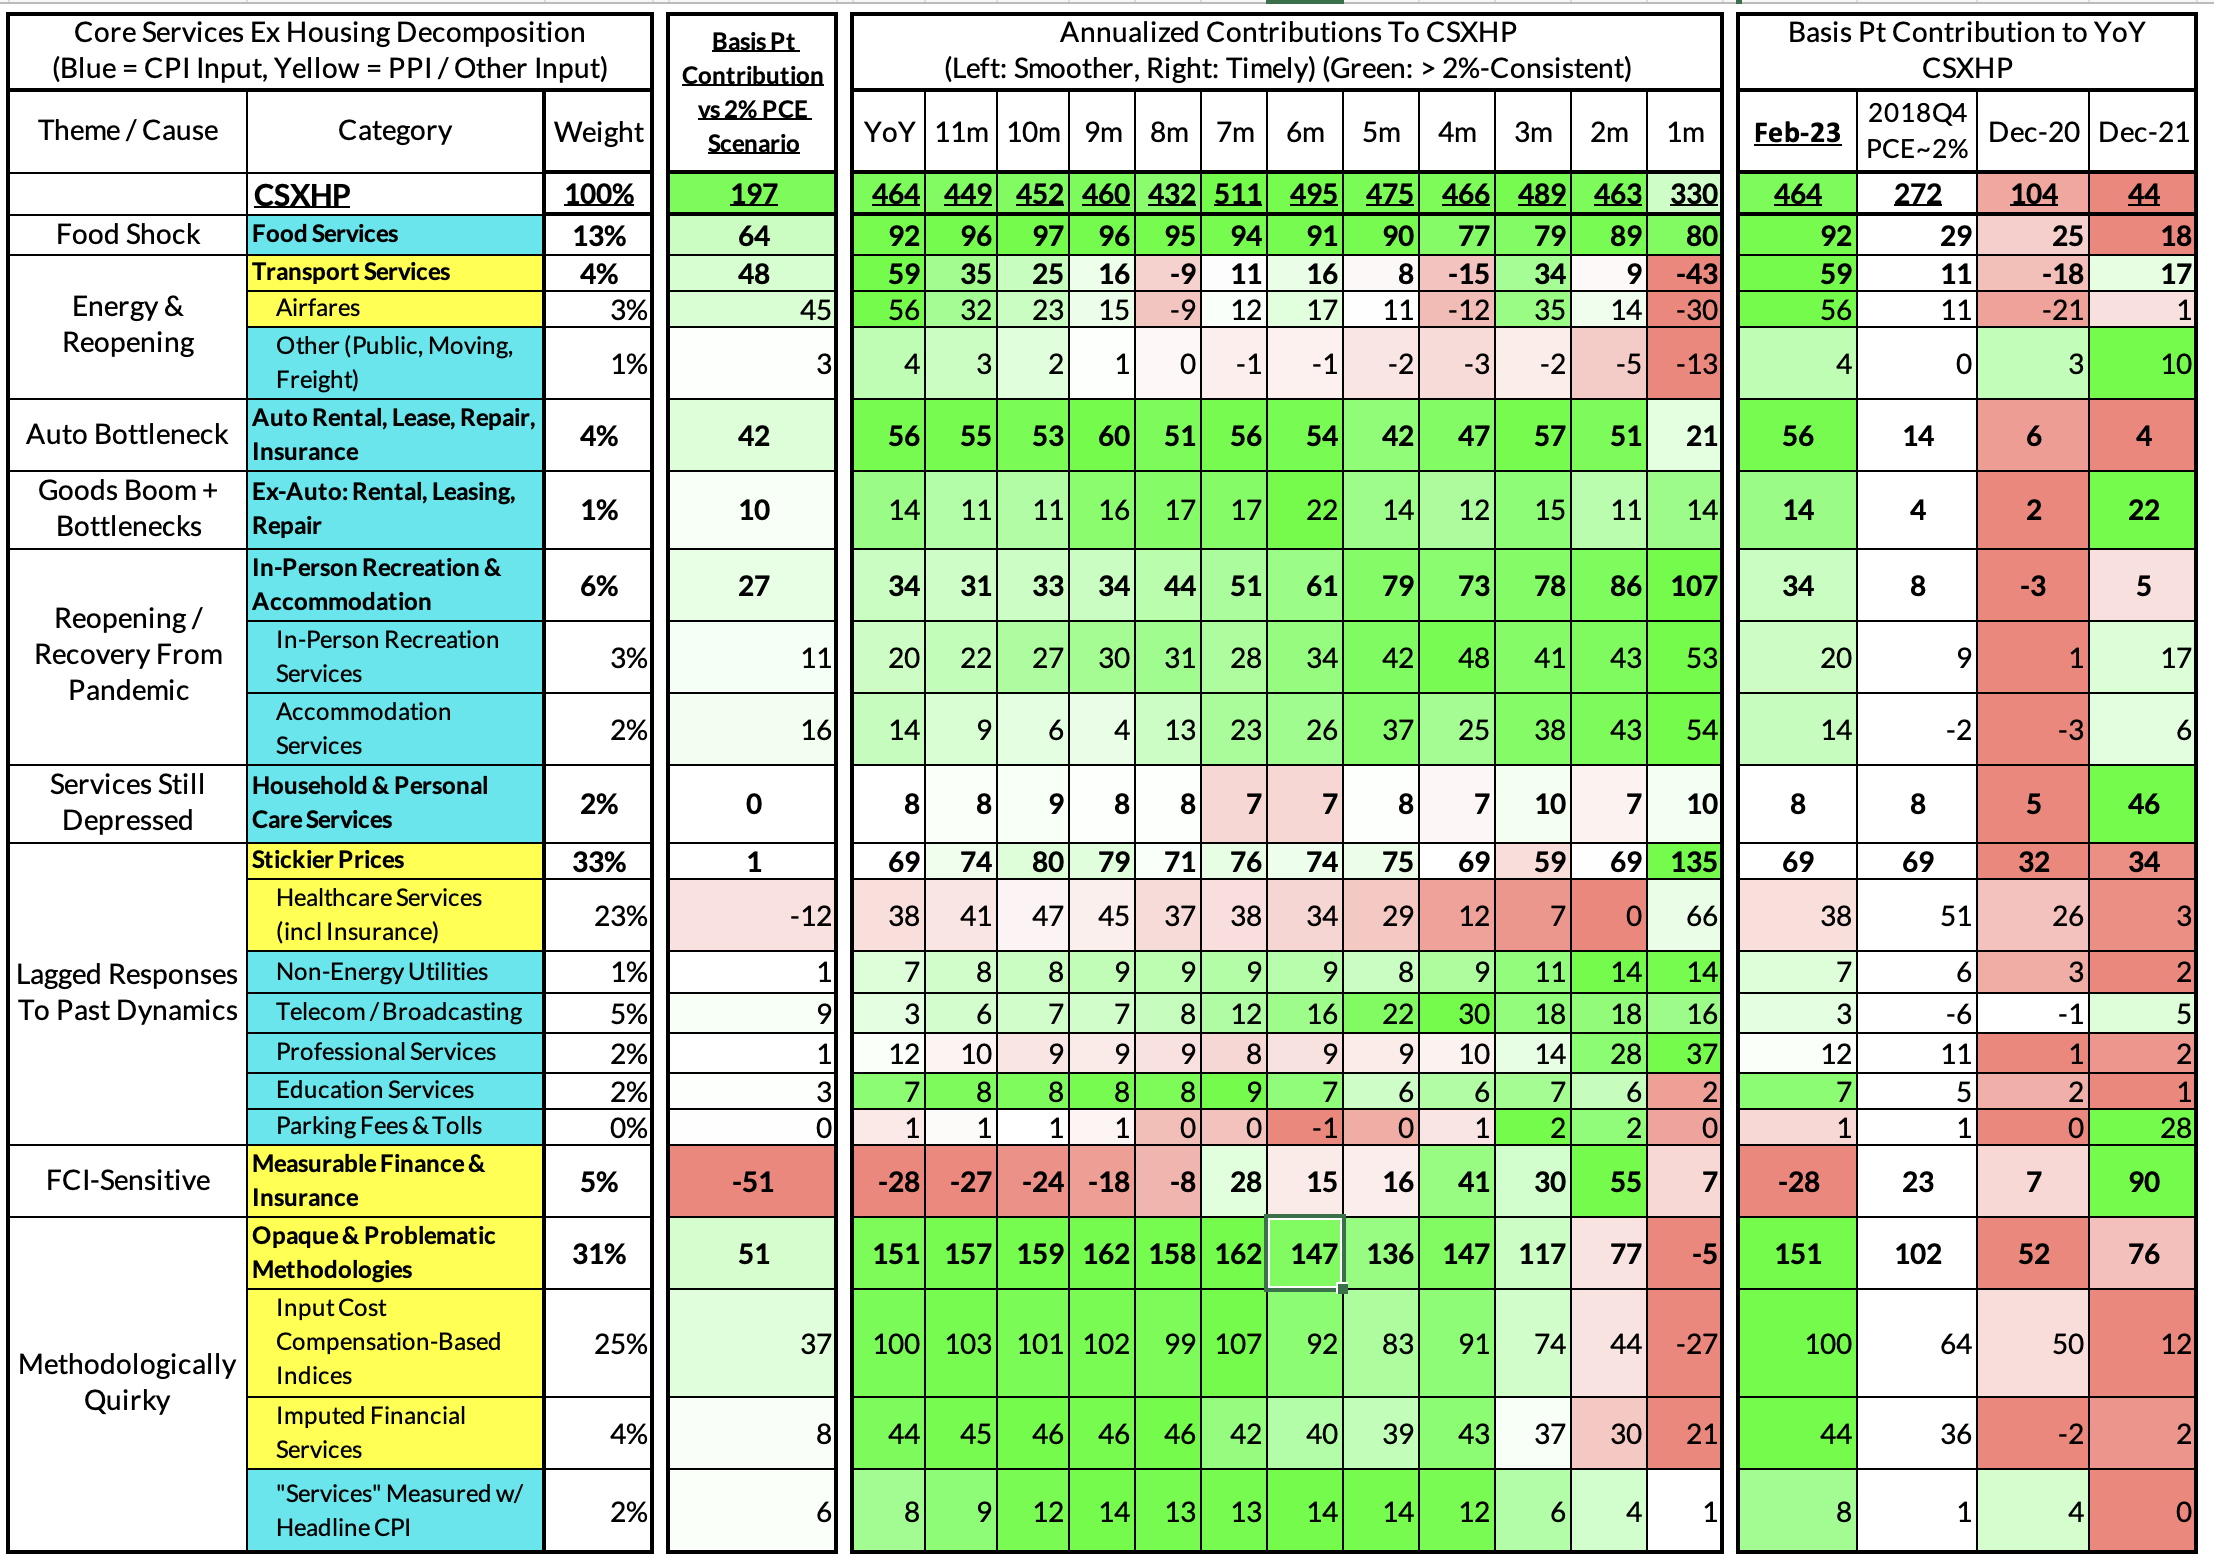
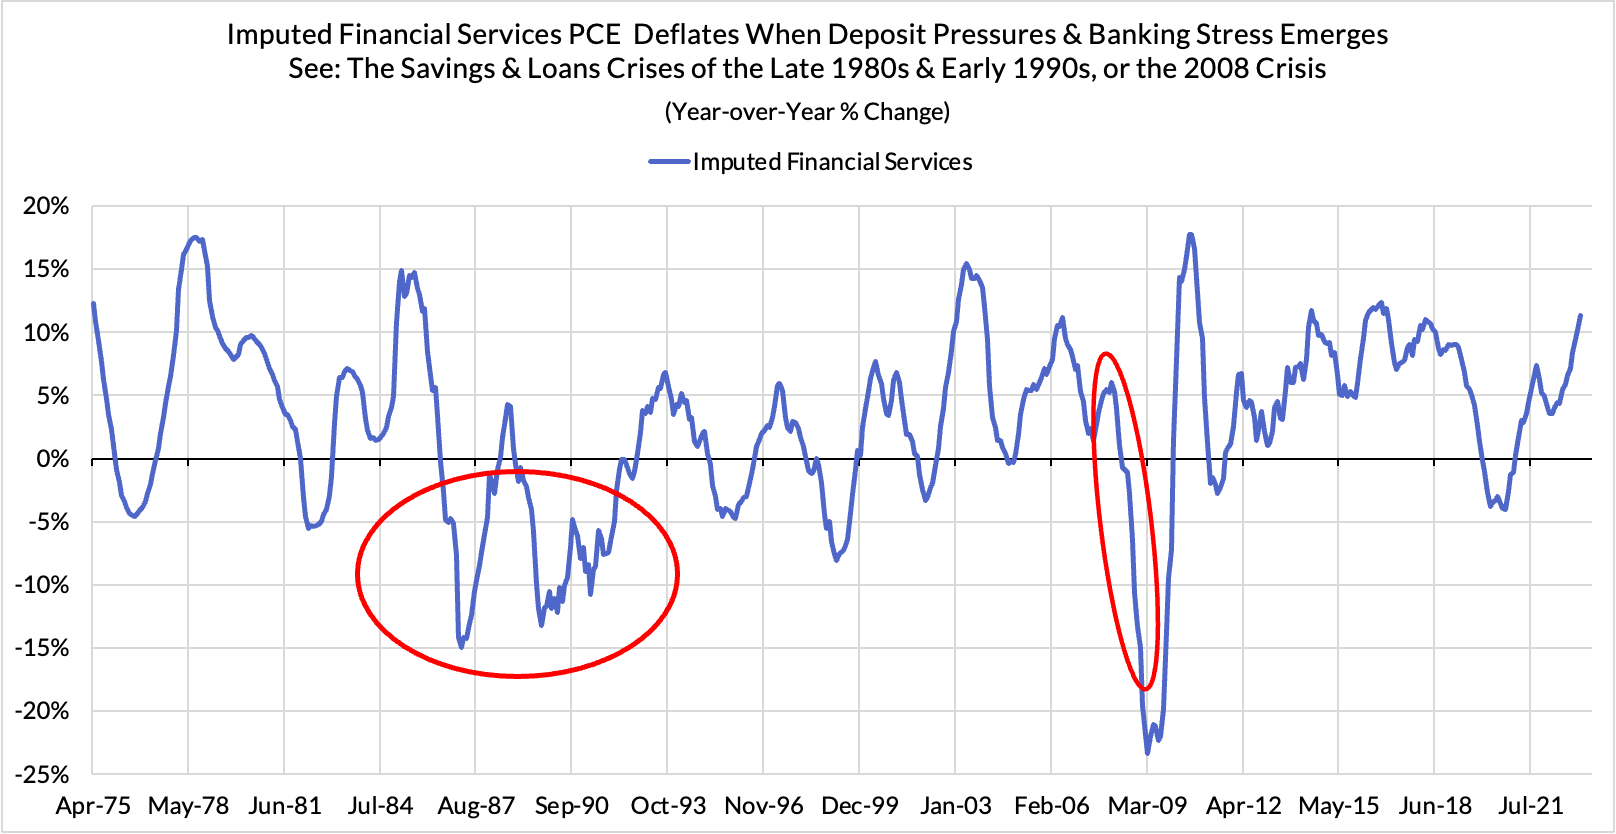
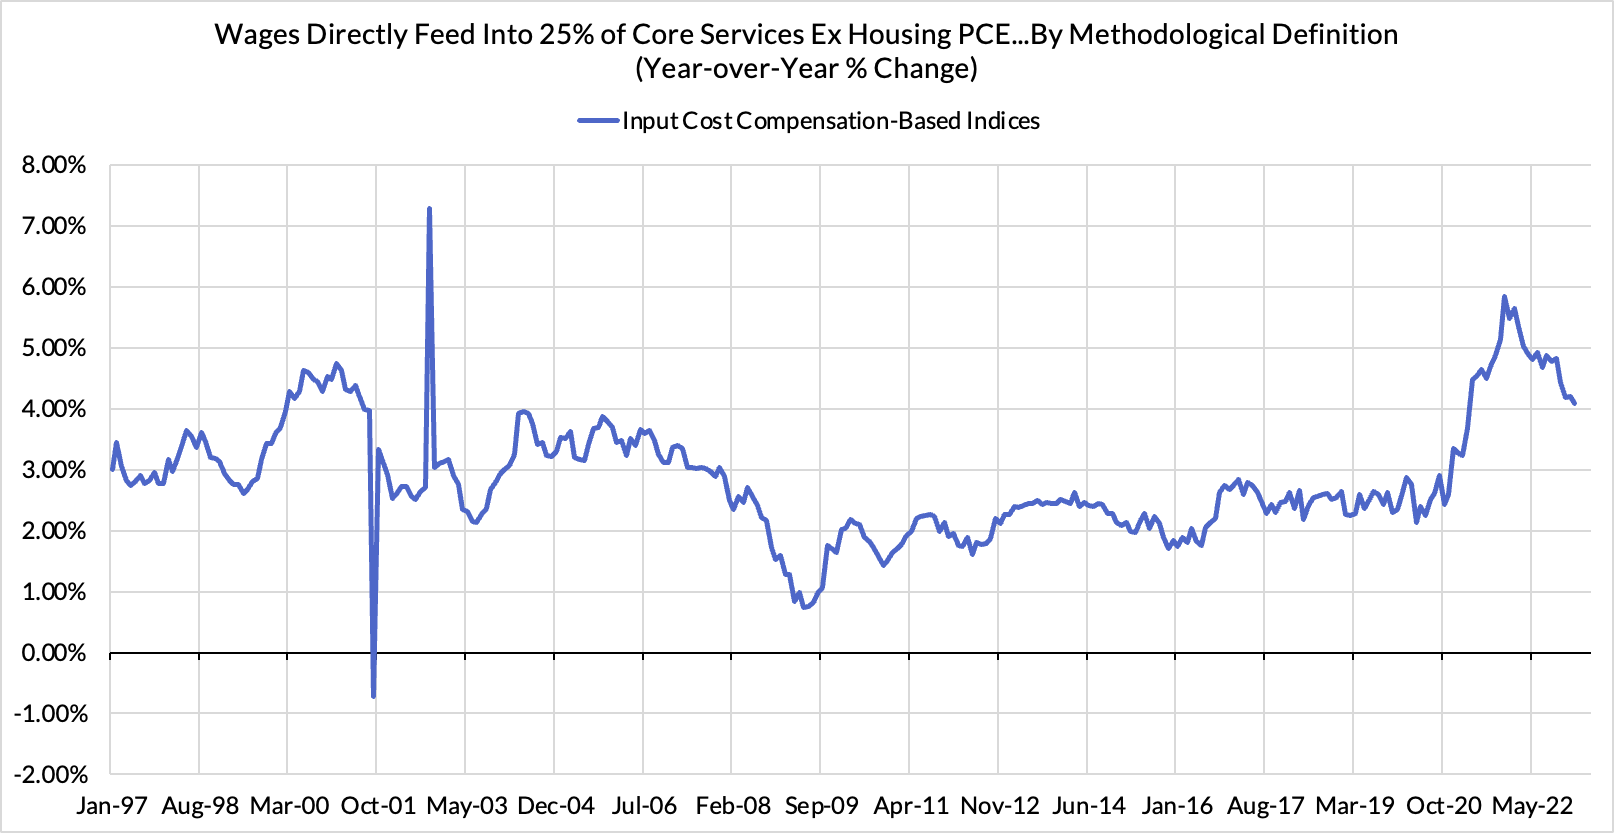
Consistent with our nowcast, February monthly Core PCE undershot the 0.4% consensus, but we were surprised to see further downside in monthly Core Services Ex Housing PCE, which came in 0.27% vs our 0.40% nowcast. There are potential signs of encouragement for the Fed in this report, relative to what CPI and PPI revealed. We are seeing tentative signs that higher deposit rates and slower wage growth are feeding into slower growth for imputed financial services and input cost index inputs to PCE (which are based on idiosyncratic labor compensation data). These components are the "dark spaces" of PCE where we do not get any kind of direct read beforehand (and where the methodology is most opaque).
For those interested in a deeper knowledge of the high-stakes dynamics (see the heatmaps below for how their scale to contribute to PCE):
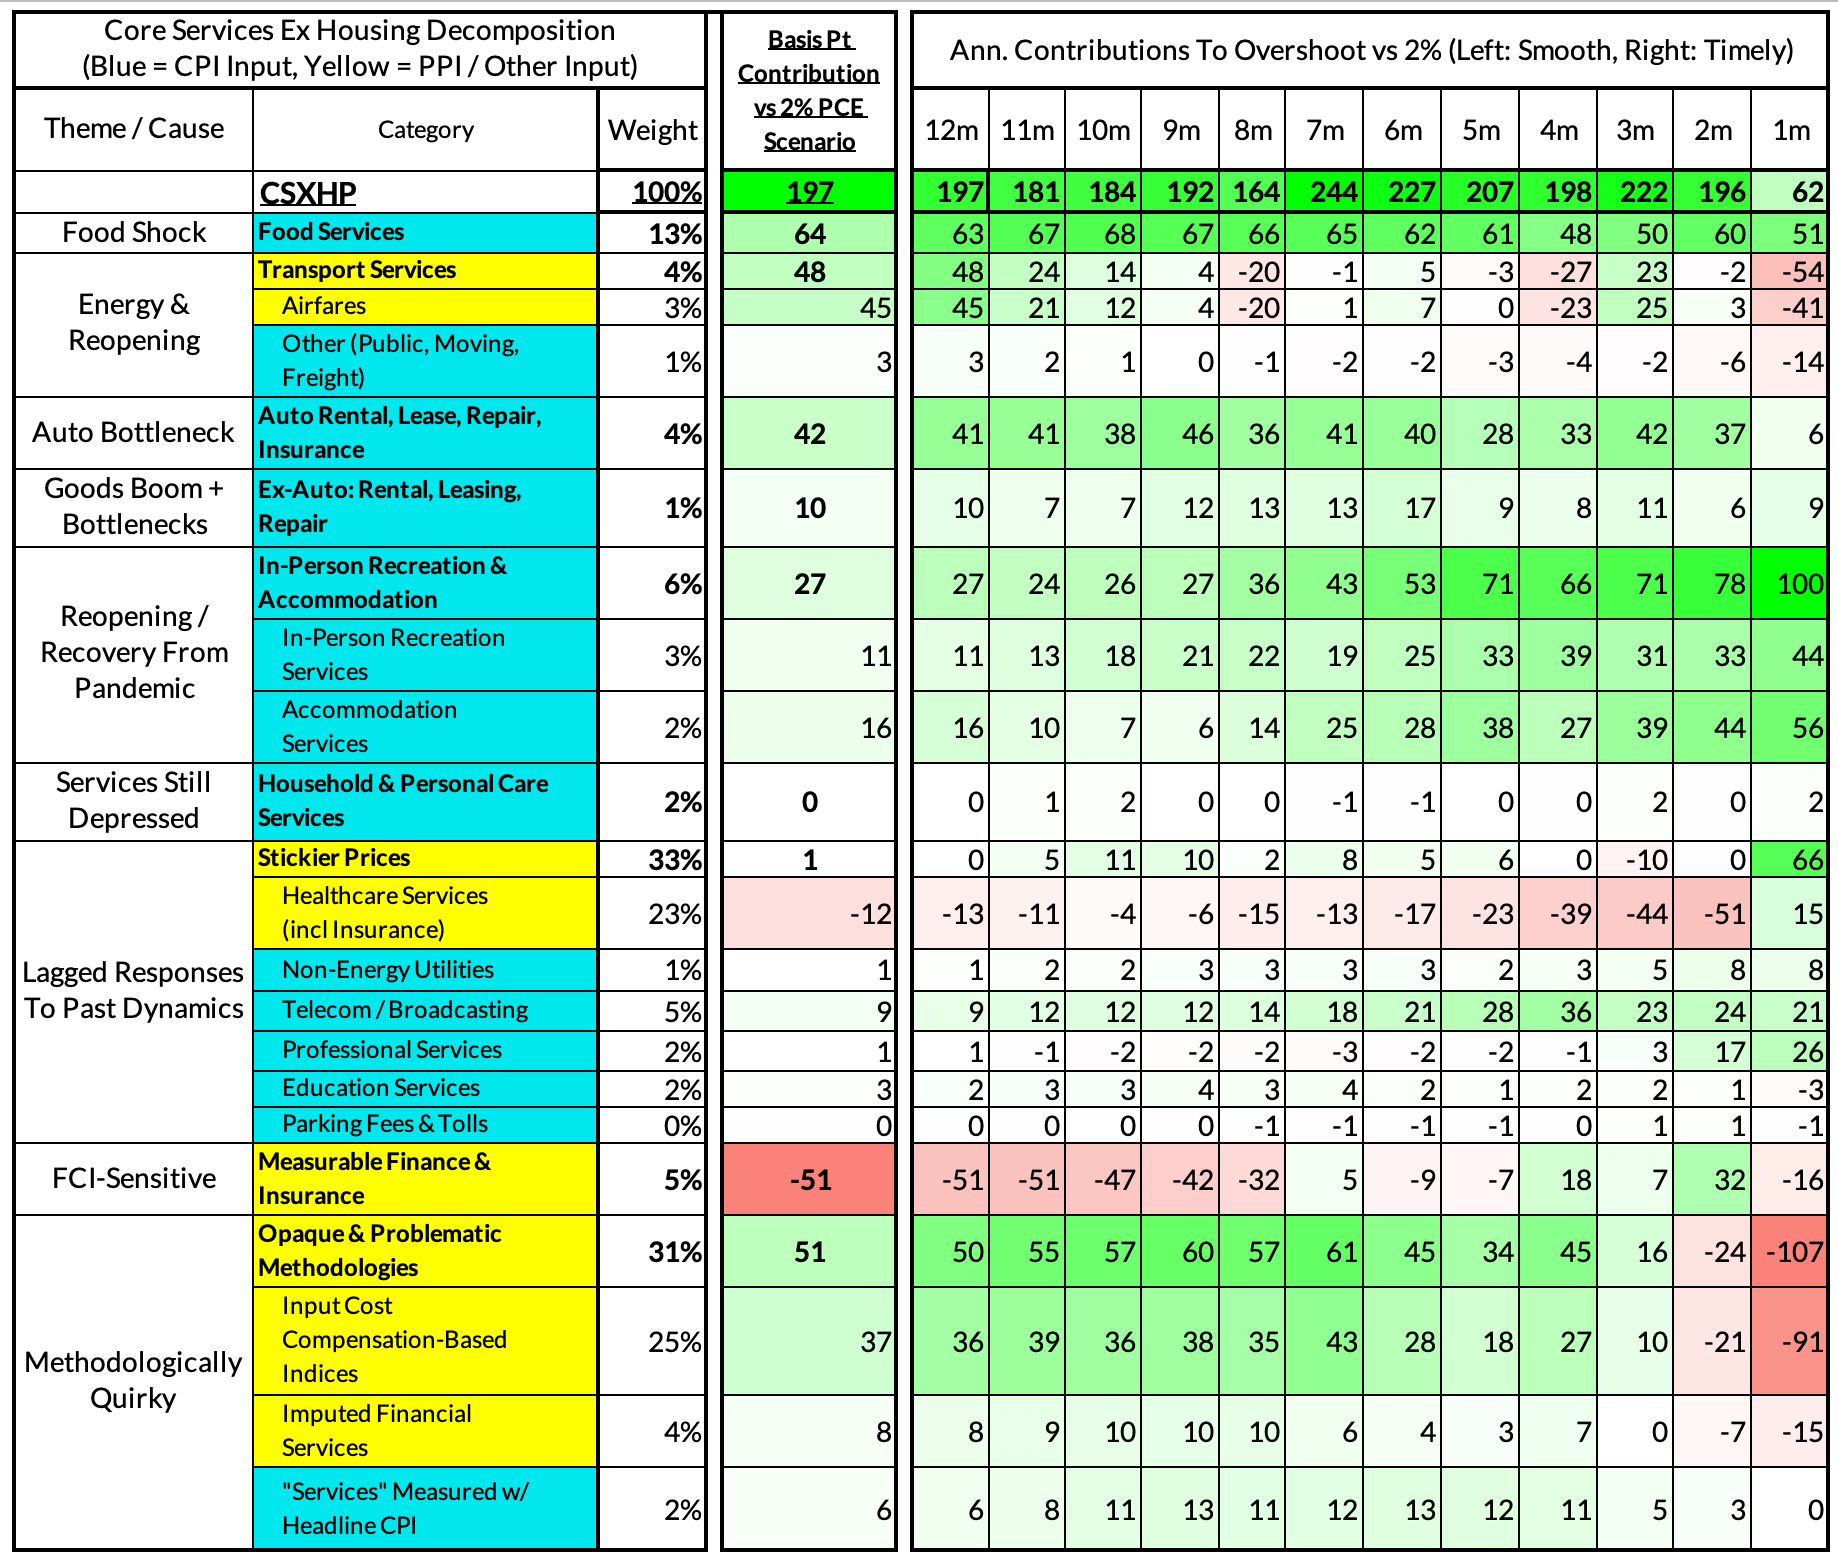
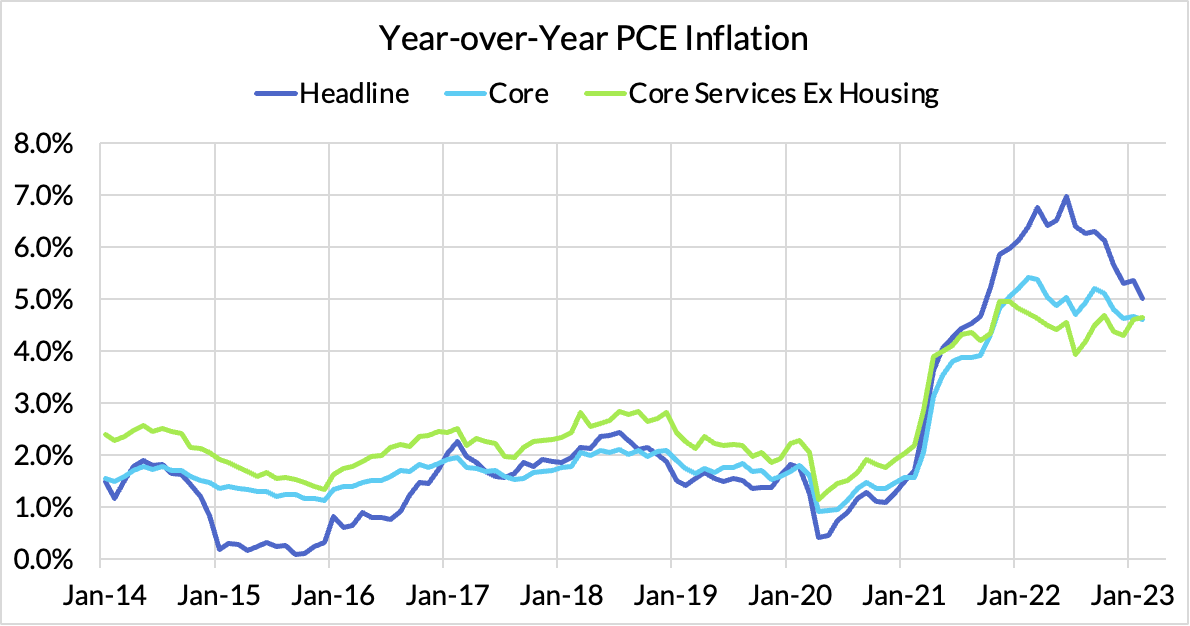
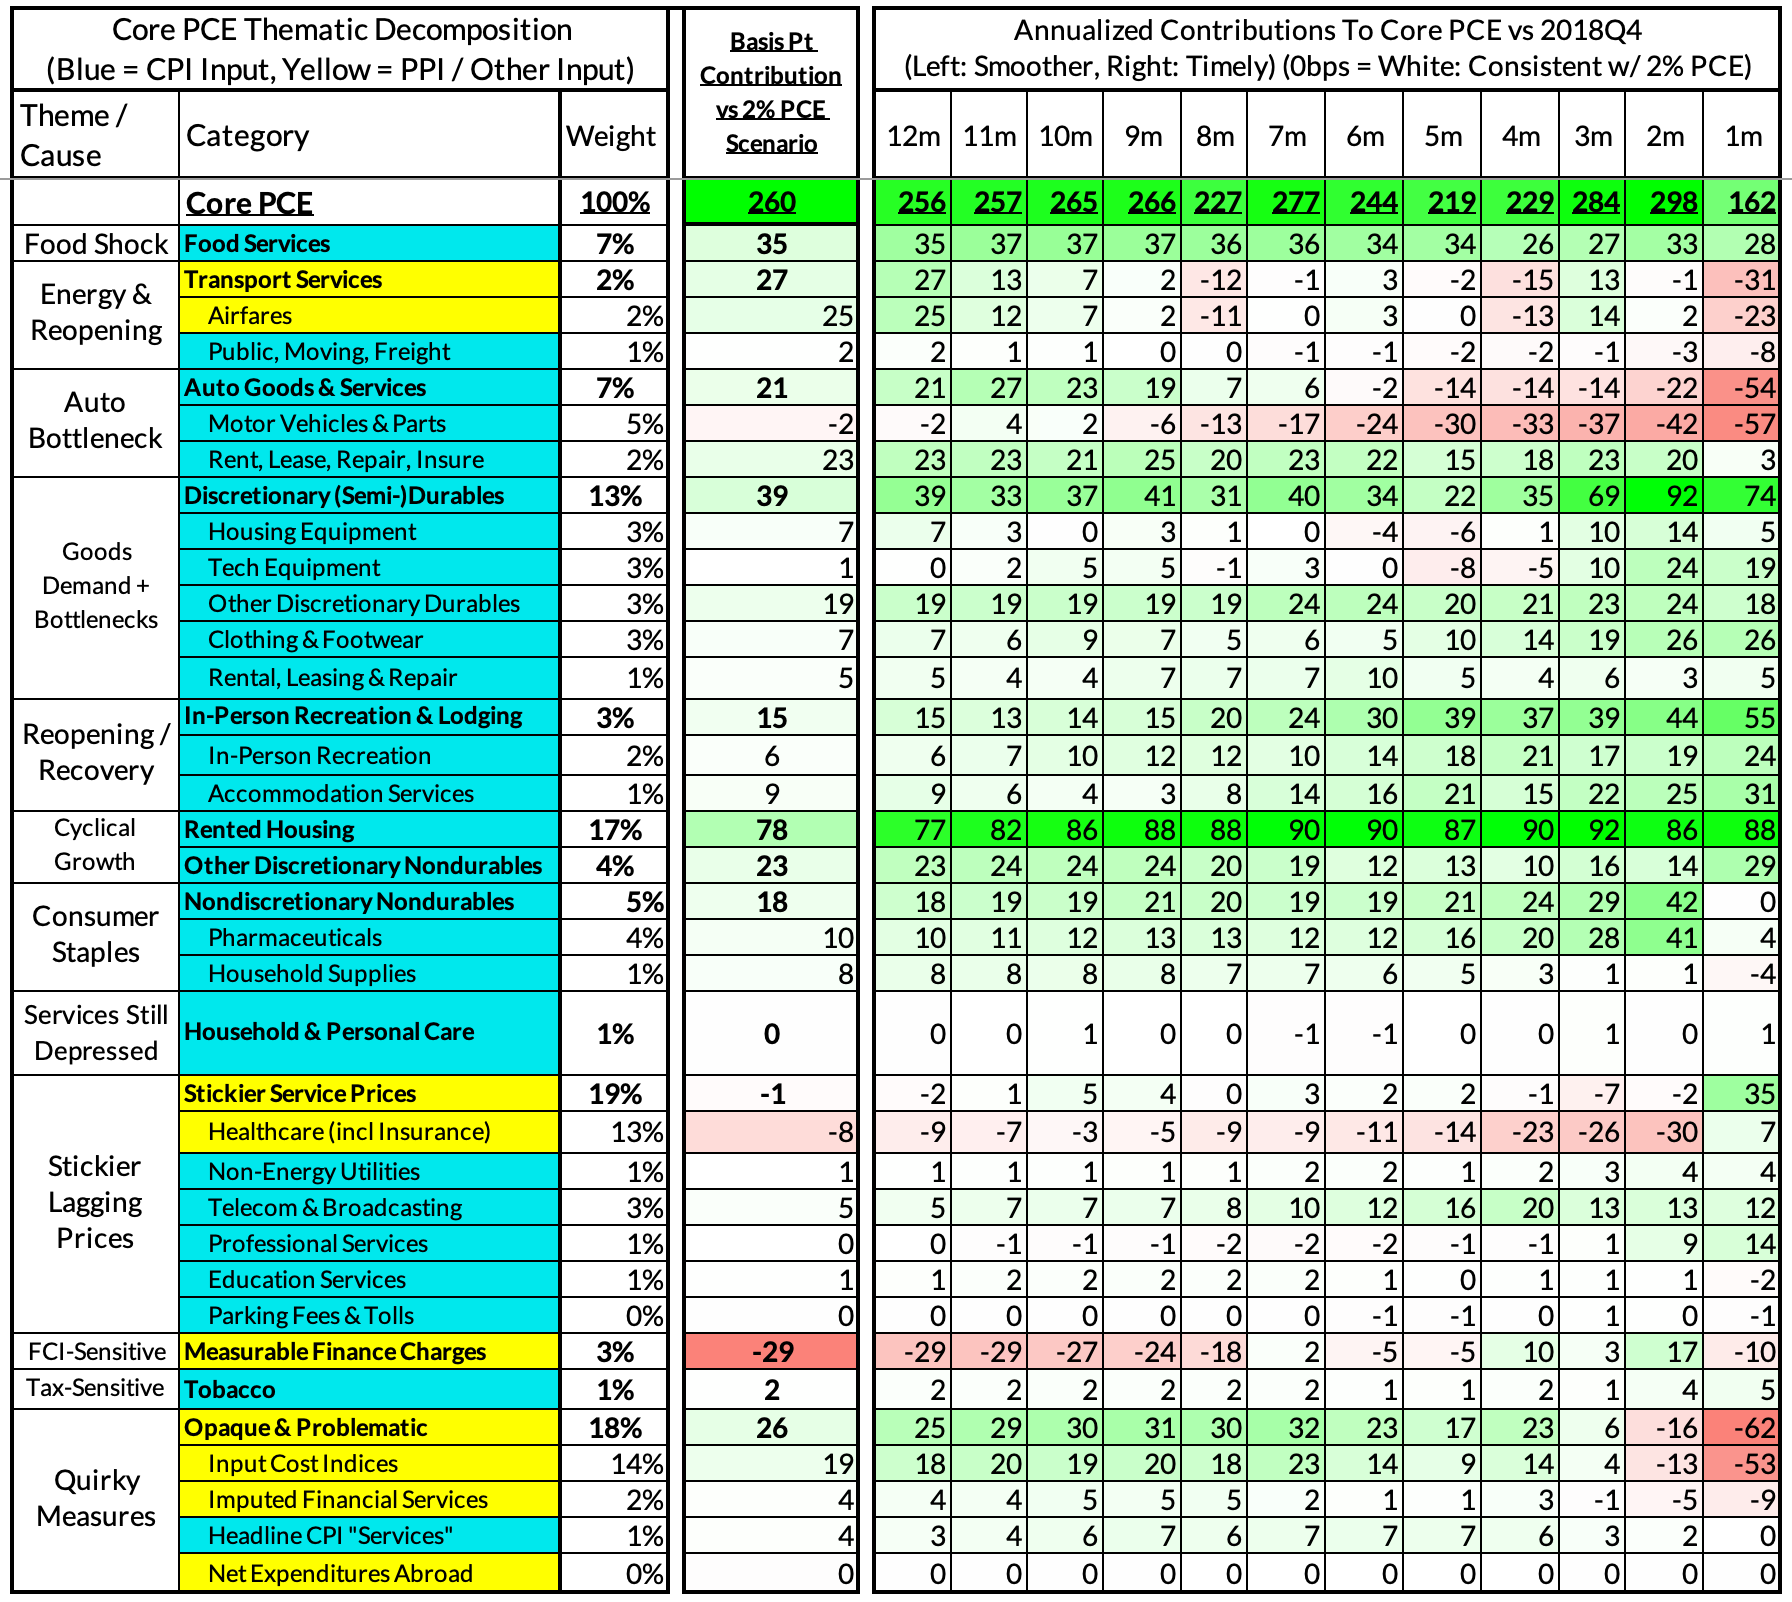
Right now Core PCE (PCE less food products and energy) is running at 4.60%, 260 basis points above the Fed's 2% inflation target for PCE. That overshoot is disproportionately driven by catch-up rent CPI inflation in response to the surge in household formation (a byproduct of rapidly recovering job growth) and market rents in 2021-22
There are other contributors to the overshoot, some more supply-driven (automobile bottlenecks likely explain 21 basis points, while food inputs likely added 35 basis points to the overshoot) and some more demand-driven (in-person recreation and travel services adding 15 basis points to the overshoot), and some reflect both (airfares are both reopening-sensitive and energy-sensitive, adding 27 basis points to the overshoot).
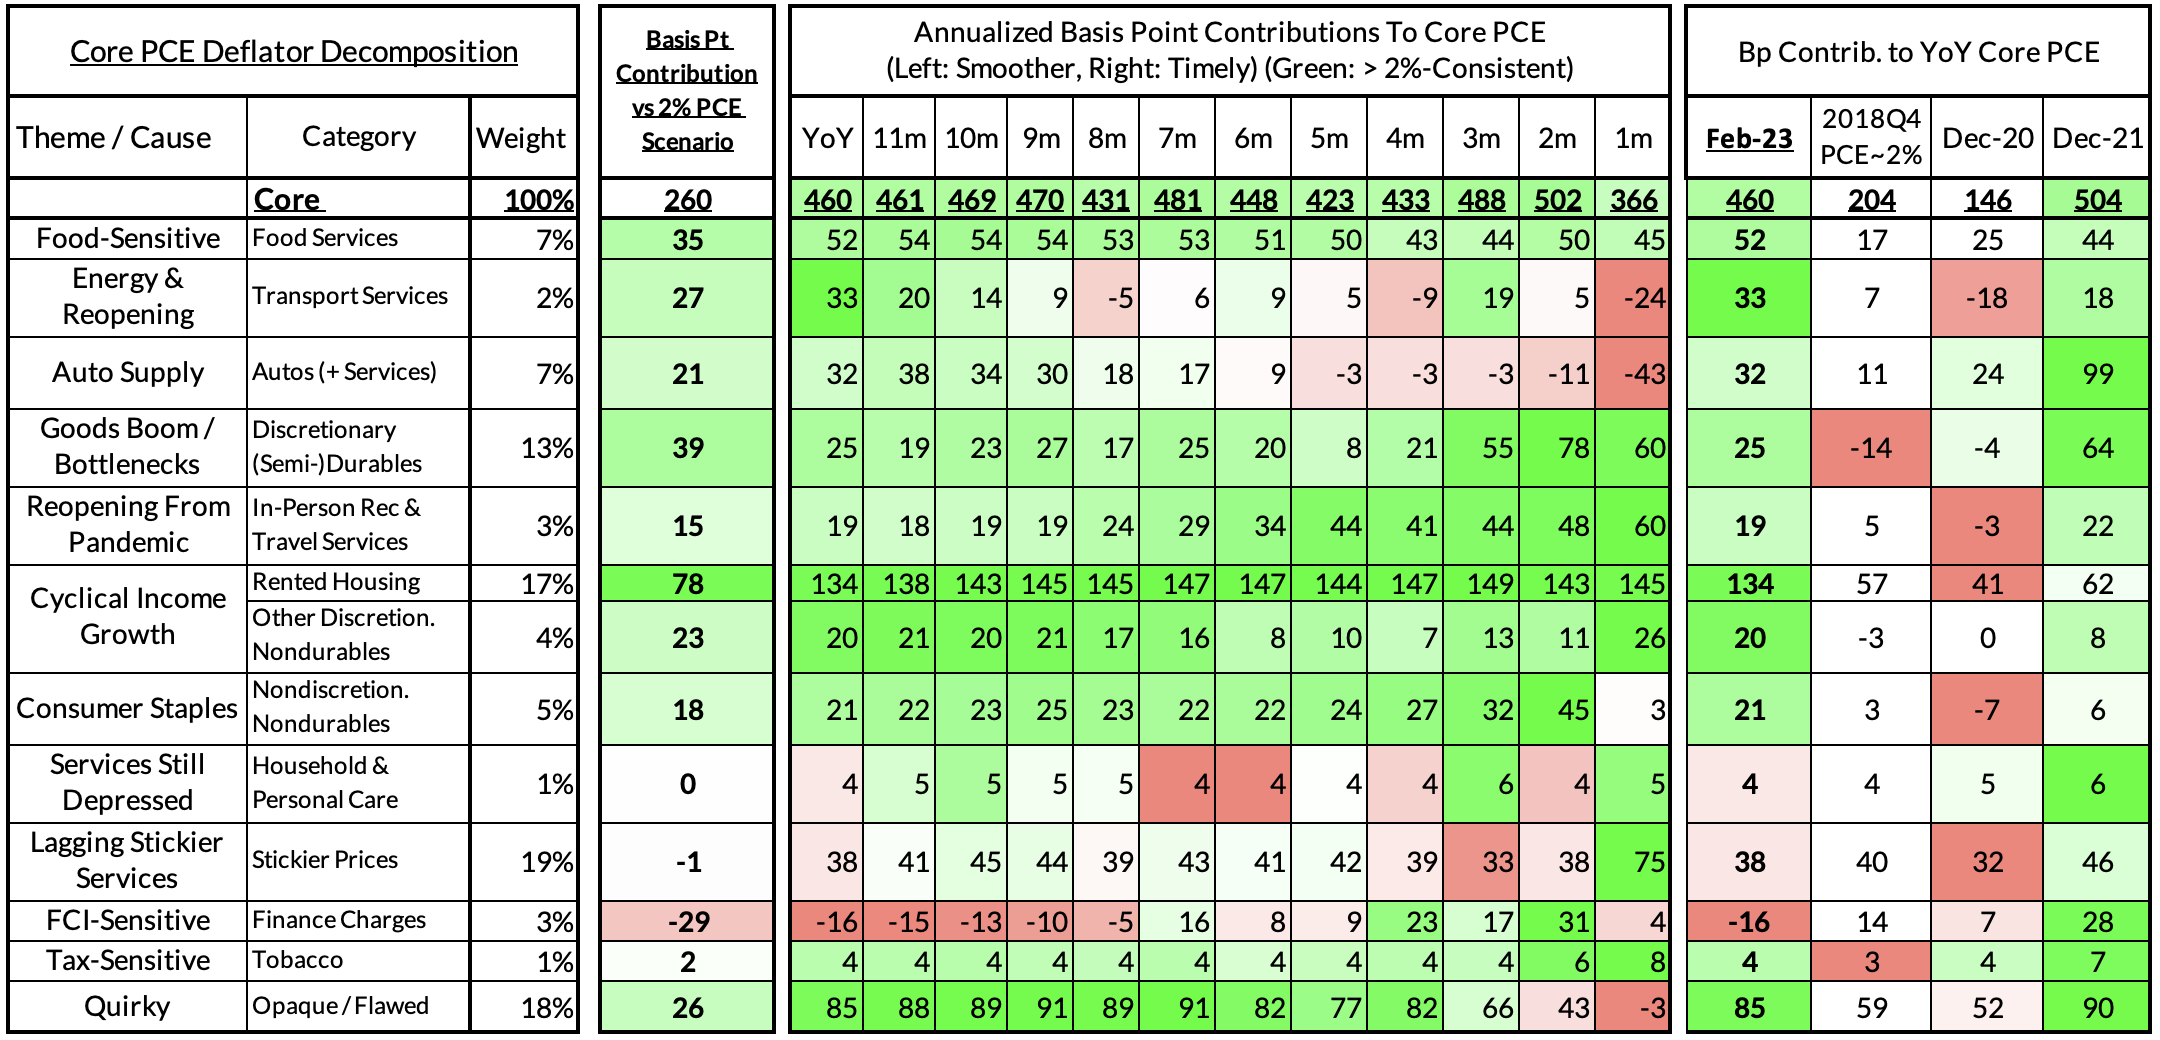
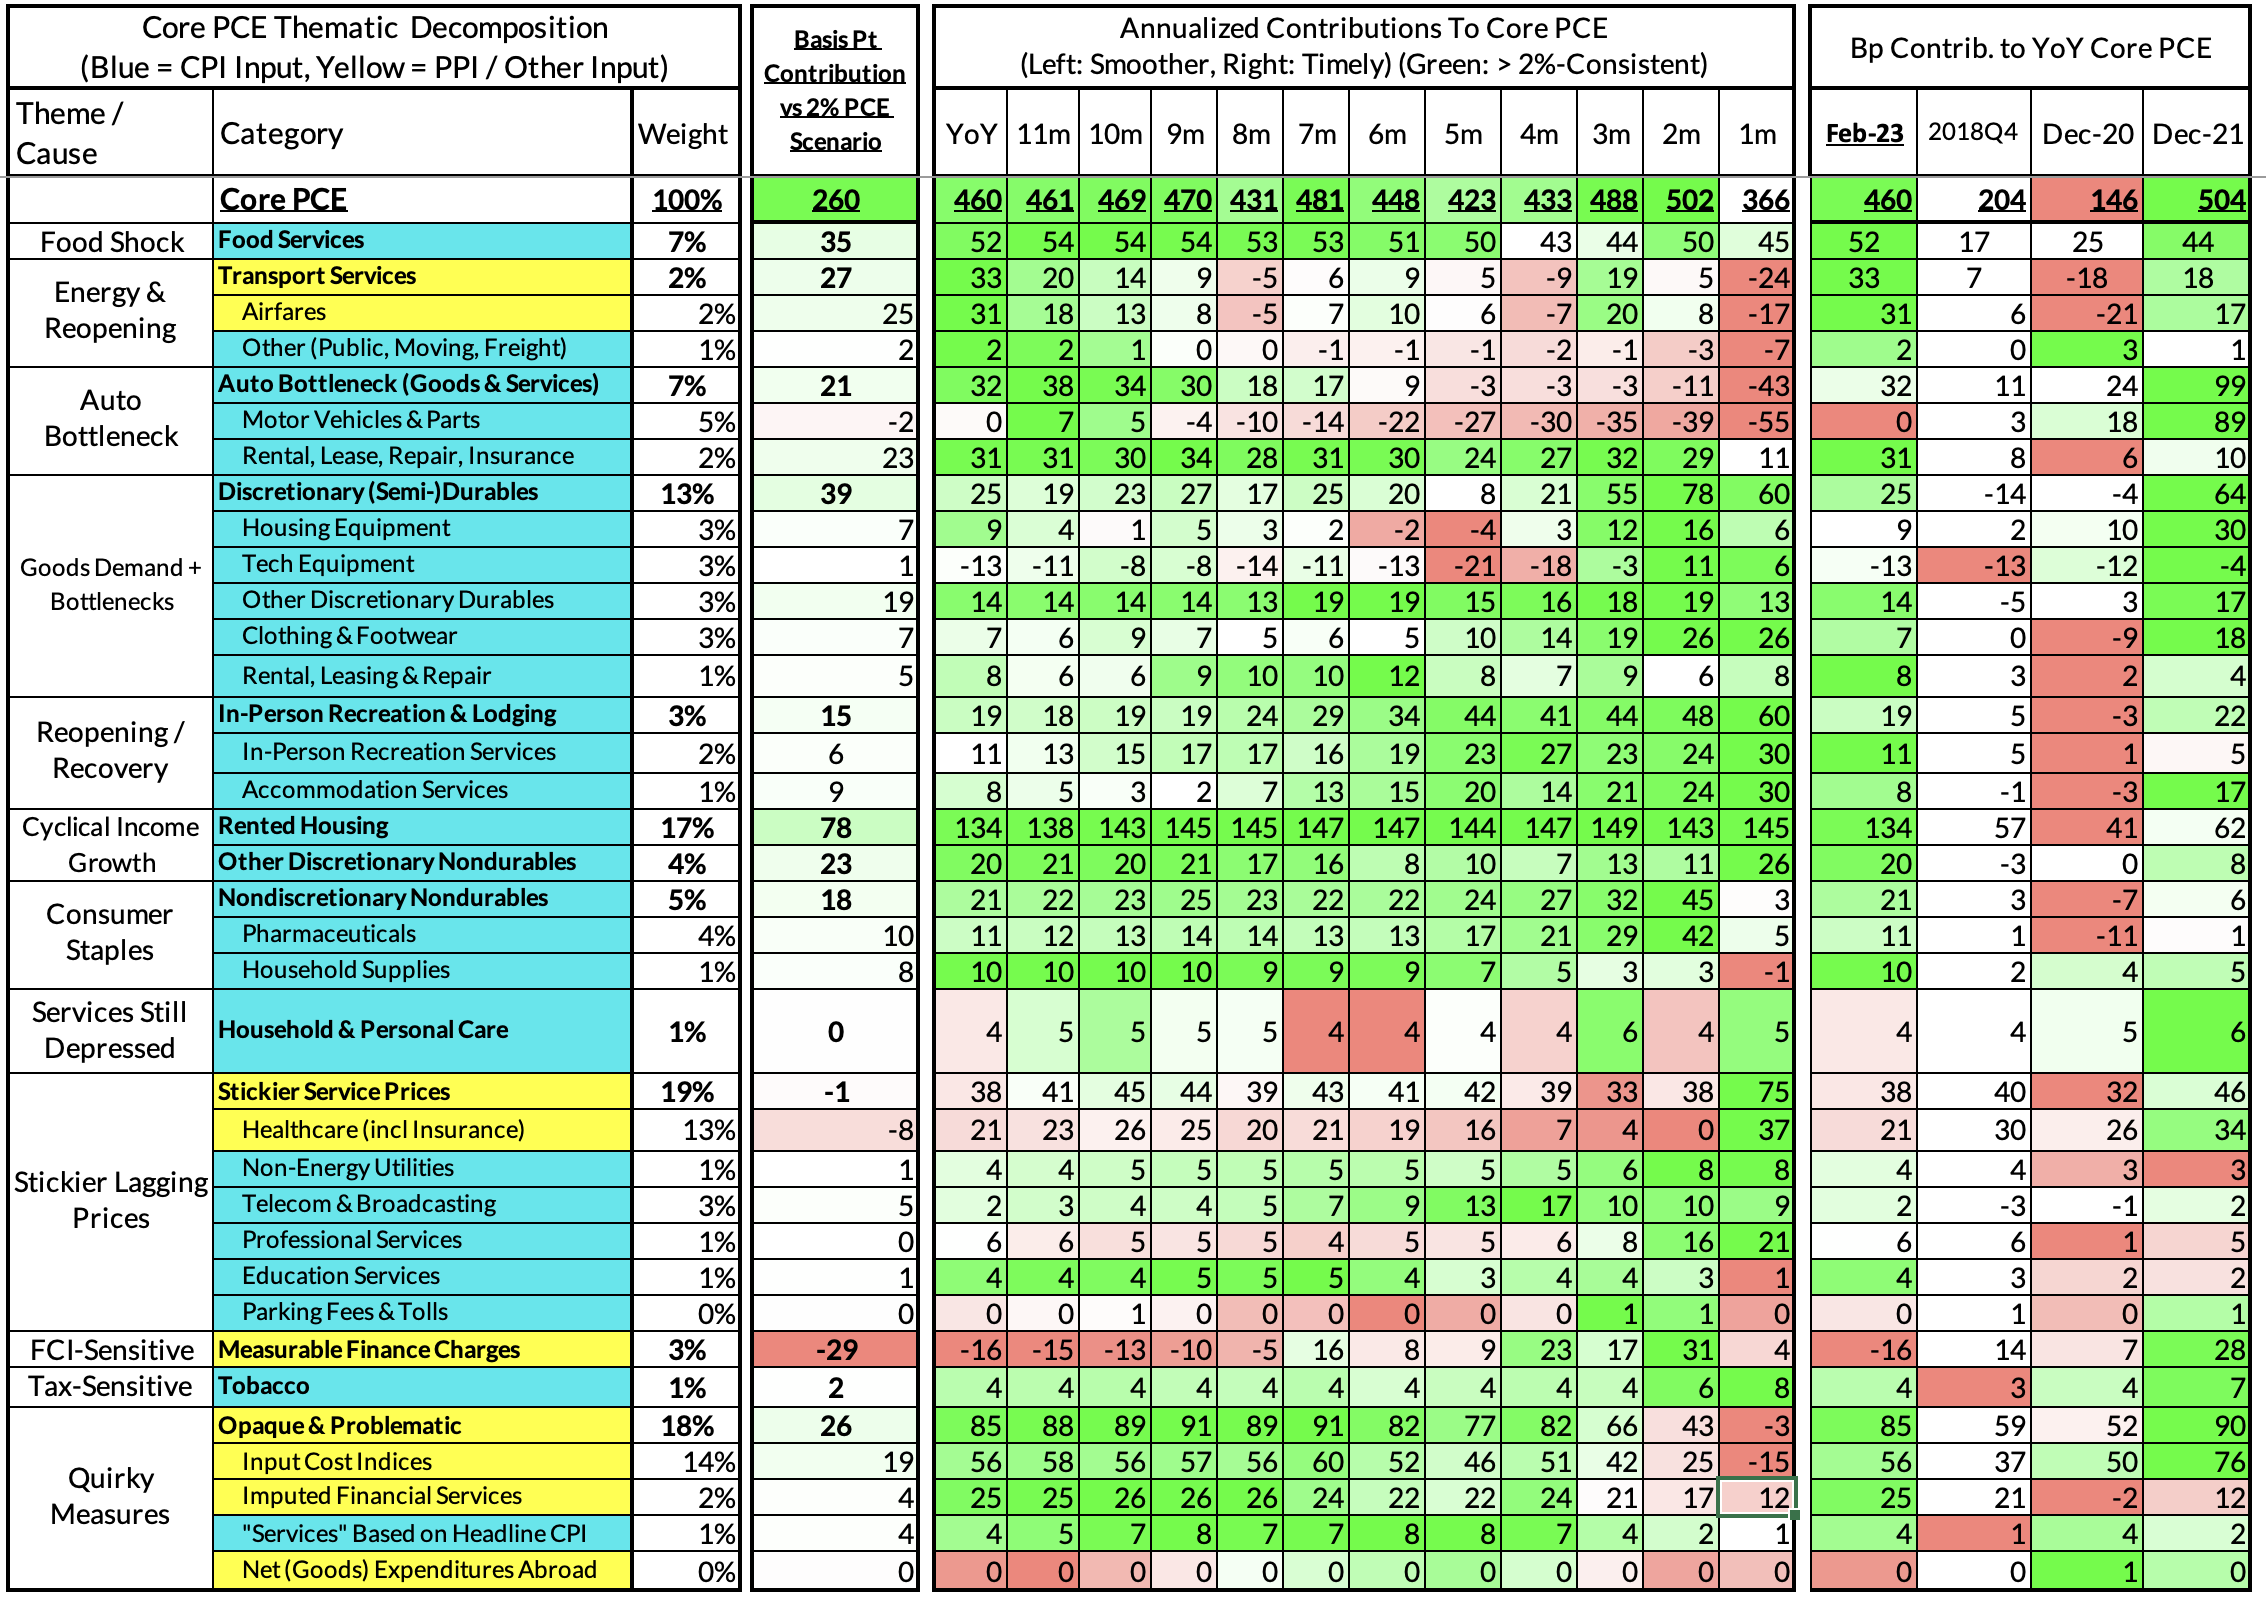
The final heatmap gives you a sense of the overshoot on shorter annualized run-rates. February's monthly core PCE yielded a 162 basis point overshoot vs 2% target inflation (3.62% annualized).
February's growth rate in "Core Services Ex Housing PCE" is on track to run at 4.64%, a 197 basis point overshoot versus the 2.72% run rate in this aggregate that coincided with 2% headline and core PCE.
We would call special attention to what we're seeing in the "Methodologically Quirky" categories we have flagged in the bottom rows. They are softening up quite a bit in recent months and could put downward pressure as slower wages, higher deposit rates, and food and energy price deceleration take further root.