Yesterday we received upside information from the PPI inputs to PCE, driven primarily by international flights (up 10.4%). But IPI data is also used for PCE prices of international flights and sent a very different signal (down 12.4%). The CPI analogue fell 2%. So what we have January airfare data across all available measures is a right mess. While today's data still leaves January with a hot PCE print (as we warned) and Q1 inflation upside risks remain.
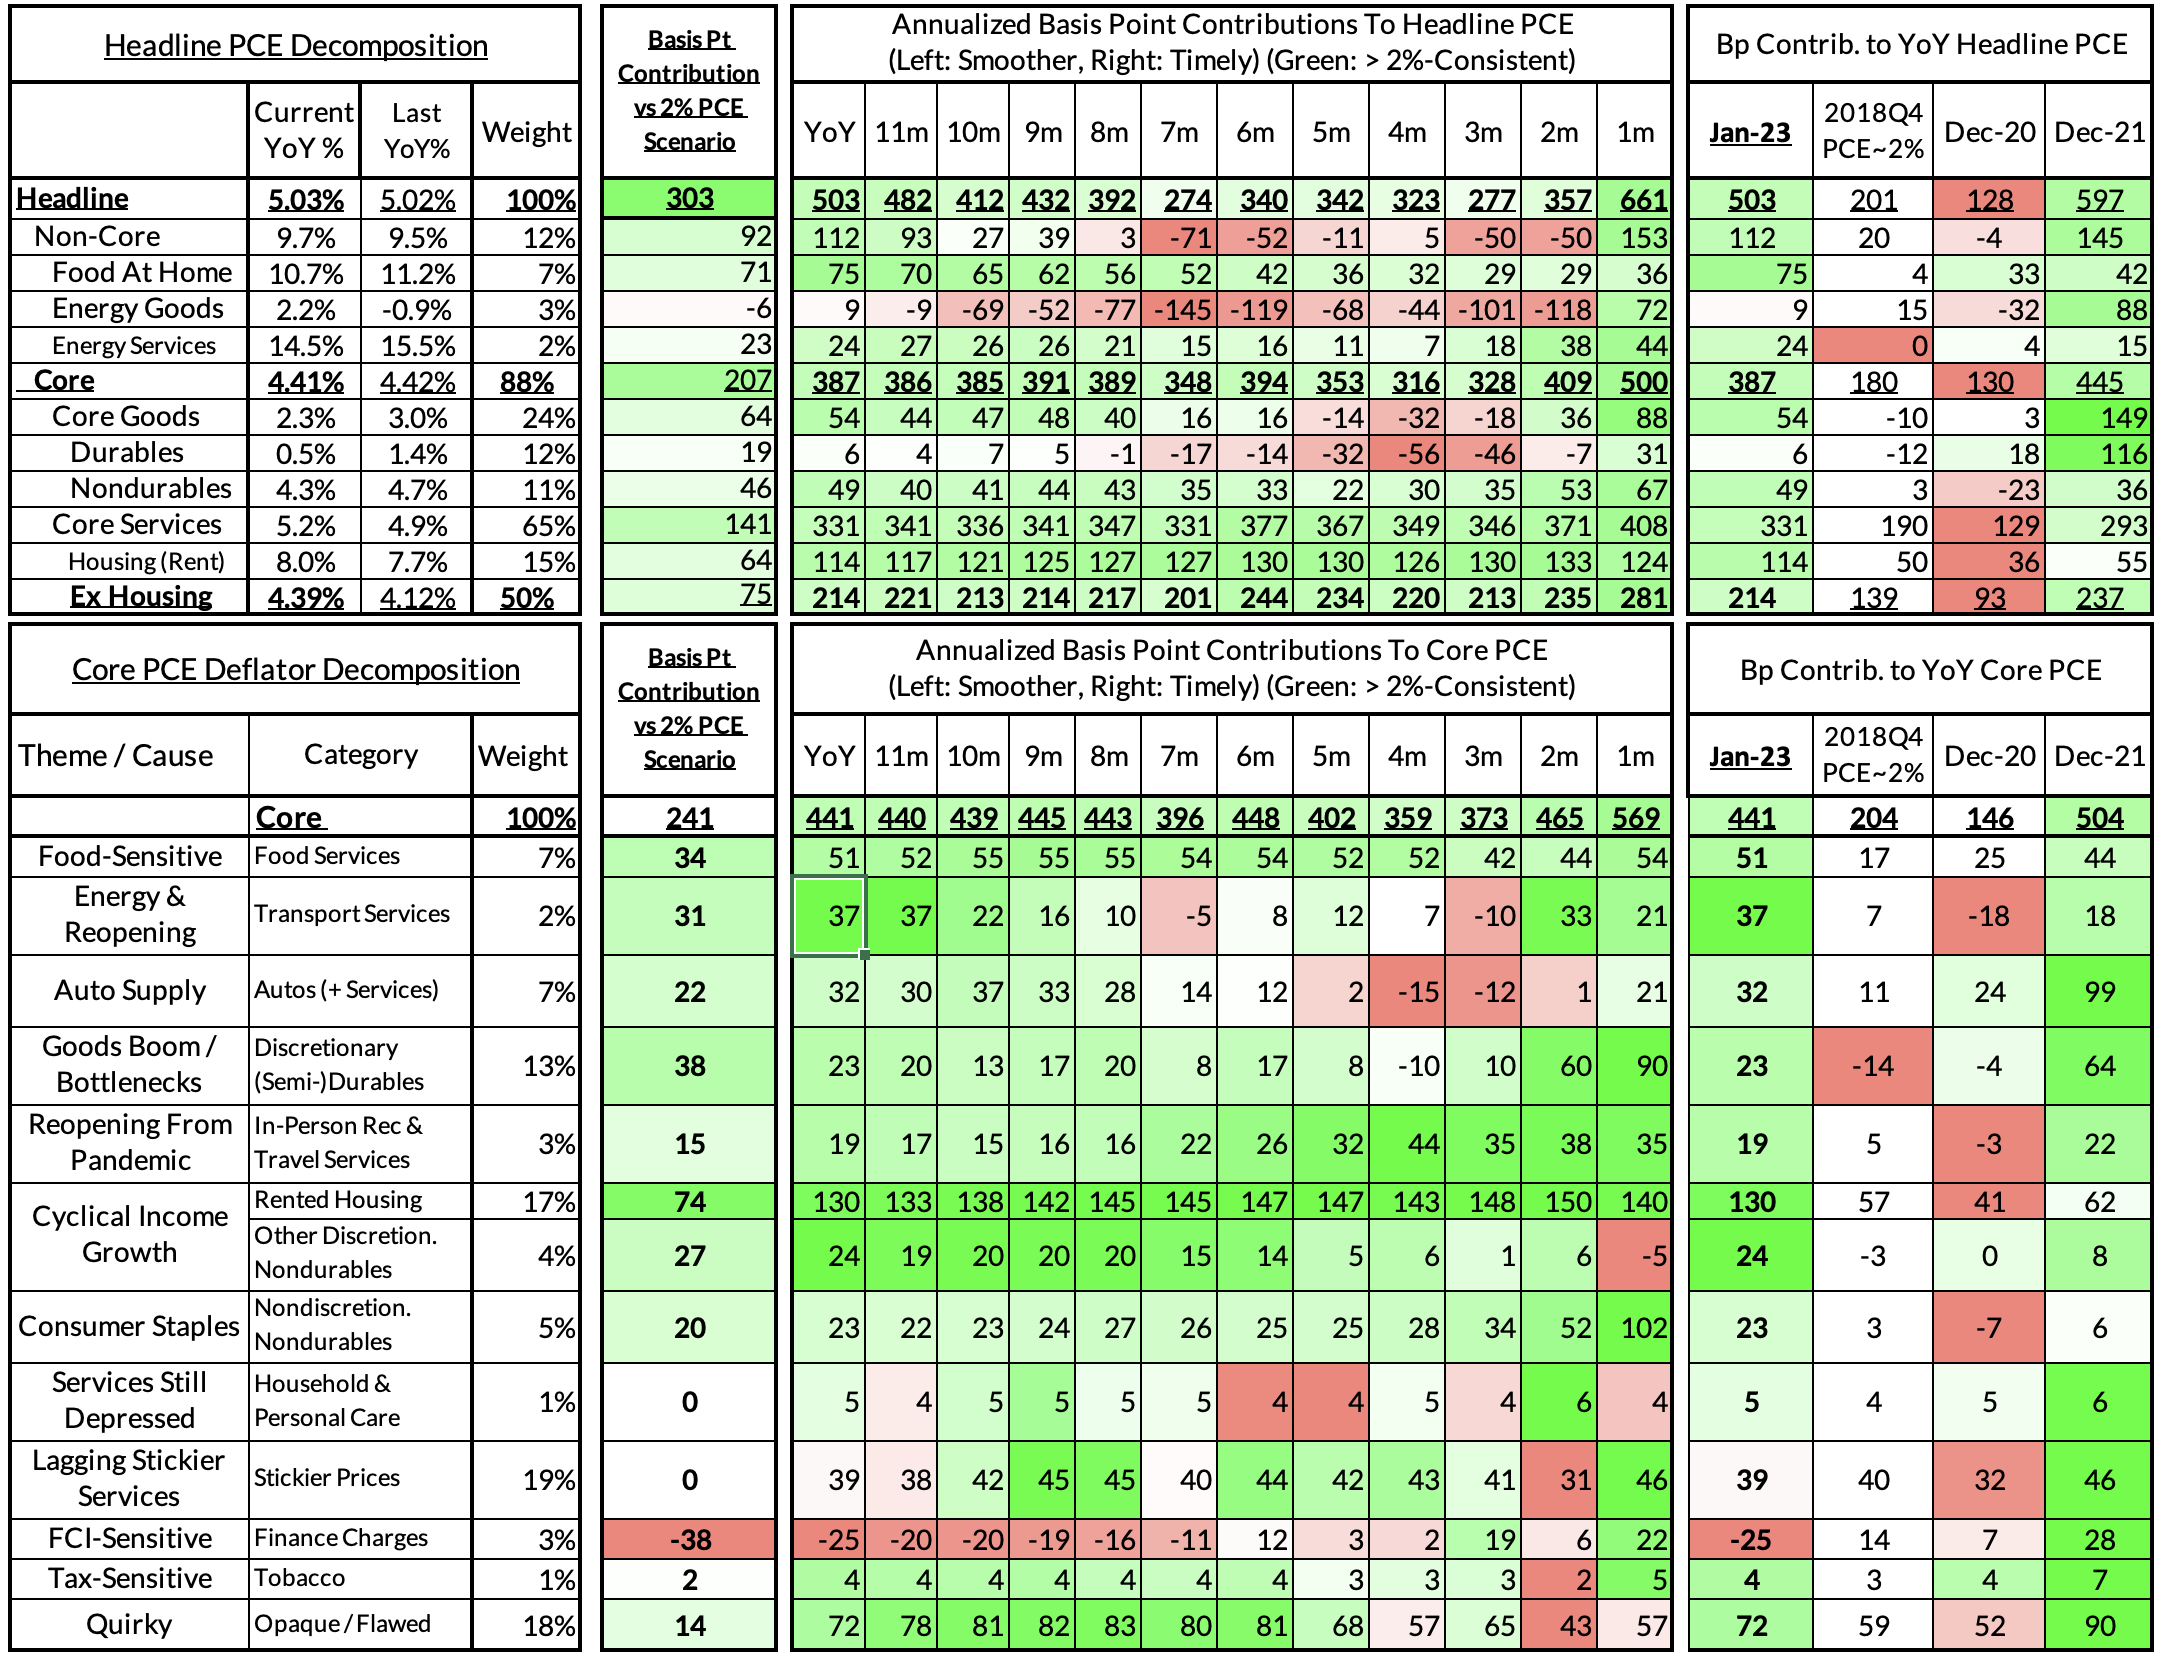
Headline PCE is now on track to stay flat, from 5.02% year-over-year in December to 5.03% in January, as opposed to yesterday's implied 5.1% growth rate (now a 0.53% month-over-month increase)
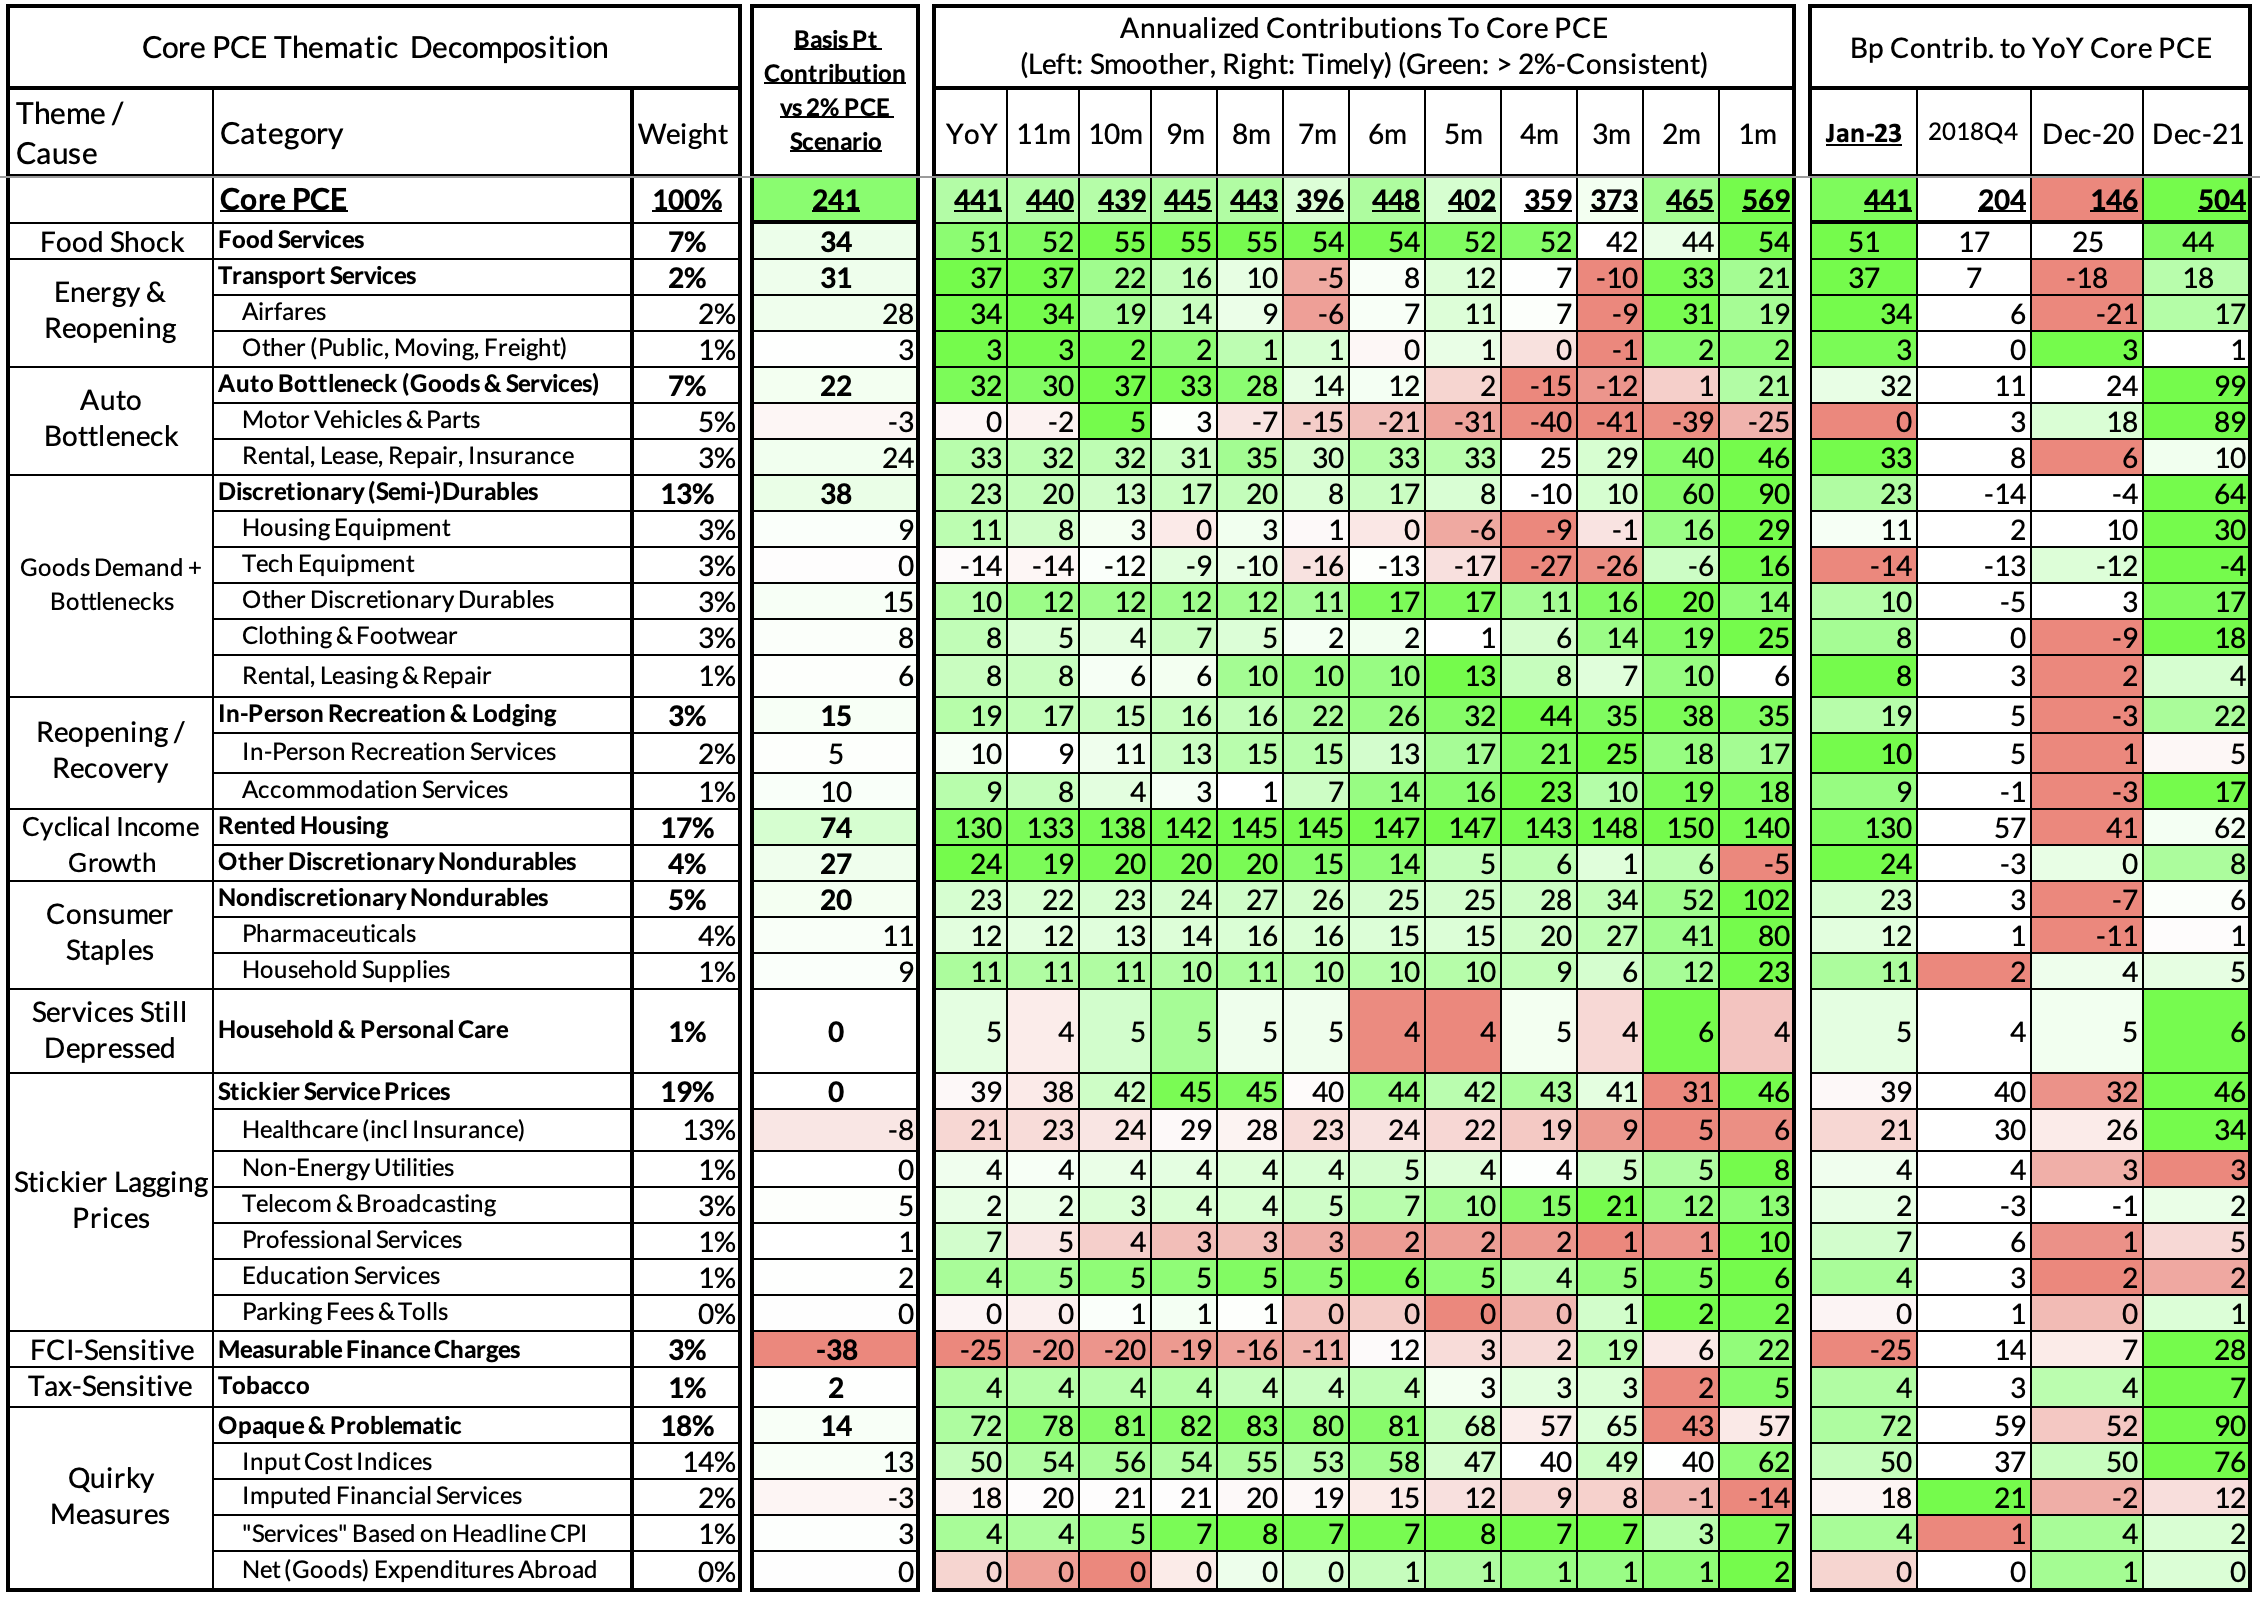
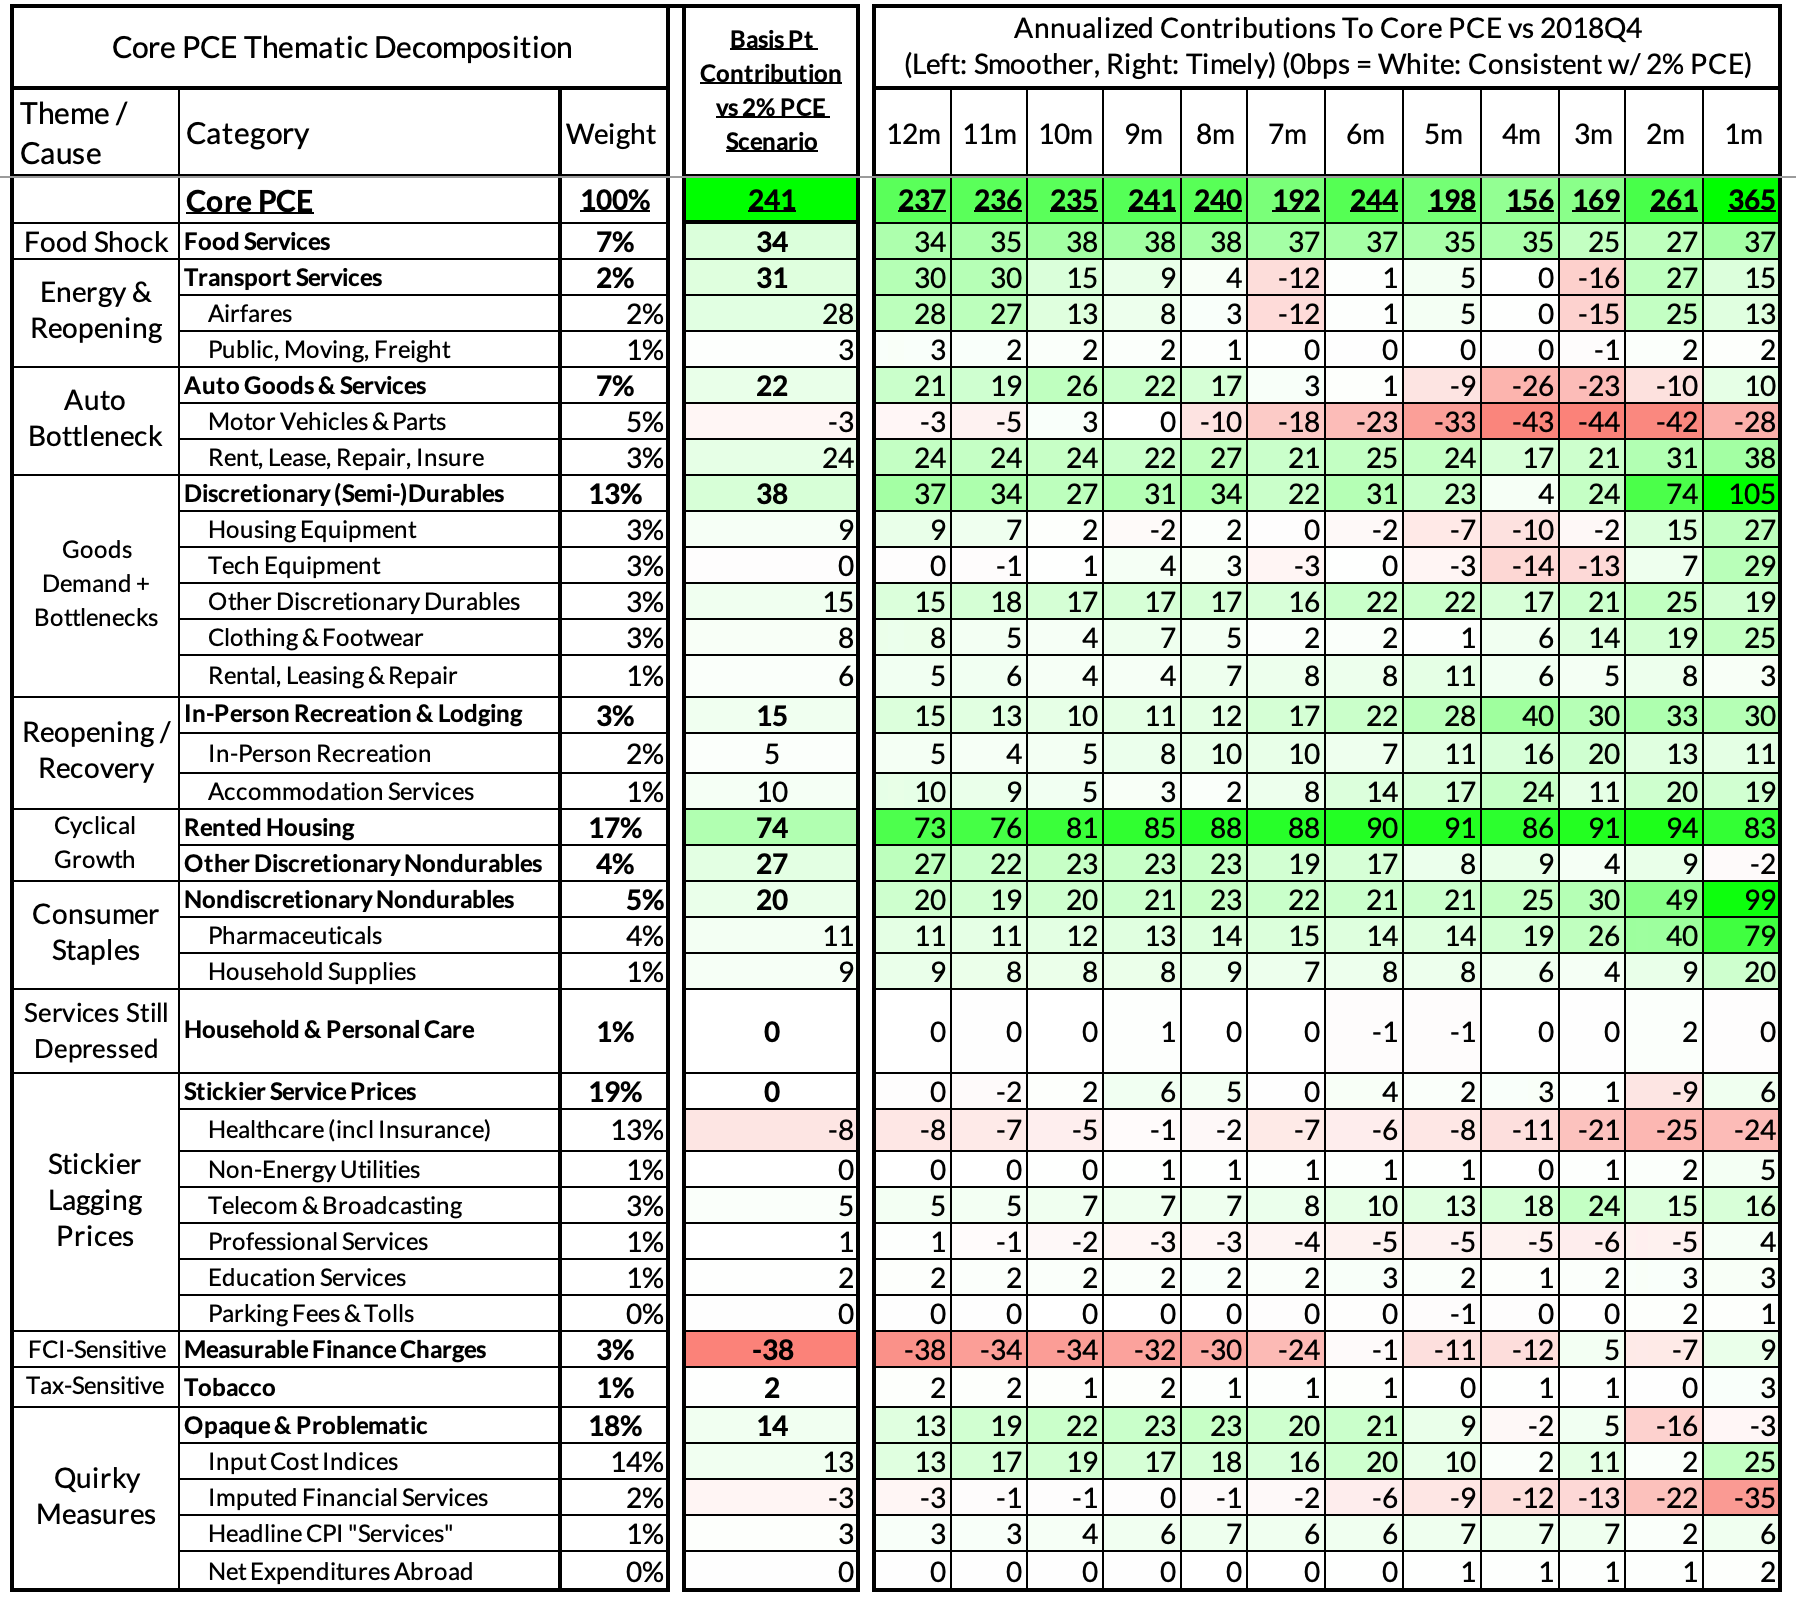
Core PCE is still on track to stay virtually flat from 4.42% year-over-year in December to 4.41% in January. (0.46% month-over-month increase)
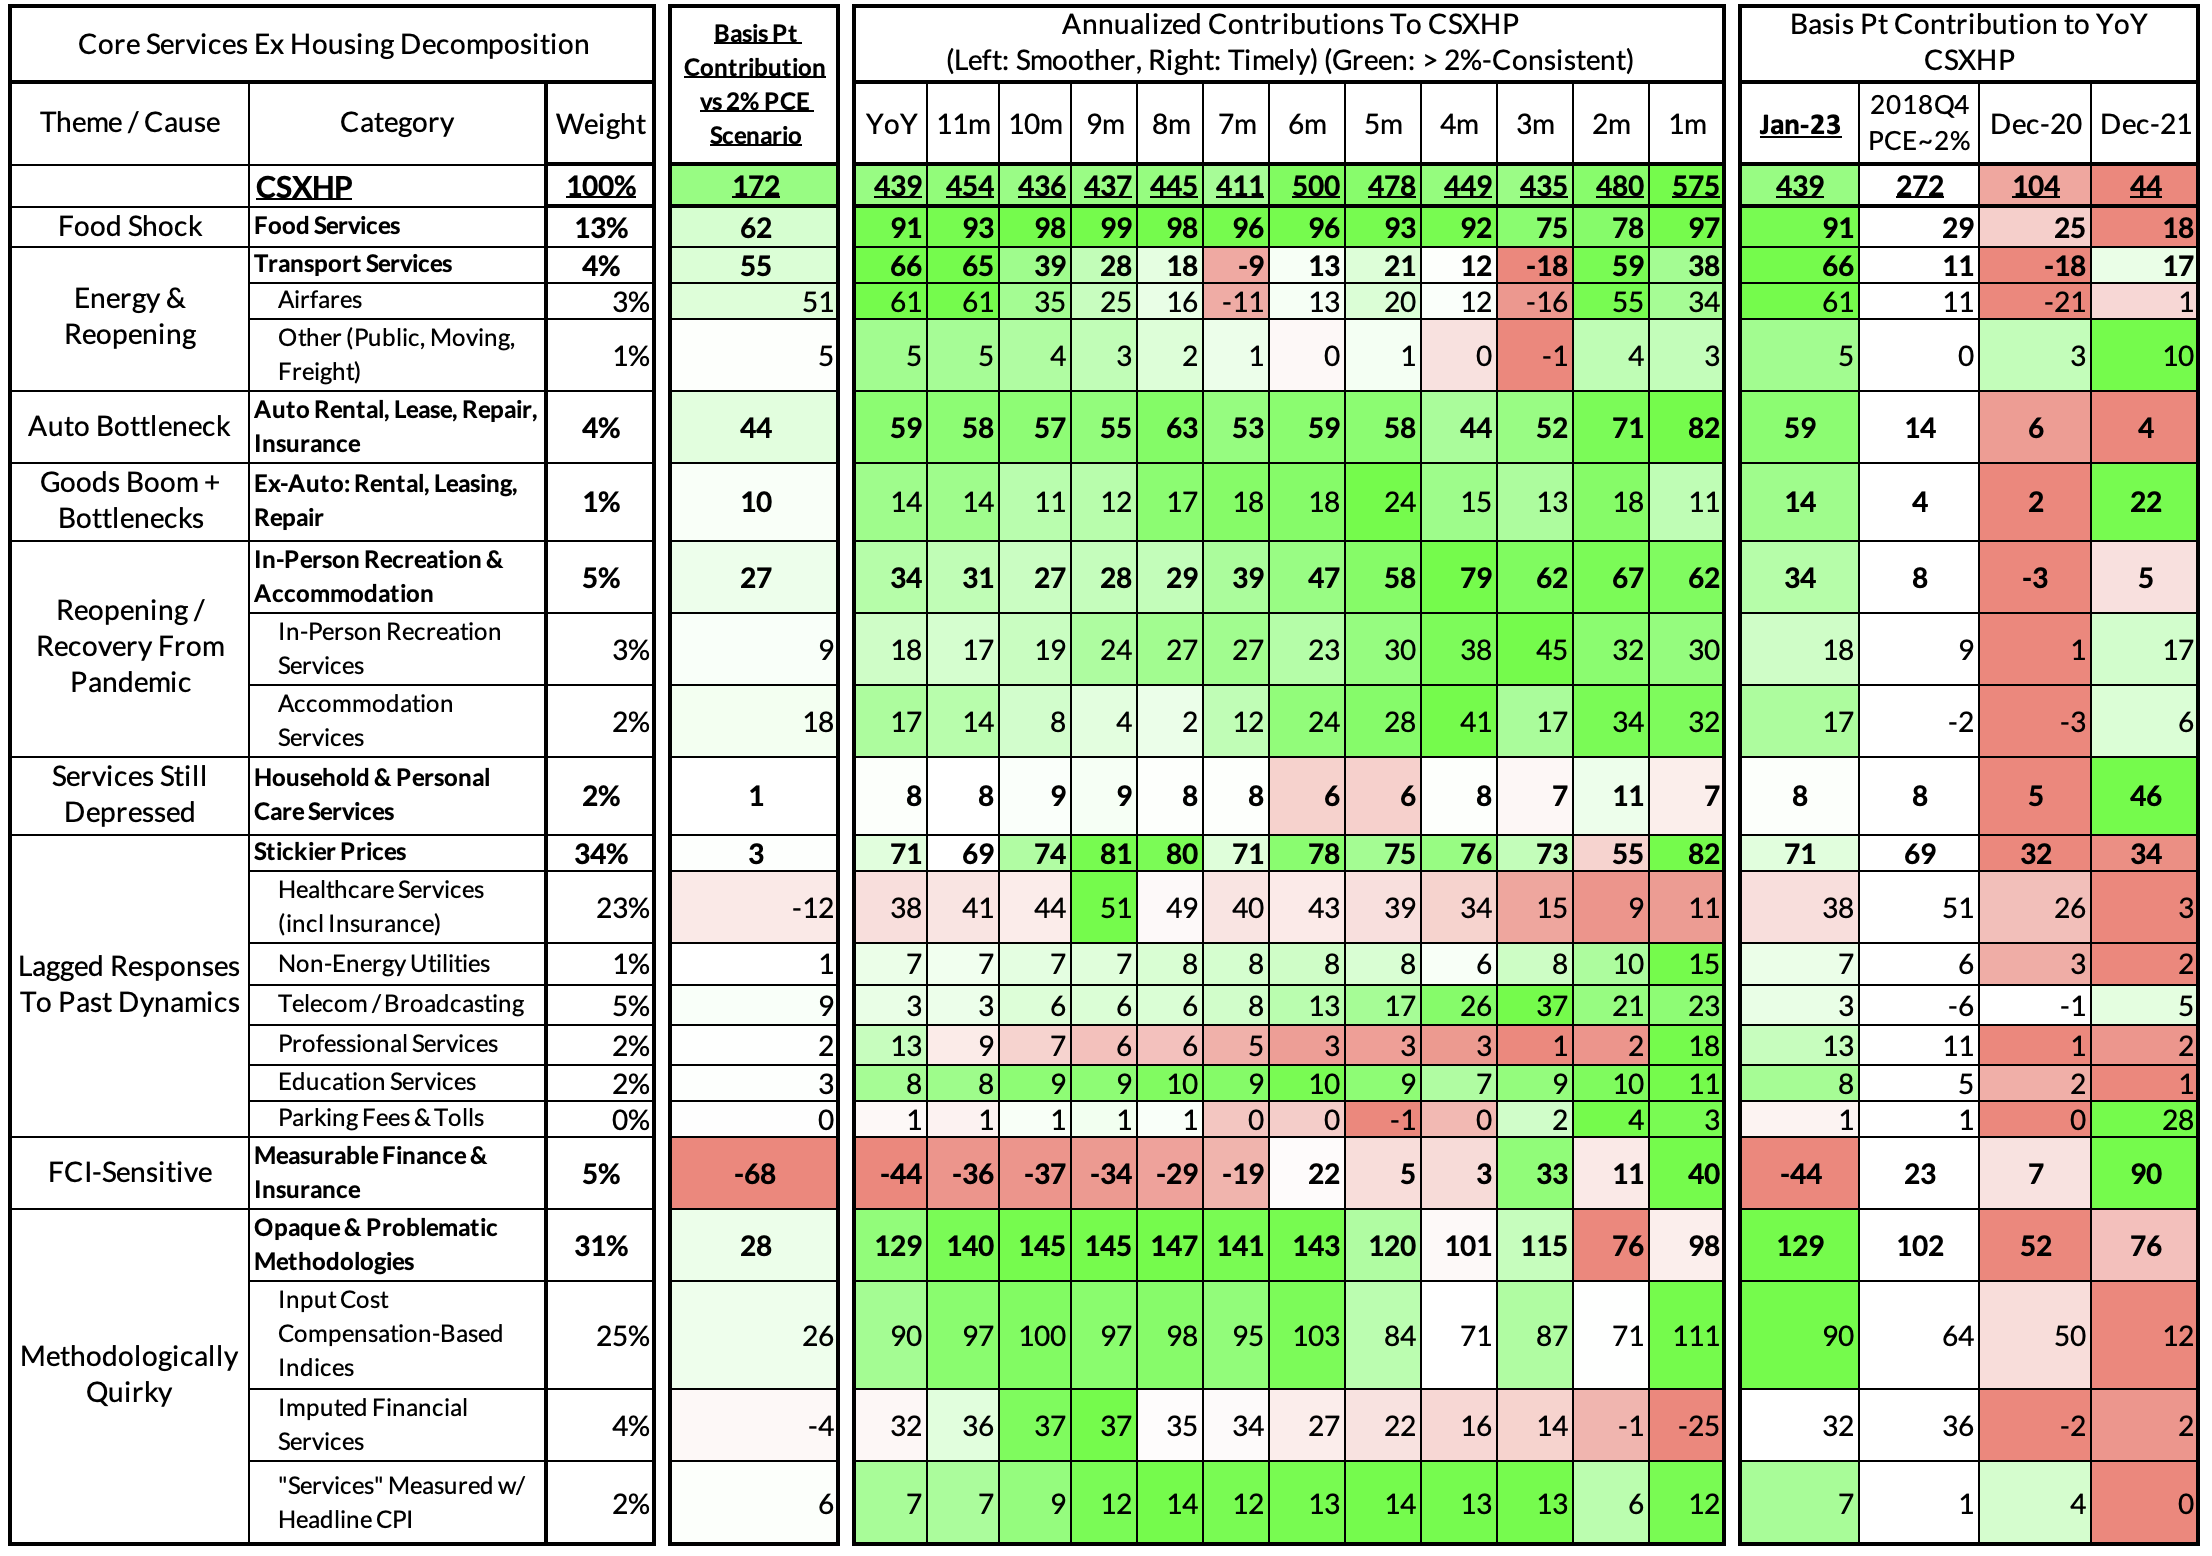
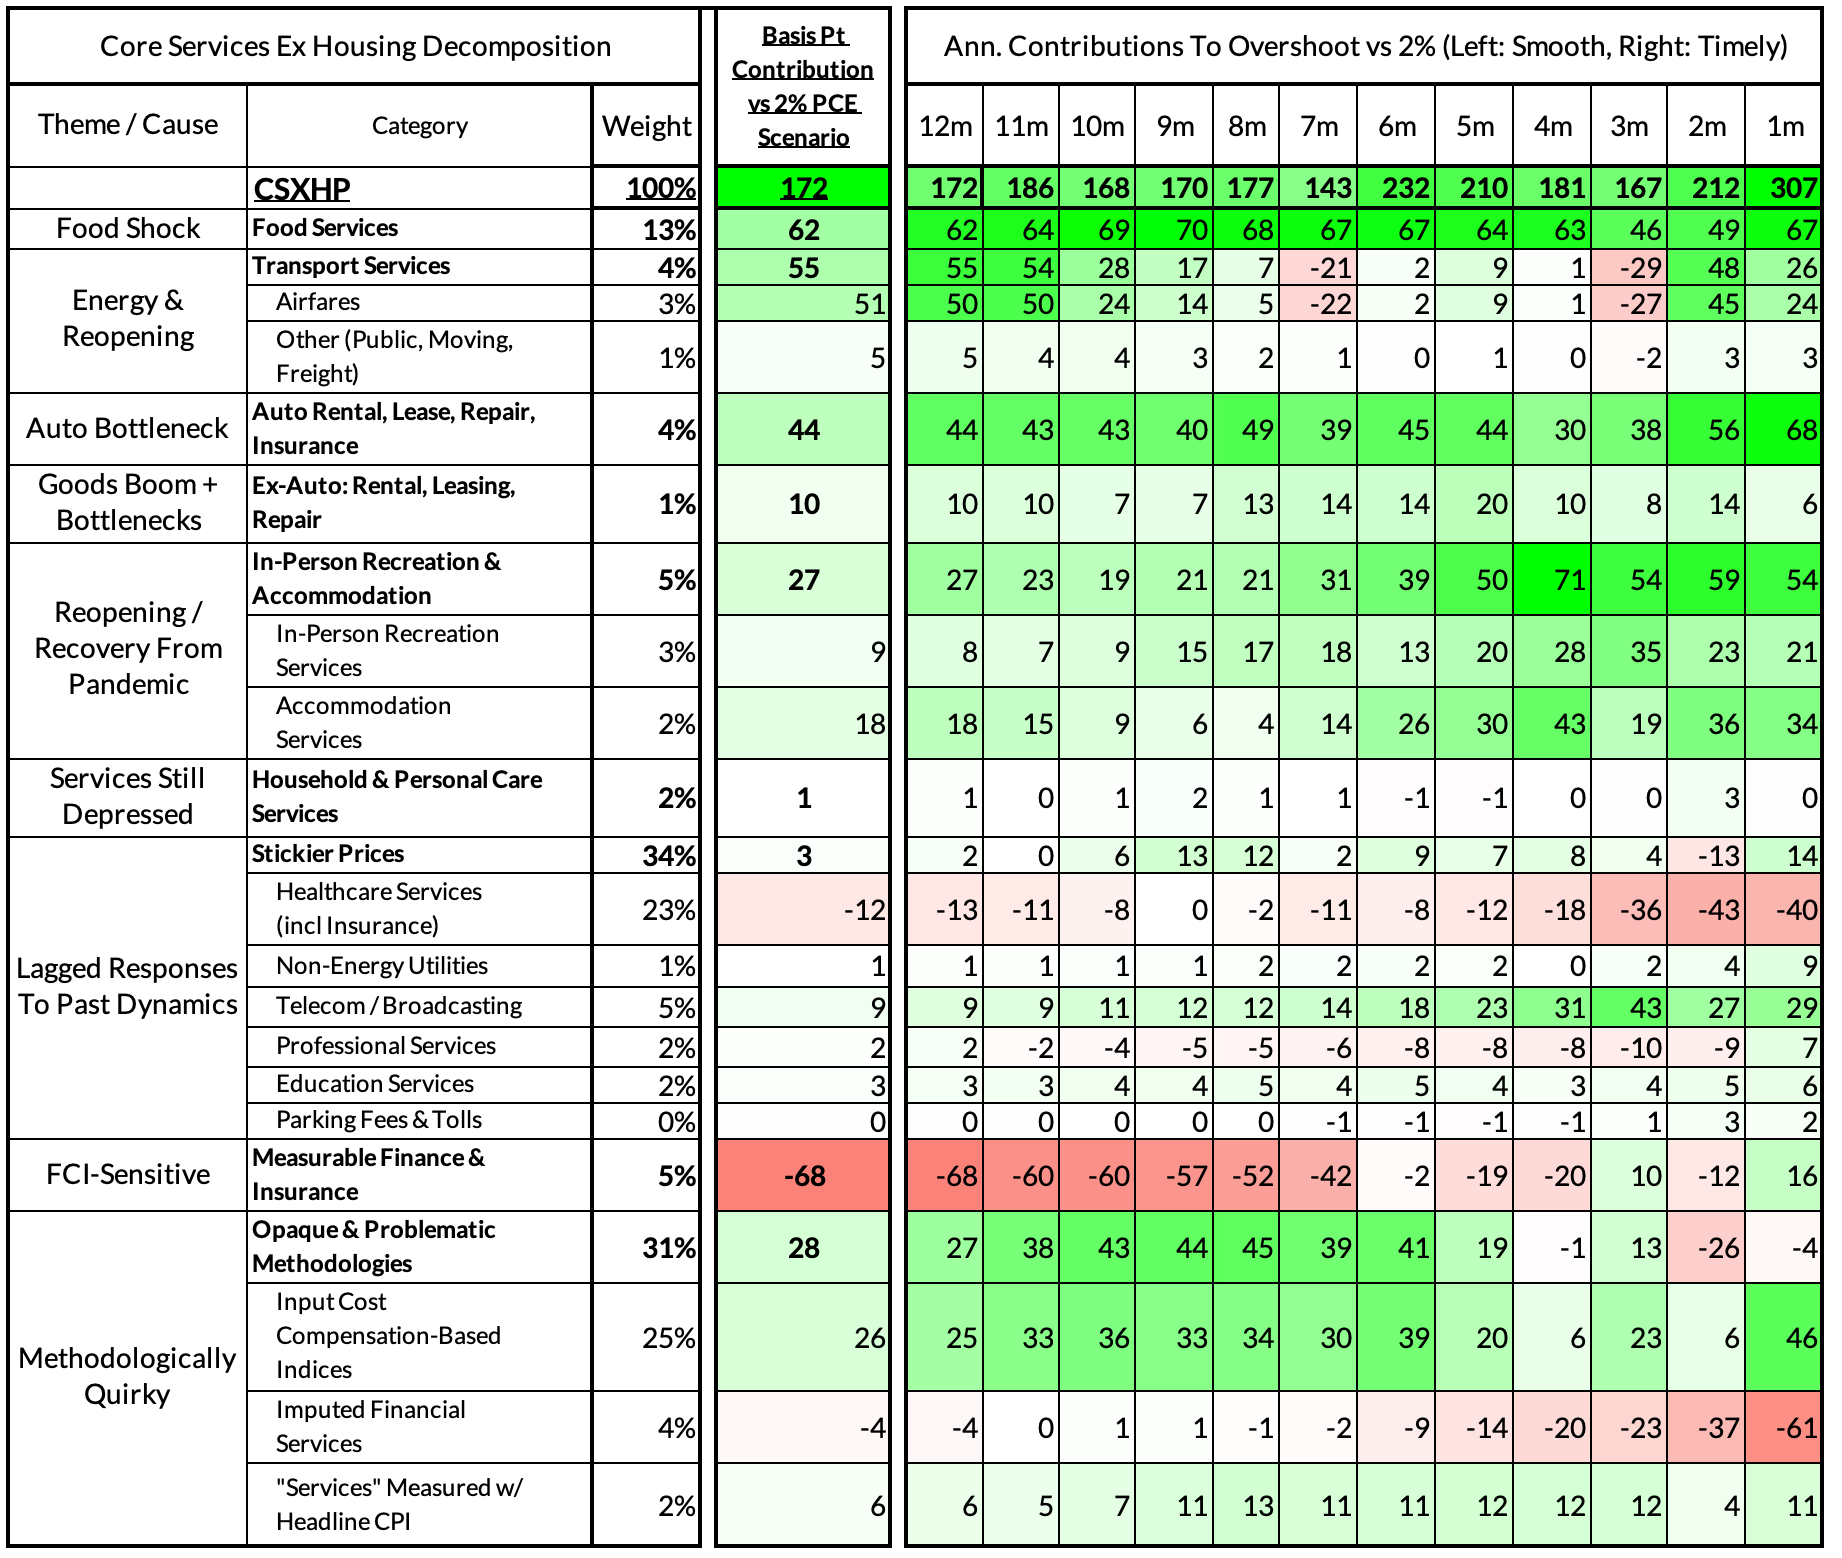
Core Services Ex Housing PCE is on track to increase, though marginally less than yesterday implied, from 4.12% year-over-year in December to 4.39% in January. (0.47% month-over-month increase). This index is still most vulnerable to tracking error since it involves an outsized share of non-CPI non-PPI non-IPI inputs.
Core PCE Heatmaps
Core Services Ex Housing PCE Heatmaps
The link has been copied!
Your link has expired. Please request a new one.
Your link has expired. Please request a new one.
Your link has expired. Please request a new one.
Great! You've successfully signed up.
Great! You've successfully signed up.
Welcome back! You've successfully signed in.
Success! You now have access to additional content.