Labor Market Recap January 2024: Weather Clouds Some Weakness
The headline January labor market data was strong, but there are still some signs of weakness under the surface.

The headline January labor market data was strong, but there are still some signs of weakness under the surface.
The headline January labor market data was strong, but there are still some signs of weakness under the surface.
The headline unemployment rate remained at 3.7%, and the establishment survey showed an impressive 353,000 jobs added in January. Additionally, last month’s 216,000 jobs added was revised upwards to 333,000. Some of the signs of deterioration in the household survey from December reverted in January. Prime-age employment rebounded from 80.4% to 80.6%, with an improvement in labor force participation and improving employment rates for both men and women. The primary source of the decline in employment in December, a decline in the hiring of those out of the labor force, reverted in January. However, the decline in full-time employment in December remained in January.
The Employment Cost Index for Q4 2023 grew at just an annualized rate of just 3.7% for wages and salaries and 3.5% for compensation. This is the slowest ECI has grown during the recovery and is very firmly in the territory of the Fed’s “consistent with 2% inflation” criteria. However, the establishment survey showed very strong wage growth over the past few months. The 3-month change in average hourly earnings in December (which would be the analog to ECI wages) increased at a rate of 4.2%. Average hourly earnings grew at an annualized rate of 6.8% in January, but this was heavily distorted by a large number of people not working for weather-related reasons. Average weekly earnings fell in January, and are currently growing at a sub-3% rate year-on-year.
It is very difficult to place too make firm conclusions from this month’s data. We are well in the most difficult time of year with respect to residual seasonality. The response rate for the establishment survey was only marginally improved from last month (56.0% vs 49.4%). The hours distortion makes it difficult to discern much about wages. What we can say is that the worst-case scenario we feared from last month—that the household survey deterioration would stick—was avoided this month. Despite the eye-popping headline jobs number, there is sufficient evidence underneath the surface that points to a slowing labor market, especially if one takes a longer view of the data.
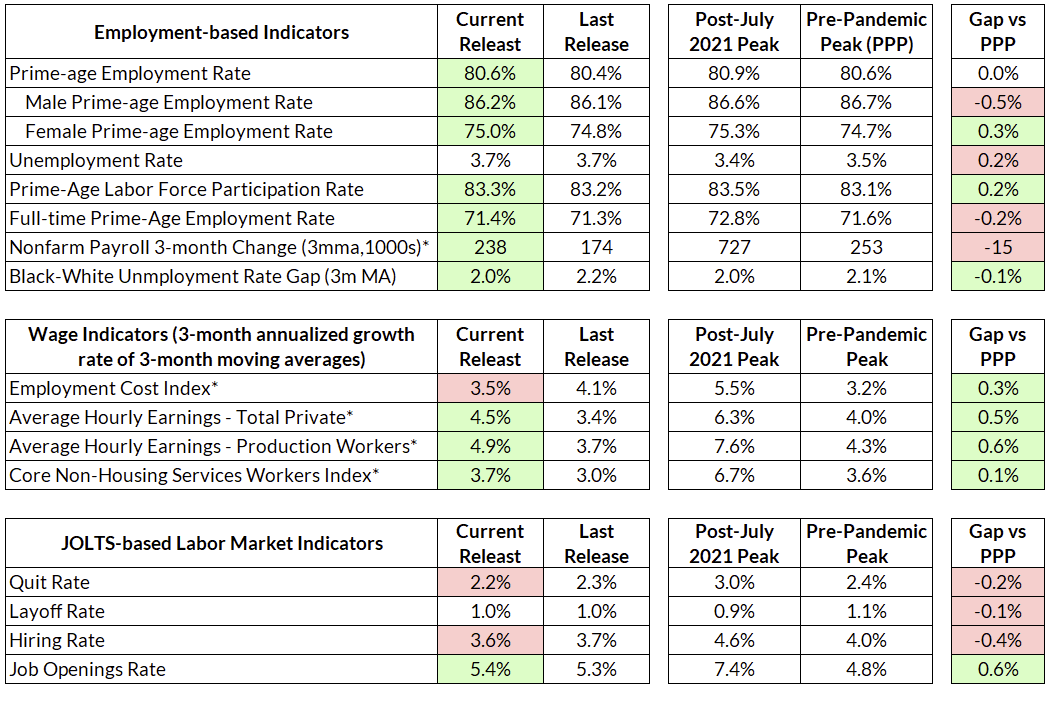
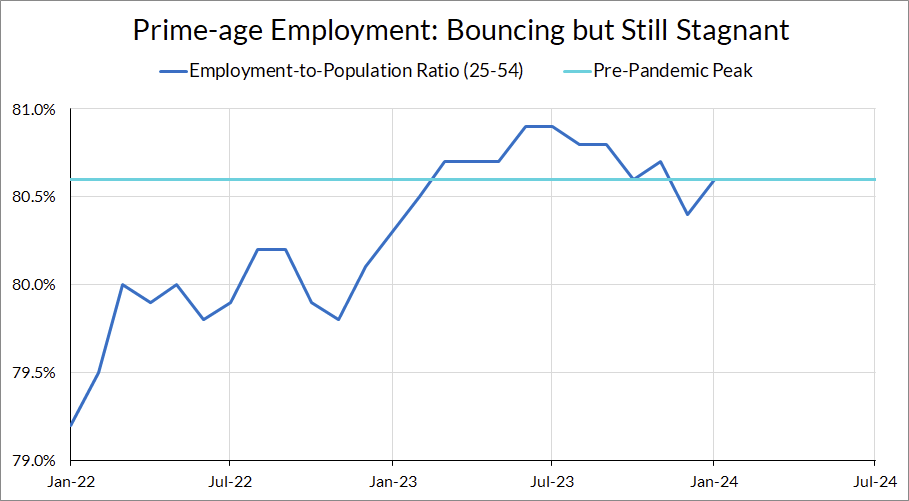
Last month, we highlighted the decline in the prime-age employment rate as a sign of weakness in the labor market. This month, the prime-age employment rate rebounded most of the way back to November, increasing by 0.2pp to 80.6% after falling 0.3pp last month.
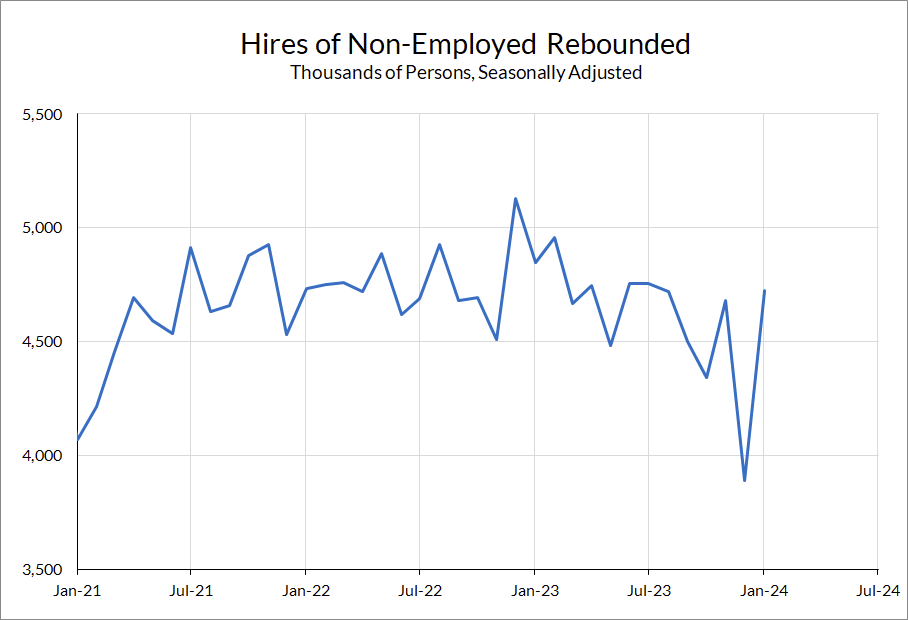
The fall in employment last month came primarily from a drop in the hires of people out of the labor force. This completely reversed in January. This dynamic is why the unemployment rate has remained unchanged at 3.7% for the past three months, despite the gyrations in the employment rate. Overall, labor market flows in general this month were roughly at the levels of the last six months.
However, one notable deterioration in December did stick this month: the decline in full-time employment. Full-time employment, both overall and prime-age, declined significantly in December. In January, full-time employment improved, but only marginally.
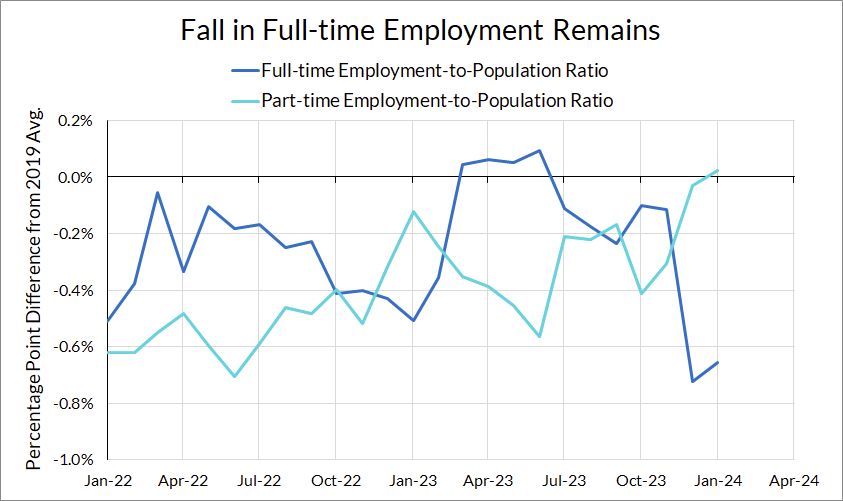
While there were weather and seasonality issues potentially plaguing the establishment survey in January, the household survey’s decline in full-time employment occurred primarily in December and is derived from the household survey question that asks if workers “usually” work full- or part-time. The drop in full-time employment likely represents something more fundamental than the hours drop in the establishment survey. Still, it is still possible that there are seasonal issues here. Full-time employment also fell in the latter half of 2022, albeit at a slower pace, before popping back up in the early months of 2023.
Weather Makes Wages Hard to Interpret
The establishment survey showed very strong wage growth in January. Average hourly earnings grew at a blistering annualized rate of 6.8% in January for all private workers and 5.4% for production workers. This continues a general increase in the pace of wage growth over the past few months.
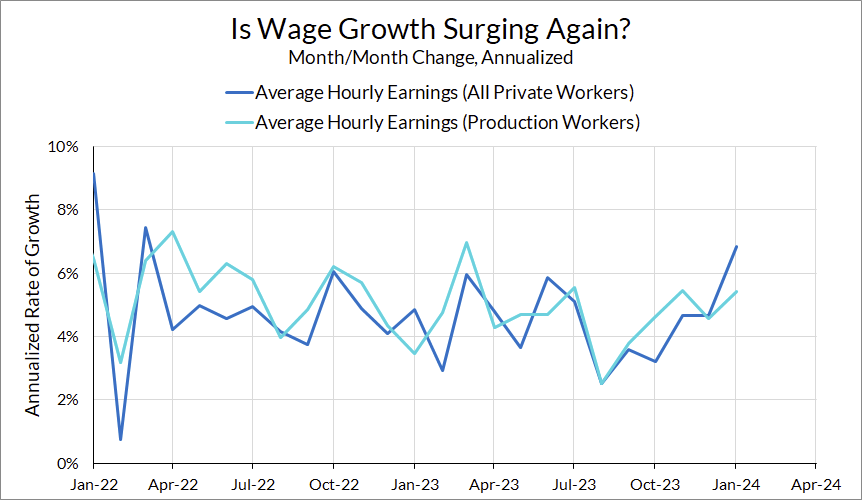
As always, it is hard to read the tea leaves of average hourly earnings. As a reminder, average hourly earnings are established by dividing one crude aggregate by another (earnings and hours). This month, the increase in average hourly earnings came primarily from a decline in hours; aggregate weekly hours fell in January, driven primarily by a decline in average weekly hours. Average weekly earnings actually fell slightly.
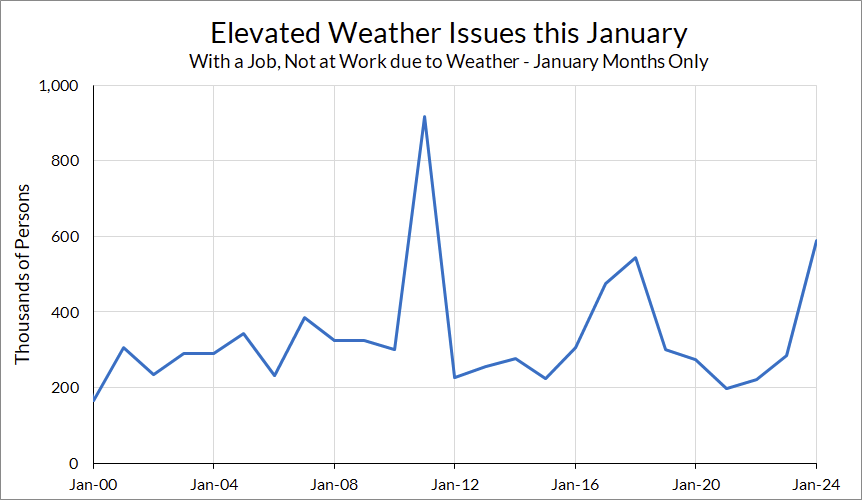
One potential reason for the hours decline was weather. The household survey asks employed respondents if they were employed but not at work due to weather; in the January survey, 588,000 respondents reported missing work due to weather. This was an unusually high number even for January.
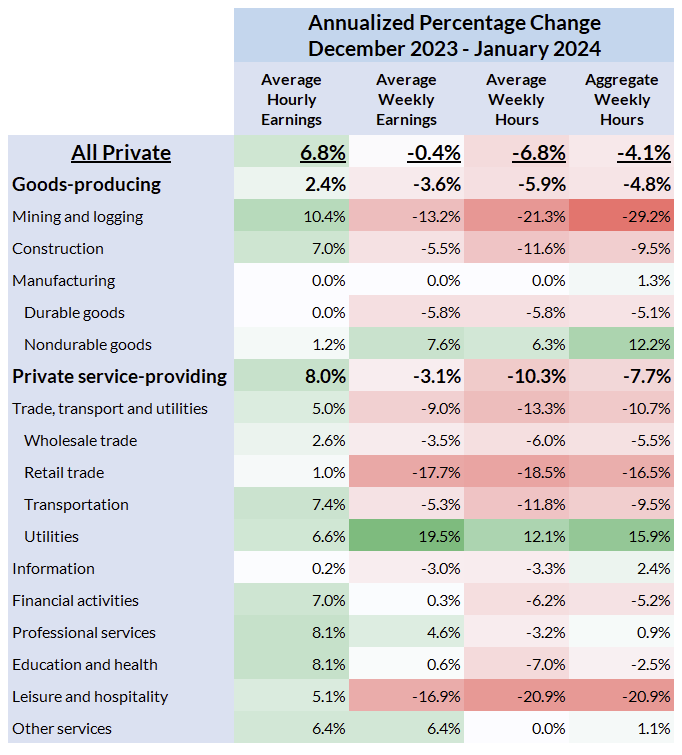
If one drills down into the sectoral data, it does look like the decline in hours was primarily concentrated in sectors that would be primarily affected by weather. Mining and logging, transportation, retail trade, and leisure and hospitality all saw significant declines in hours in January. Many of those sectors exhibited the pattern of declining hours, declining weekly earnings, but increasing hourly earnings in January. Even though average hourly earnings in retail trade were largely unchanged, the decline in hours for that sector, which is generally lower-paying, would still drive the overall aggregate down.
If one looks at the other measures from the establishment survey, the labor market looks a lot cooler than the average hourly earnings number would suggest. Average weekly earnings were down slightly in January, primarily due to a decline in hours worked. It’s possible that there is an interaction with seasonality, labor hoarding, and weather here—the seasonal adjustment might expect these workers to be laid off normally, but firms may be keeping them on but cutting hours to avoid having to re-hire. This would conform with what businesses are saying in the soft data—firms in the Beige book are reporting a lower desire to expand employment but difficulty finding workers. Both JOLTS and the household survey show a very muted level of layoffs, which are disproportionately concentrated in January.
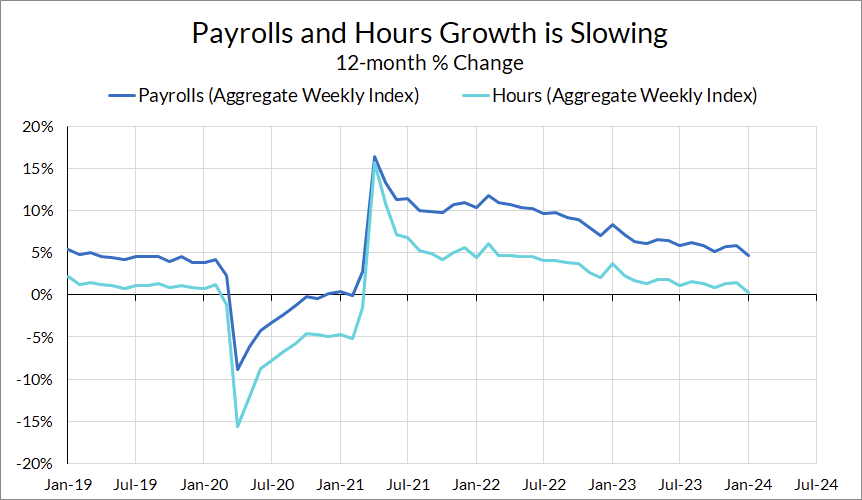
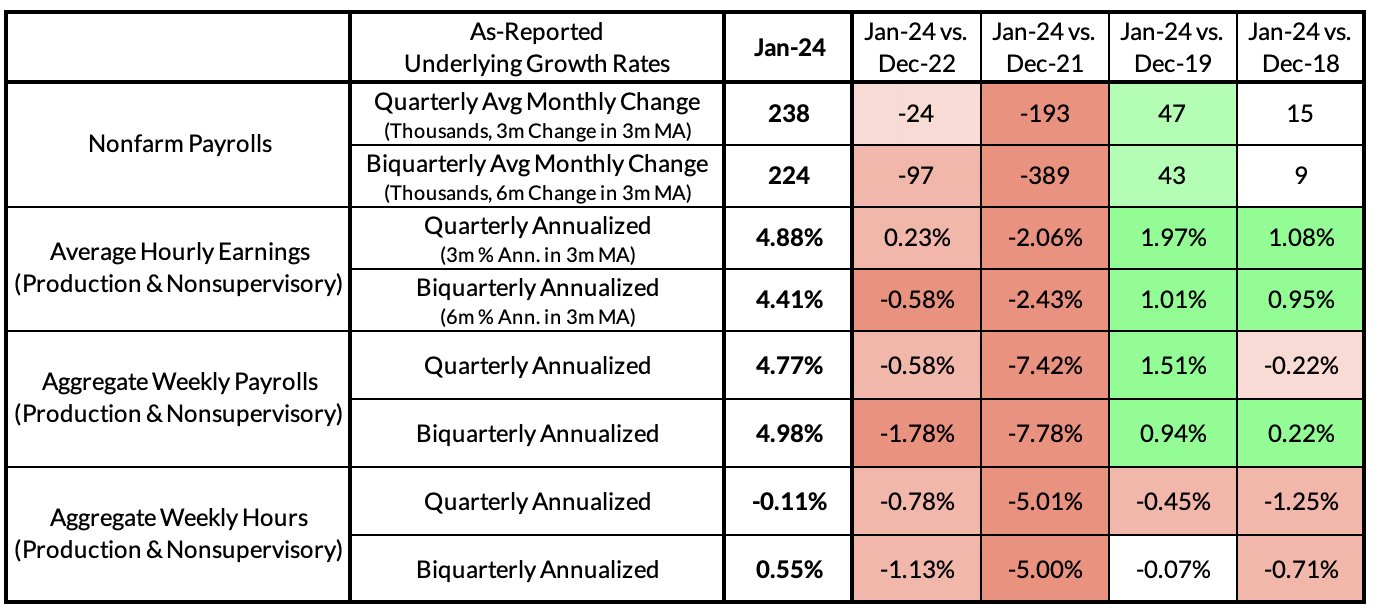
Ultimately, it still pays to take a longer view of the data. On a year-on-year basis, aggregate weekly payroll and hours growth is at its lowest level since the recession. Aggregate hours grew at just 0.3% over the last twelve months, and aggregate payrolls grew by just 4.7%.
Setting January aside, there has still been an upward trend in average hourly earnings growth over the previous few months. The 3-month annualized growth rate in December (which would be the establishment survey analog to ECI) was 4.2%. Meanwhile, ECI came in at a very soft 3.5% for compensation and 3.7% for wages for Q4. We generally treat the ECI as a superior signal to average hourly earnings, as it’s composition-adjusted.
However, even if one took the Q4 average hourly earnings numbers at face-value, it’s not clear that this is too hot. Powell’s benchmark for wage growth is productivity plus inflation. Strong productivity growth in the past few quarters (and likely the current quarter) and the potential for wage catch-up growth means that there should be more room for wage growth than his previously-stated range of 3.0 - 3.5% would indicate.
The huge payroll number, upwards revisions to last month and the fact that the household survey deterioration did not stick means March is definitely off the table. We are relieved that our worst-case scenario did not come to pass, but there is a risk here that the headline numbers overstate the strength in the labor market.
The nature of the risks remain the same, even if they are diminished compared to last month: waiting for the labor market to deteriorate before cutting is too late, and the Fed still needs to be preemptive against labor market risk.