Labor Market Recap December 2023: Some Concerning Signals Under a Lot of Noise
In December, the labor market risks shifted further over towards unemployment.

In December, the labor market risks shifted further over towards unemployment.
In December, the labor market risks shifted further over towards unemployment.
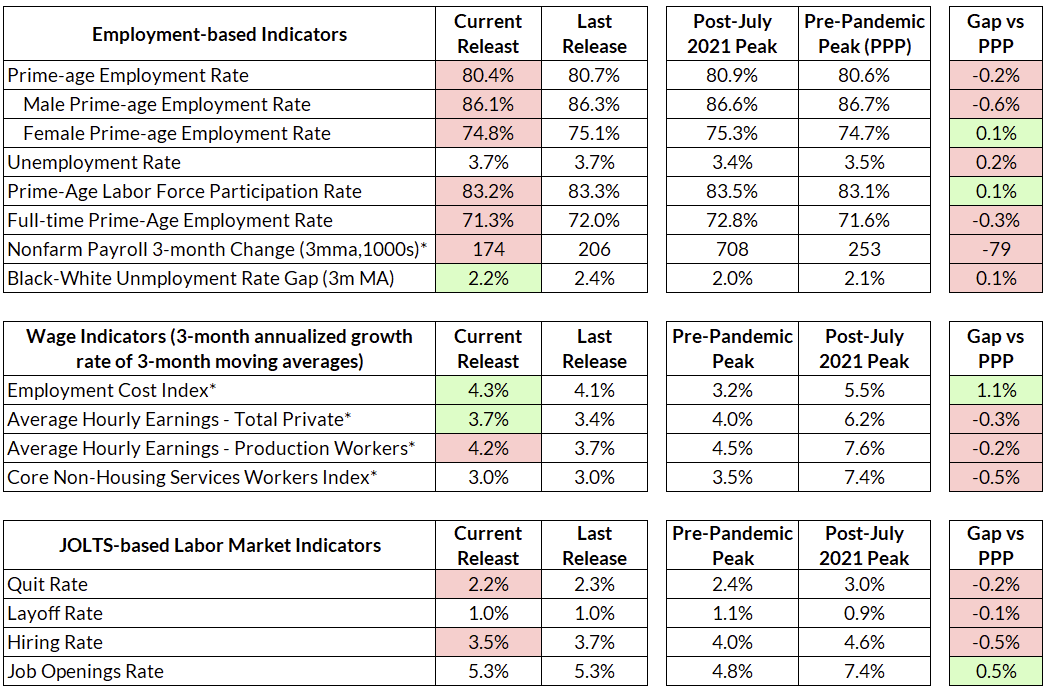
The headline unemployment rate remained at 3.7%, and the establishment survey showed 216,000 jobs added in December, with downwards revisions of 45,000 and 26,000 to October and November. Despite the headline strength, the employment numbers in the household survey are less optimistic: both employment and participation deteriorated. Prime-age employment rates fell further to 80.4% from 80.7%, a full 0.5pp below its post-pandemic peak of 80.9%. Labor force participation fell to 62.5% from 62.8%, but primarily driven by older workers; prime-age labor force participation fell to 83.2% from 83.3%. Wage growth continued its upwards trend, with average hourly earnings growth for overall private workers growing at 5.4% annualized. Both quits and hires were down in November, with hires now at 2015 levels. Between the household survey and the establishment survey, we’re putting more weight on the household survey this month—initial response rates in the establishment survey were a mere 49.4%, tied for its lowest level since 1991 (the average response rate in 2022 was 65.5%).
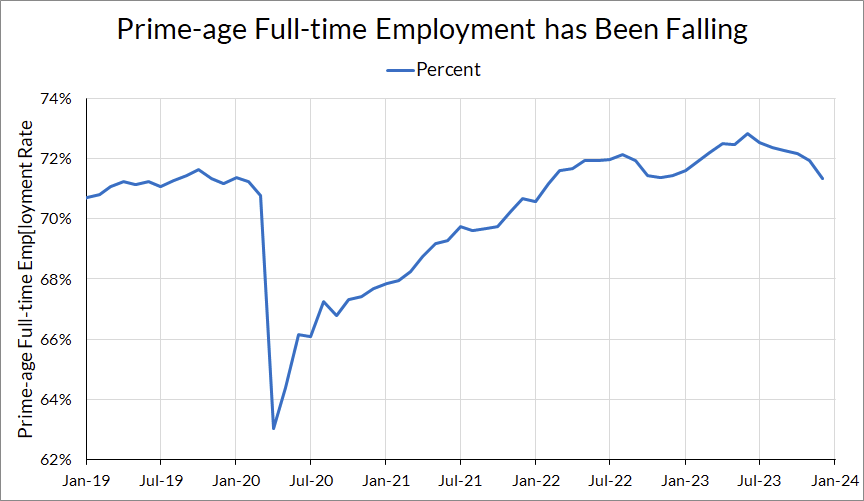
The most concerning development in the December jobs data is the deterioration in our most preferred indicator, prime-age employment. While we enjoyed most of 2023 above the January 2020 peak of 80.6%, we are once again below that peak.
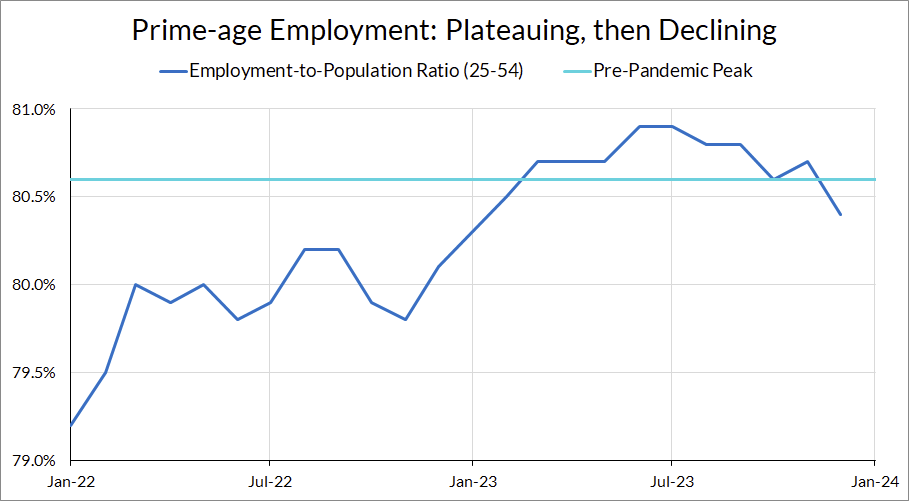
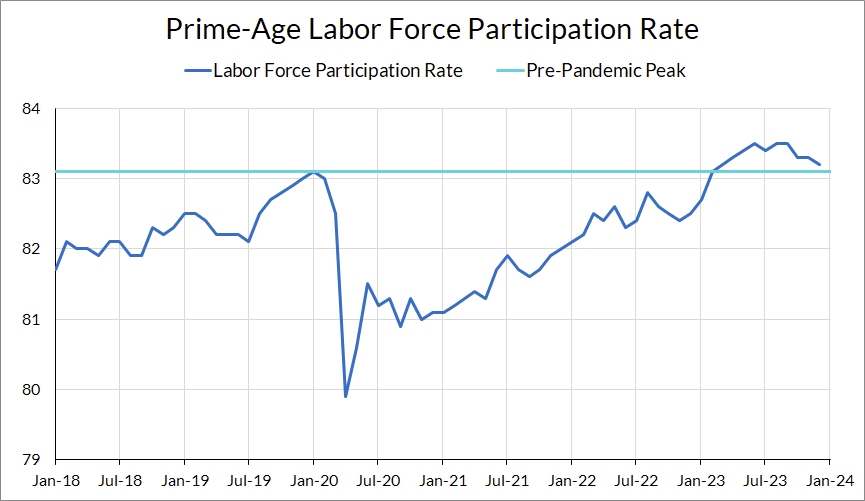
The action in the deterioration over the past few months has mostly been focused on the movements between employment and participation; both overall and prime-age unemployment rates are pretty steady throughout this period. Participation, however, has been sliding:
Turning to the flows data, we see this in the decline in flows from non-participation to employment, signaling a deterioration that is coming from a decline in hiring, particularly from workers who are more marginally attached to the workforce (we also saw this with the JOLTS data for November, which saw a decrease in hiring without an increase in layoffs).
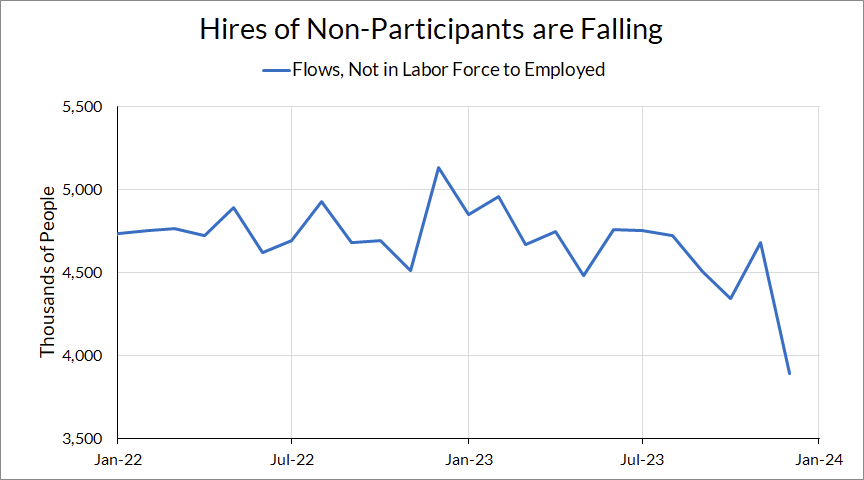
One of the reasons why we have celebrated the post-pandemic labor market recovery was that the tight labor market drew in workers on the margin. That increase in participation is one thing that Powell has acknowledged as one reason why unemployment has been able to remain low in 2023. However, it looks like we may be seeing some give-back in that part of the recovery.
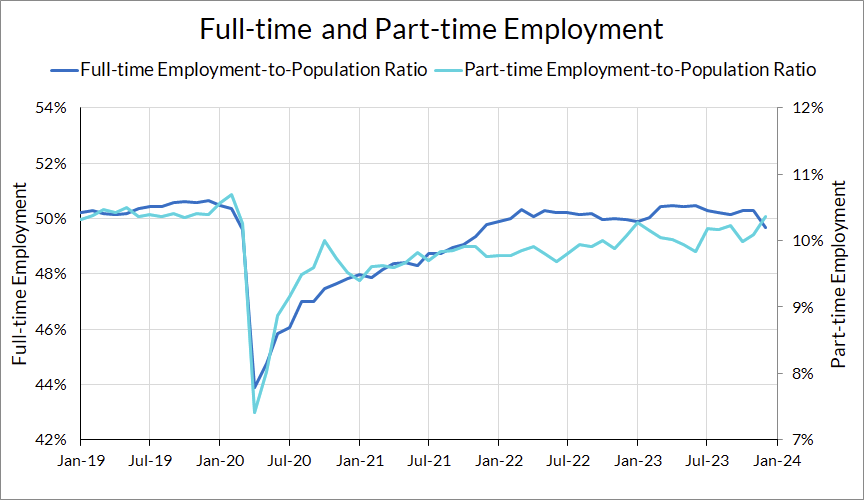
We also see the weakness in the full-time employment numbers. Full-time employment dipped below 50% in December, and is now at its lowest level in two years. We see this decline not just in the overall full-time employment figure, but the prime-age full-time employment figure as well.
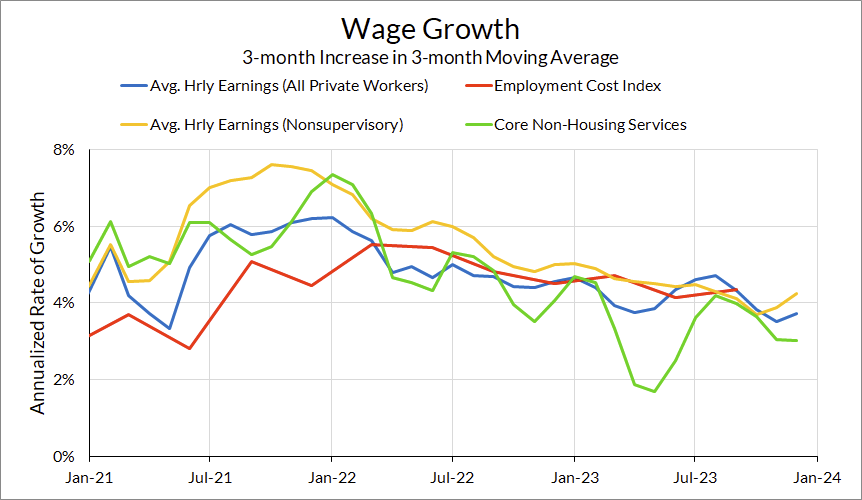
The hottest signal in the employment report is a local surge in average hourly earnings. While the longer trend shows a slow and steady decrease in wage growth, the last few months have shown stronger average hourly earnings prints. Average hourly earnings grew 5.4% and 4.3% annualized in November and December; earnings for production workers have grew faster than 4% for three months.
Some, including at the Fed, may see this wage growth as a sign of concern. But there are a number of reasons why this should be discounted. The first is the low response rate in the establishment survey—there’s a distinct possibility that this number gets revised over the next few months (and we’ll have ECI numbers the morning of the next Fed press conference).
The second is that wage growth is slowest in the area where the Fed claims to be most concerned about cost-push inflation from labor costs: wages in the core non-housing services sector has been growing slower than overall wages for all of 2023.
The third—and we will have more on this in the near future—is that if employment is stagnating, then employment growth needs to hand-off to wage growth if gross labor income (and consumer demand) is to stay robust. And under the Fed’s wage-productivity framework, this is perfectly consistent with low inflation if we see strong productivity growth.The late 90’s is an example of this phenomenon:

Robust productivity growth isn’t out of the question. Not only have we already seen a spate of robust productivity, but workers have moved up the job ladder during the recovery. This involved a lot of churn, but now that workers are settling into their jobs and quit rates are falling, we may start to see a pickup in productivity after some “time-to-train” effects.
This report was a little noisy, and it’s hard to know how much weight to put on the establishment survey given the low response rate. But on balance—especially when one takes the trends over the past six months in employment—the data is showing more downside labor market risk than previously
As always, I’ll come back to the “balance of risks” for the Fed. A lot has changed in that balance in the last month, and it’s not just the stunning drop in core PCE inflation. While the committee will likely primarily be concerned with the next few inflation prints, we think that preempting unemployment risks should be a strong impetus for moving towards rate normalization sooner rather than later.