Labor Market Recap June 2023: Despite Headline Miss, the Labor Market is Strong

The data from the June labor market shows continued strength in the labor market, with strong employment and wage growth.
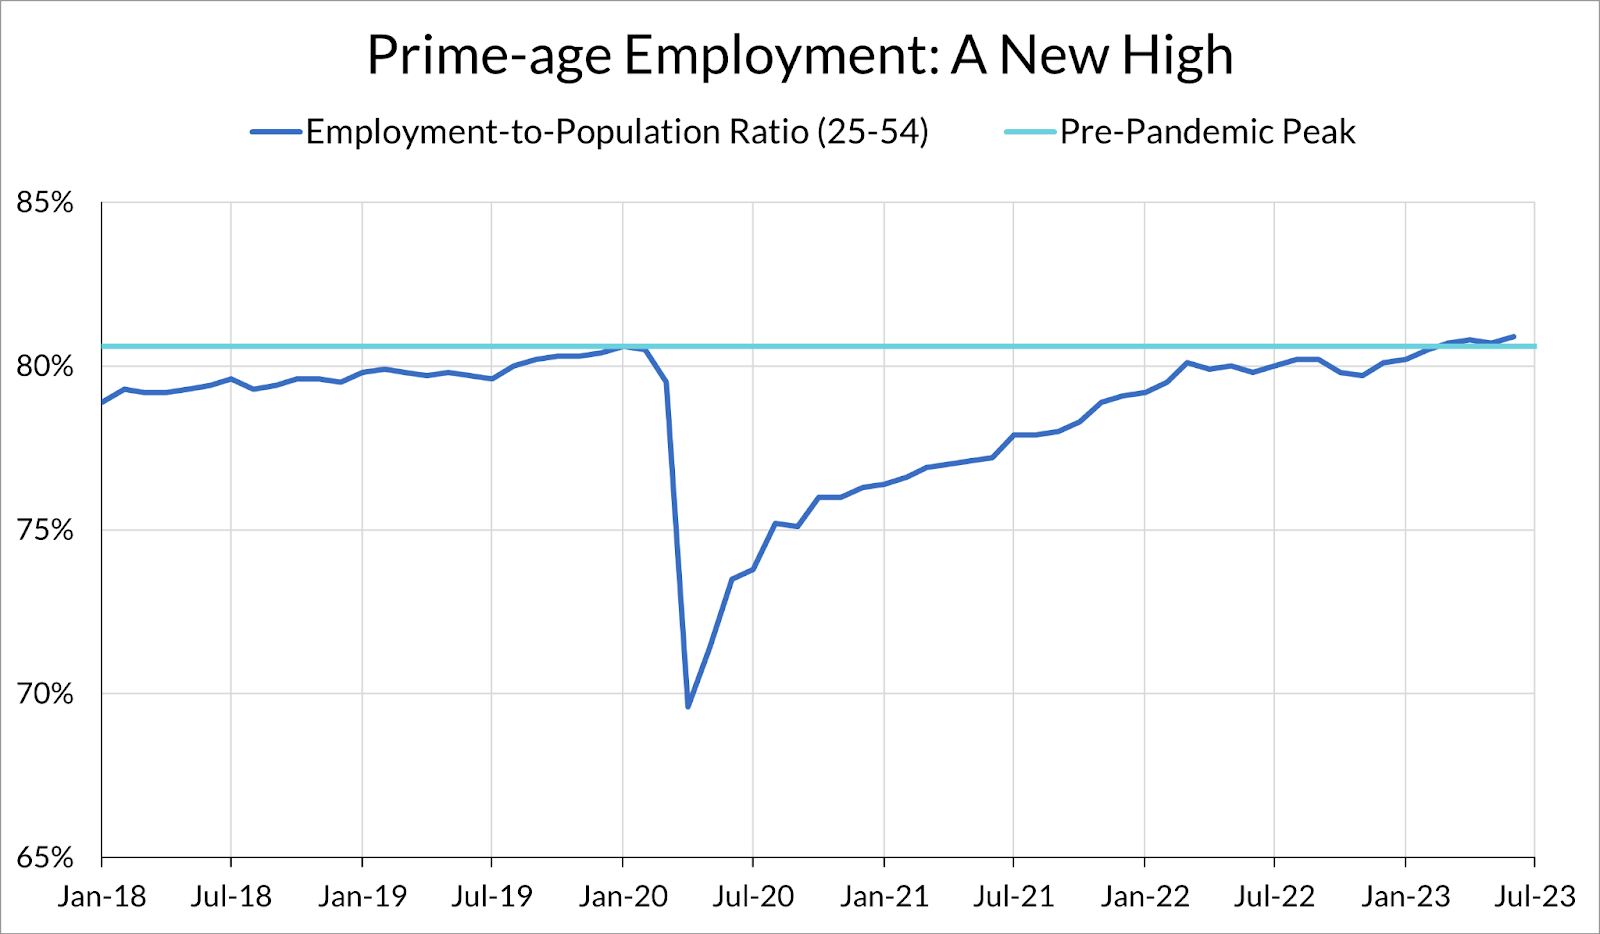
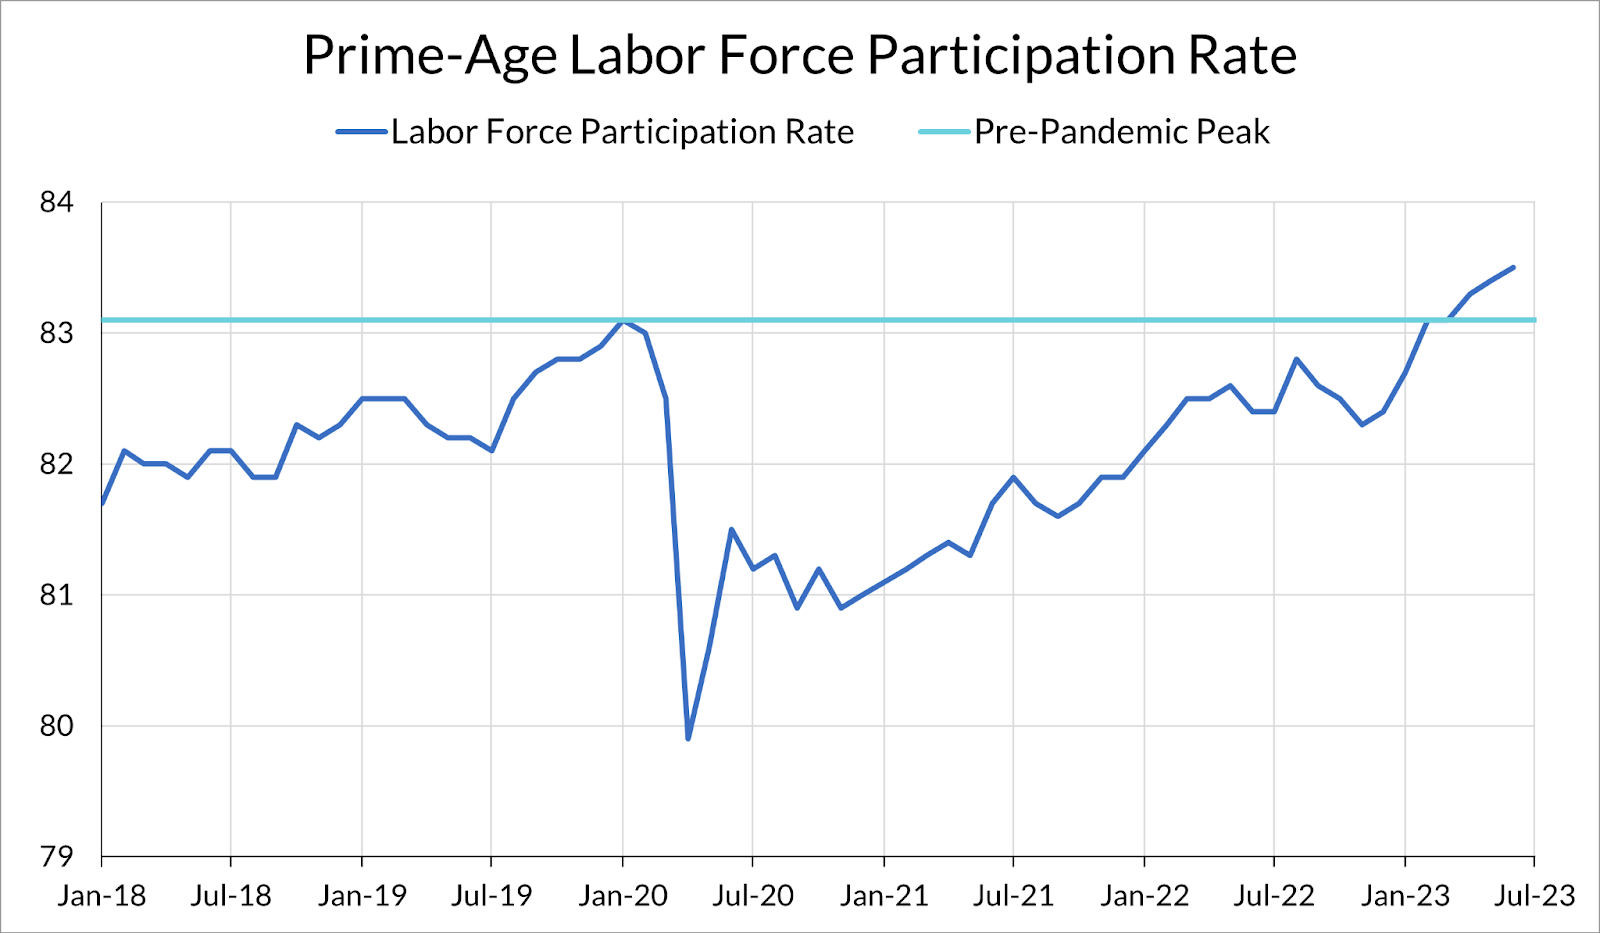
The headline unemployment number fell to 3.6% from 3.7% and the establishment survey showed a solid 209,000 jobs added in June, consistent with our preview. While below consensus expectations, this is still another solid jobs report, as further details in the household survey confirm. The prime-age employment rate increased to 80.9% from 80.7%, prime-age labor force participation continued to rise to 83.5% from 83.4%, another high.
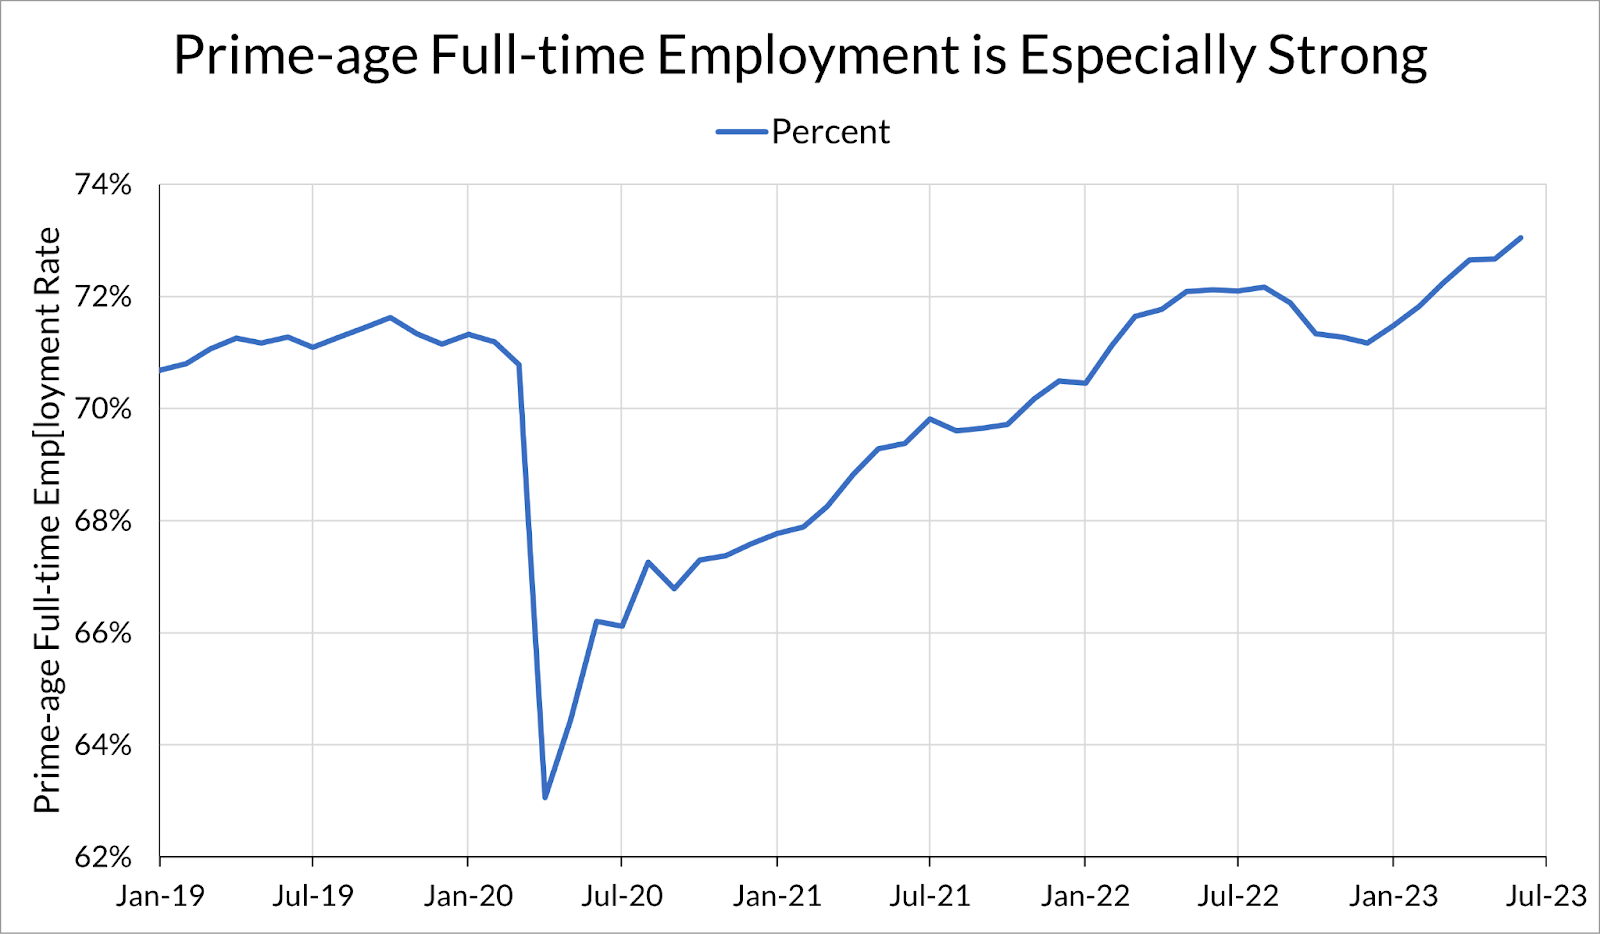
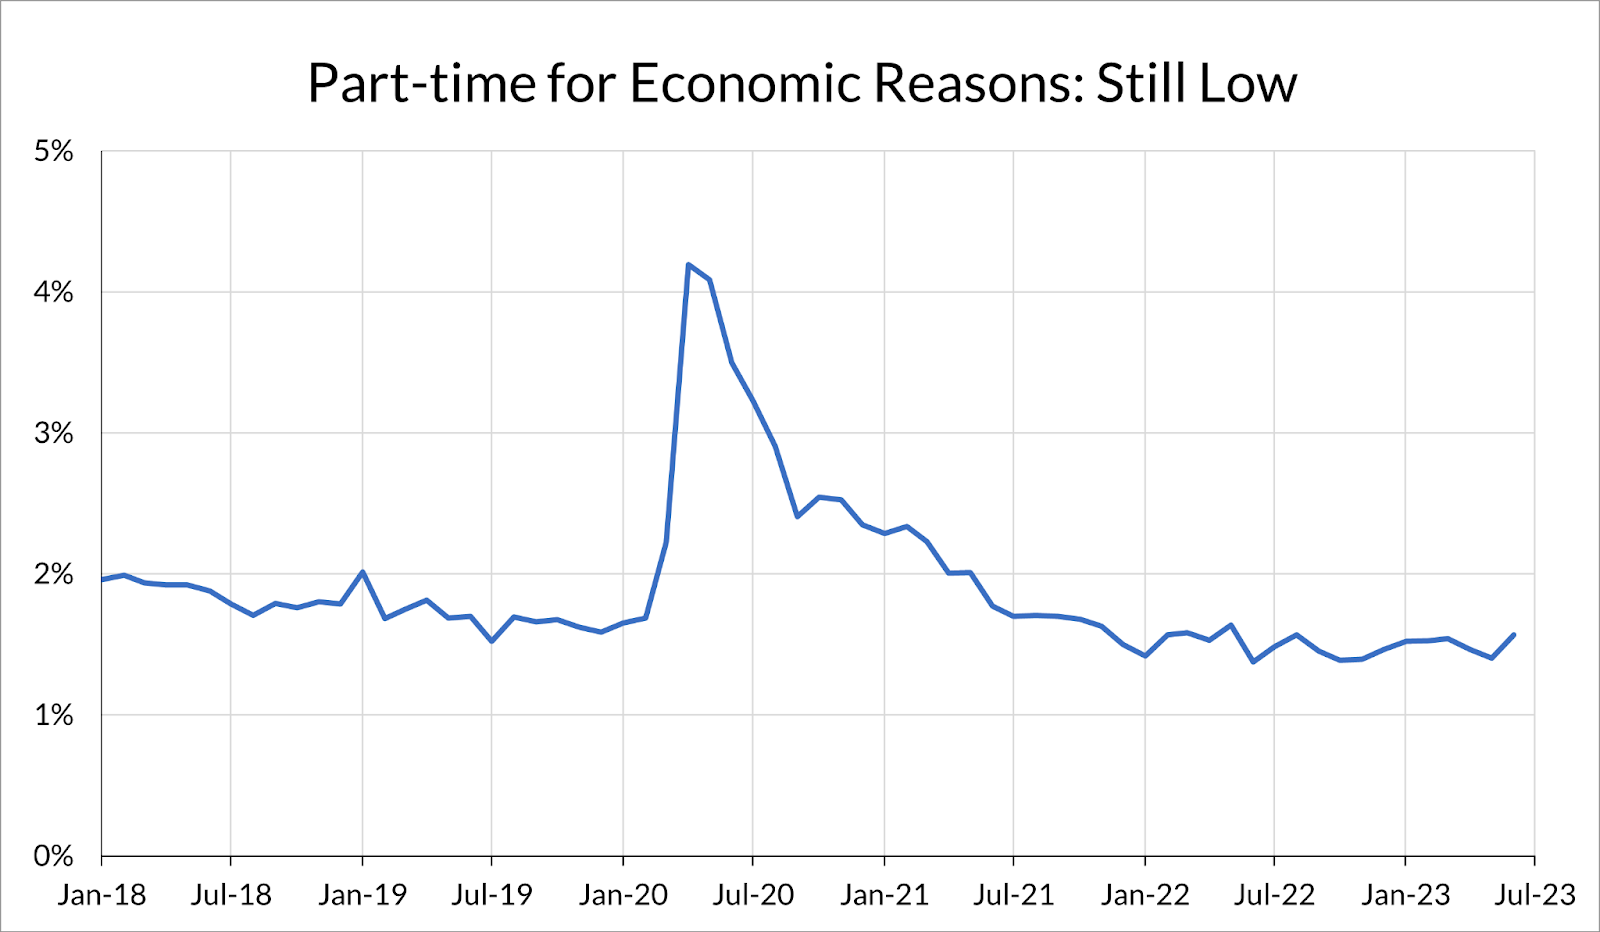
If one looks into the details of the household survey, the overall picture of a strong labor market is confirmed. Prime-age full-time employment increased to 73.1% from 72.7%. Short-term unemployment — a proxy for recent layoffs — remains low, as does part-time employment for economic reasons. If there is one thing to worry about in this jobs report, it is the rapid increase in black unemployment, with the caveat that that is a noisy series (due to sample sizes in the Current Population Survey).
Wage growth surprised to the upside this month, with average hourly earnings increasing at a 4.3% annualized rate. While we don’t think that this is necessarily a problem for inflation, the Fed will likely disagree. This development, along with the recent GDP release showing (on its face) lower profits and an elevated labor share, will deepen worries about wage-driven inflation. However, a more careful measurement of the labor share shows that labor’s share is not historically elevated.
As we wrote earlier this week, this was a low-stakes report when it comes to Fed policy. After all, a rise in unemployment would be consistent with their projections for the end of this year, and a strong jobs report this month further solidifies the rate hike signaled for the next meeting. They will be more concerned with the CPI and PPI data that will be released next week.
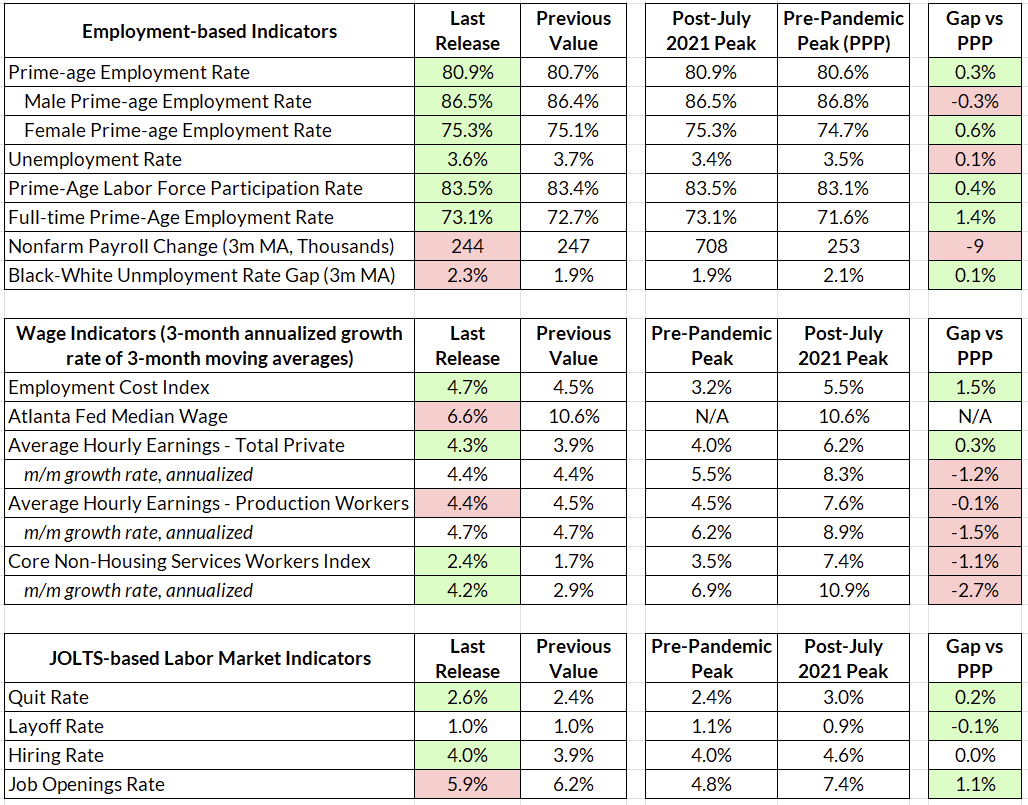
If we’re starting to sound like a broken record, it’s because month after month the labor market continues to send the same message: there’s no recession here, and employment is strong. Prime-age employment makes another high, and continues to climb above its pre-pandemic peak.
This increase was primarily driven by an increase in the labor force participation rate (the prime-age unemployment rate remained steady at 3.1%). As we’ve written about before, the Fed’s premature call to write off improved labor force participation continues to be proven wrong.
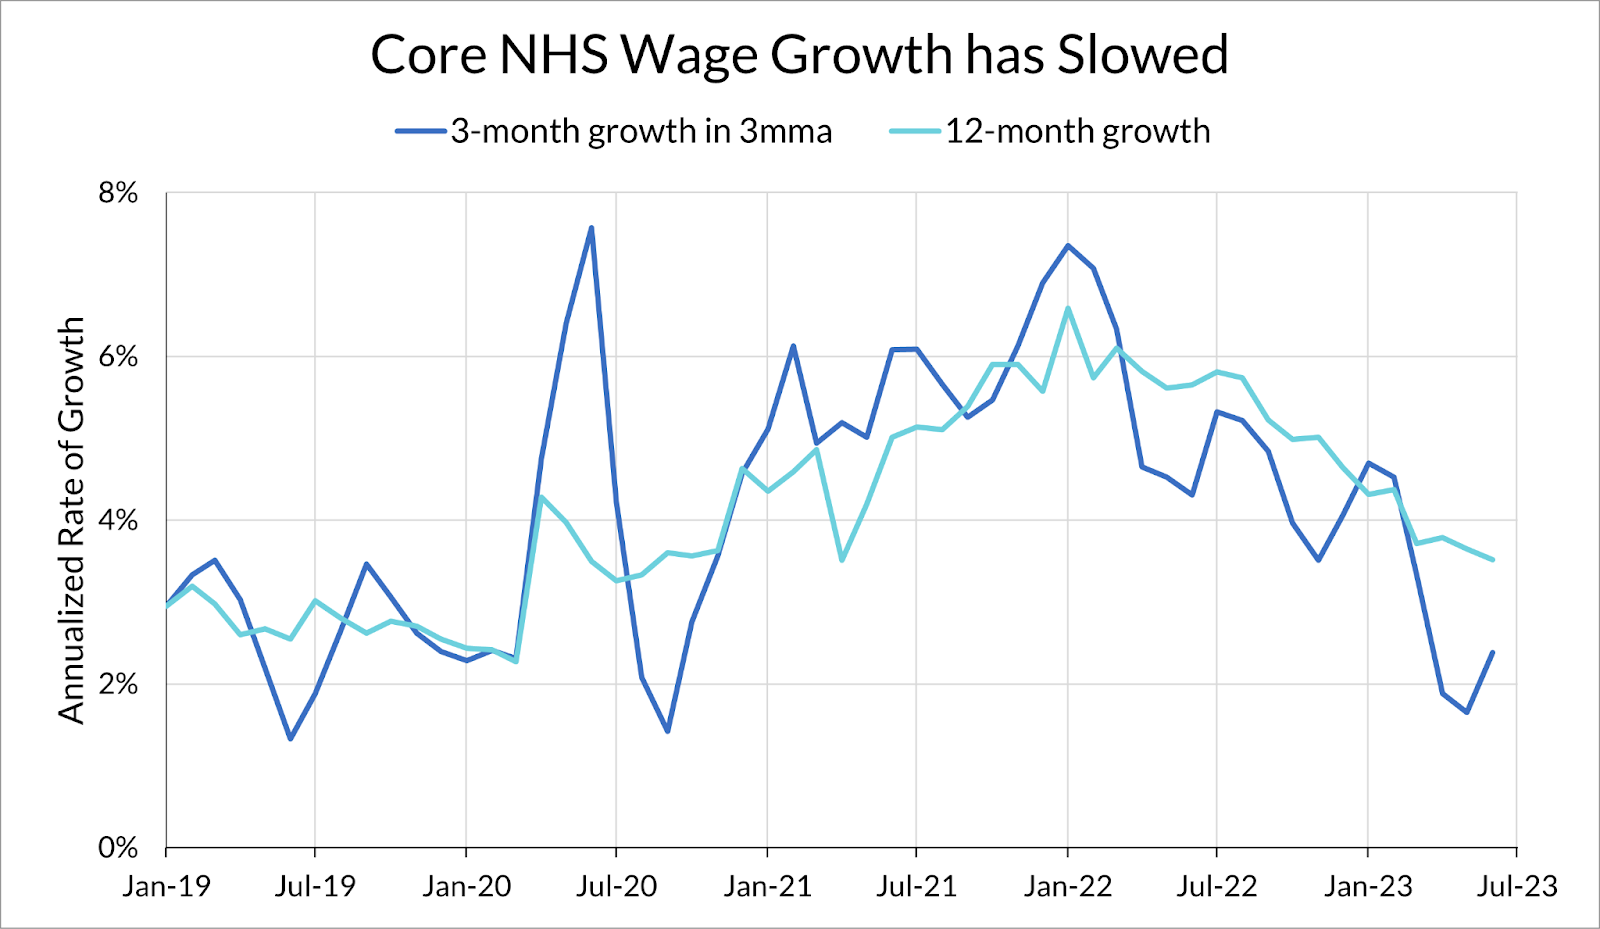
The wage growth numbers were also strong this month, with average hourly earnings increasing at a 4.4% annualized rate. While the strong wage growth will prompt worries about labor cost-driven inflation, it’s important to keep in mind that the general trend of wages over the past year has been towards deceleration, especially in the core non-housing services sector the Fed is concerned about. Unfortunately, the next ECI release will happen after next FOMC meeting.

The increase in full-time employment rates earlier this year continues to hold strong, with full-time employment rates above 2019 levels. The improvement in full-time employment rates appears to be especially concentrated in prime-age workers.

While the share of part-time workers who are part-time for economic reasons series ticked up this month, it’s still at historic lows:
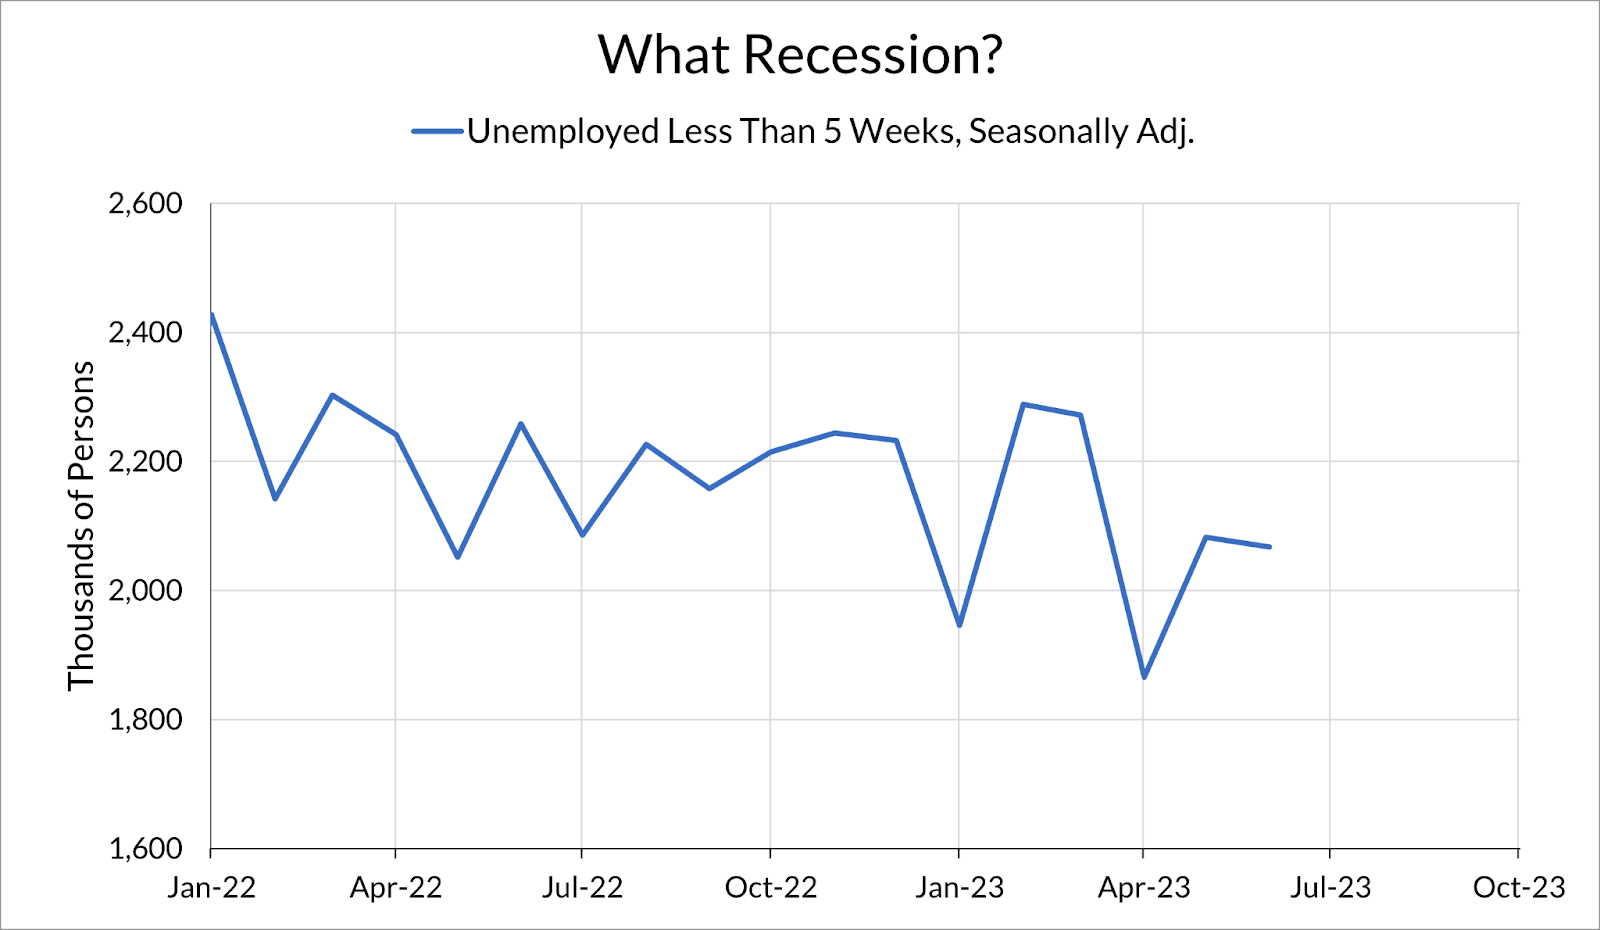
And the number of unemployed workers reporting an unemployment duration of less than five weeks appears to be, if anything, on a slight noisy downward trend. Since this is a measure of recently unemployed, it is a household proxy for recently laid-off workers. It appears that the wave of white-collar layoffs we flagged earlier this year has abated and remained contained.
One dark mark in this jobs report continues to be the worsening discrepancy between black and white workers. The black-white unemployment gap continued to rise this month, and has increased by over a percentage point in the last two months.

The black unemployment rate is now 6.0%, up from 4.7% in April. To be clear, 6.0% is still historically low (the 2019 average was 6.1%) and this is a relatively noisy series. However, it is disappointing that the labor market has lost all of the improvements in black unemployment made over the last year, and further deterioration in this series should be worrying.
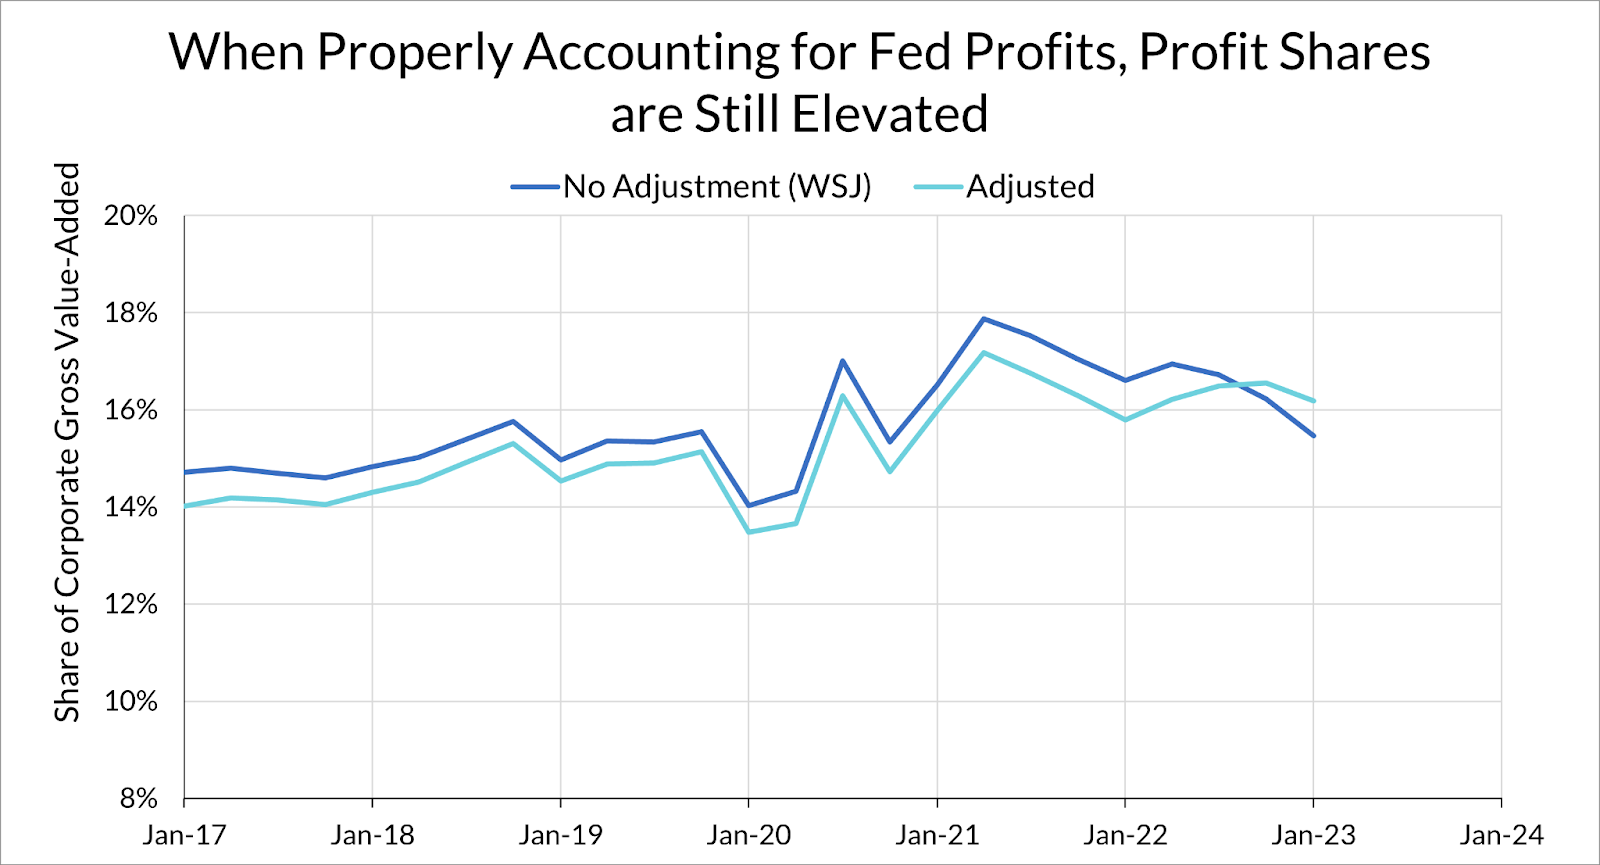
Yesterday, Greg Ip at the Wall Street Journal argued that due to a fall in corporate profit shares and a commensurate rise in the labor share, “greedflation” may be giving way to “wageflation” as the labor share and unit labor costs rise. I also happened to publish a piece that day showing that arguments about inflation that use the unit labor cost measure are deeply misguided due to the fact that unit labor costs are constructed using price data, and that the labor share has a tenuous empirical relationship with inflation.
There is another problem with this narrative: when measured more carefully, it is not clear at all that the profit share is falling and the labor share is rising. The Journal’s piece measures the profit share by dividing pre-tax corporate profits, adjusted for inventory valuation and capital consumption, by the gross value-added of corporate businesses. They measure the labor share by dividing the wages and salaries of employees by gross corporate value-added (these are all available in NIPA Table 1.14).
The problem here is that corporate profits and value-added include the profits of Federal Reserve Banks. Since the Fed’s balance sheet contains so many long-term assets, the rise in interest rates has led to a sizable loss on the Fed’s balance sheet. However, regardless of whether one believes in a theory of either wage-driven inflation or profit-driven inflation, this doesn’t represent anything that actually has to do with either labor market conditions or corporate profiteering. Since Federal Reserve Bank profits are included in both corporate profits and corporate value-added, the decline in Federal Reserve Bank profits spuriously decreases the profit margin and increases the labor share.
Below, I plot the aggregate corporate profit margin with and without netting out Federal Reserve Bank profits. While the unadjusted data makes it look like profit margins peaked in 2021 and have been falling ever since, the measure that properly nets out Federal Reserve Bank profits shows that profit margins are still above their 2015-2019 levels.
Similarly, making these adjustments for the labor share show that the labor share hasn’t much recovered its share. Below I plot three measures of the labor share. The first is the method used by the Journal, which is wages and salaries divided by gross value-added in domestic corporations. The second removes Federal Reserve Bank profits from value-added, and the third additionally uses total compensation instead of just wages and salaries. The adjusted series shows that the labor share is lower, not higher, than in 2021, and around pre-pandemic levels. The measure using compensation is even lower, since wages and salaries have grown faster than compensation since 2020.

Regardless of the recent trends in aggregate labor and profit shares, it’s not clear that this kind of exercise with the aggregate tells us much about the causes or future of inflation. As I explained previously, the empirical evidence that labor shares have an intuitive relationship with inflation is tenuous empirical and there are theoretical problems with using aggregate compensation growth vs. “productivity growth” to reason about marginal labor costs.
As we said in our preview, this probably doesn’t change much for Fed policy. The labor market continues to outperform the Fed’s expectations, so any move to hold interest rates again will only come from an exceptionally soft inflation print next month. I see no reason not to simply reiterate what I wrote last month:
Over the past few months, the labor market has been on a slow trajectory to what looks a lot like the labor market in 2019 after a spurt of labor market churn, sectoral reallocation, and wage growth concentrated at the low-end. All of those trends appear to be renormalizing back to pre-pandemic levels, but additional Fed tightening would risk giving back some of the gains we saw during this recovery.