White-Collar Layoffs are Starting to Show Up in the Household Survey

In our labor market recap for March 2023, I described the state of the labor market as “a goldilocks labor market, with strong employment, increasing labor supply, and sustainable levels of wage growth.” However, there is at least one cloud in an otherwise clear sky: the number of unemployed permanent job losers has increased substantially over the past few months. This development shows how downside employment risks have now grown and deserve heightened consideration by the Fed and other policymakers.
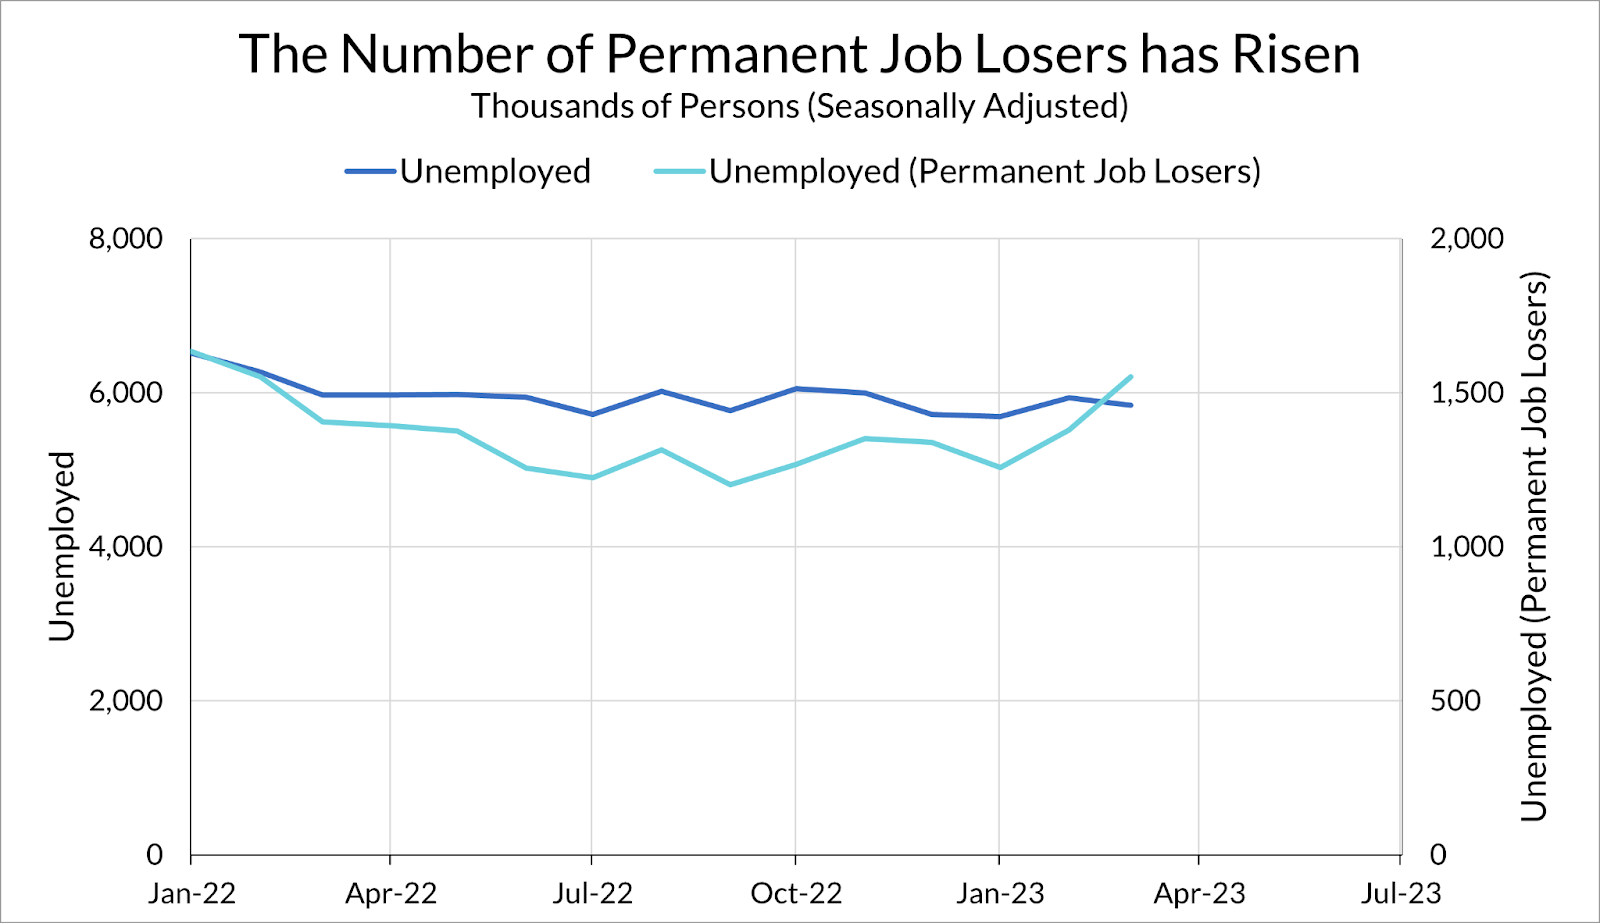
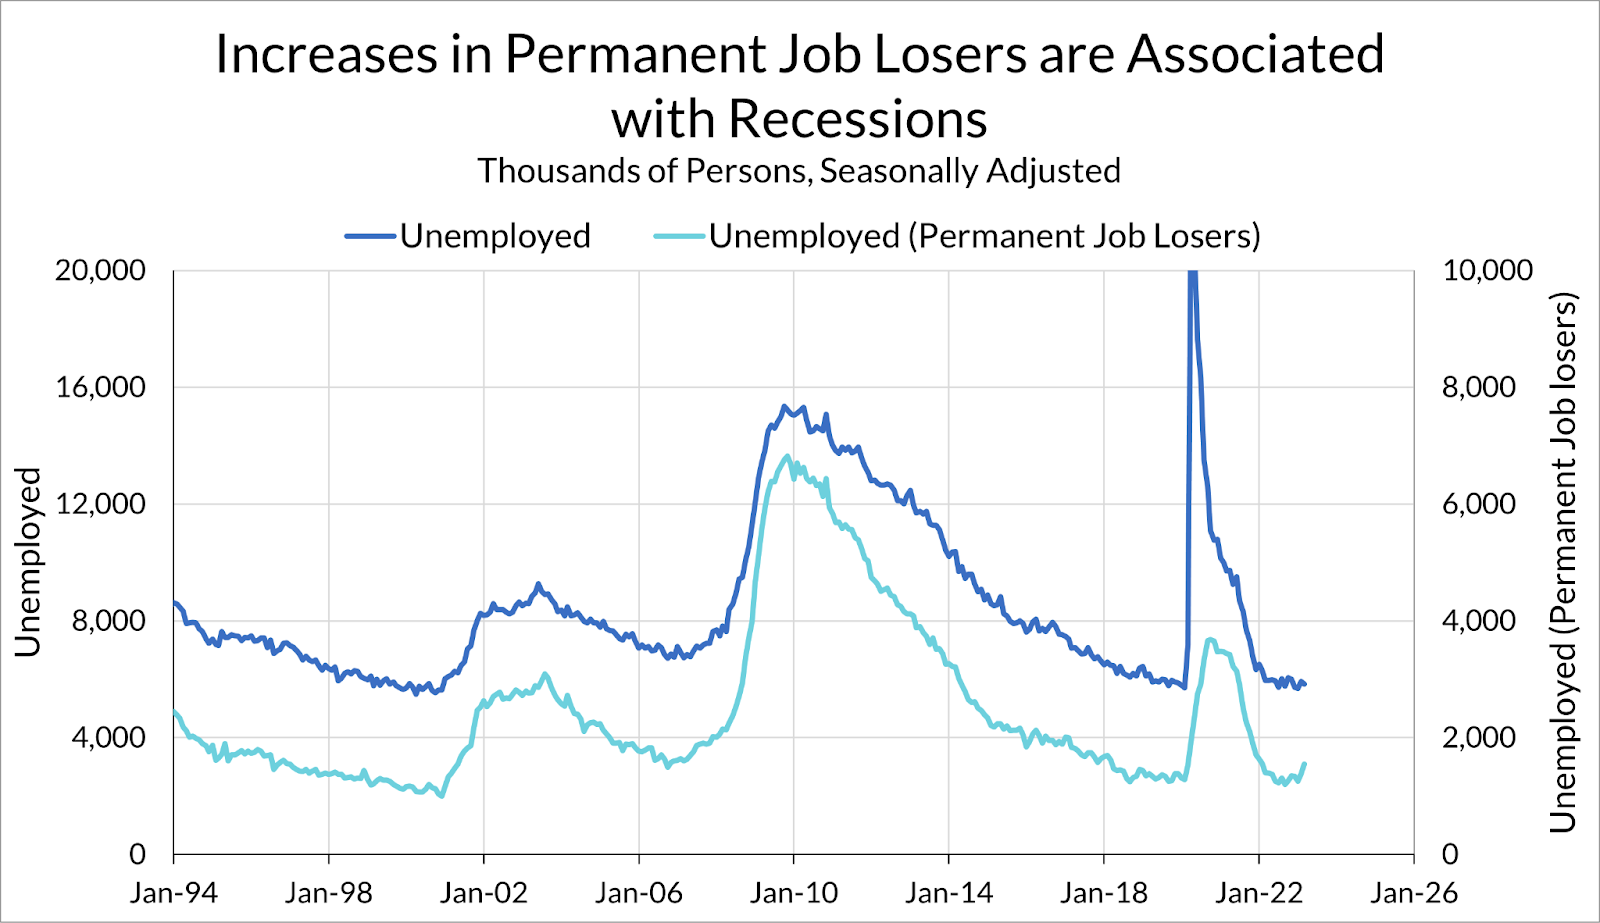
The number of permanent job losers has increased by 23% since January, from 1.26 million to 1.55 million persons. This data series has been around for only three recessions, so it doesn’t have that long of a track record, but in the admittedly short history of this series, an increase of this magnitude has only been seen during the onset of recessions.
To be clear: I am not arguing that this bump in permanent job losers means we definitely are, or are going to, enter a recession. The overall labor market is still strong, even as hiring cools off and wages slow. However, if one is sensitive to downside risks in the labor market (as we are, and as the Fed should be), this is the first signal that the labor market might be breaking, not slowing. It should, at the margin, shift the Fed’s perceptions of the balance of risks from inflation towards unemployment.
Data on unemployment by reason come from the Current Population Survey. Unemployed persons are categorized into:
The first category, job losers, are split into those on temporary layoff, those who ended temporary jobs, and others. Those others are categorized as “permanent job losers.”
While the CPS is a relatively large survey, covering around 100,000 individuals a month, it is important to remember that the sample of unemployed workers is relatively small. In March 2023, information about unemployed workers was derived from the responses of 1,619 surveyed workers. Of those respondents, 404 were permanent job losers, about a quarter of all unemployed (by both count and weight). As such, it is difficult to obtain any fine detail on who these permanent job losers are using the CPS, and this analysis should be taken with a grain of salt. However, this is the best and most up-to-date publicly available information on the characteristics of job losers we have.
Like any other category of the labor force, the count of unemployed permanent job losers can rise due to a combination of two reasons: an increase in inflows (in this case, permanent layoffs), or a decrease in outflows (hires or labor force exit).
One way to get a sense of inflows and outflows is by looking at the reported duration of unemployment for permanent job losers. The intuition here is that people who report being unemployed for less than five weeks have become unemployed within the last month, while changes in the total unemployment level are reflective of outflows (for more details on this calculation, see Elsby, Michaels and Solon (2009)).
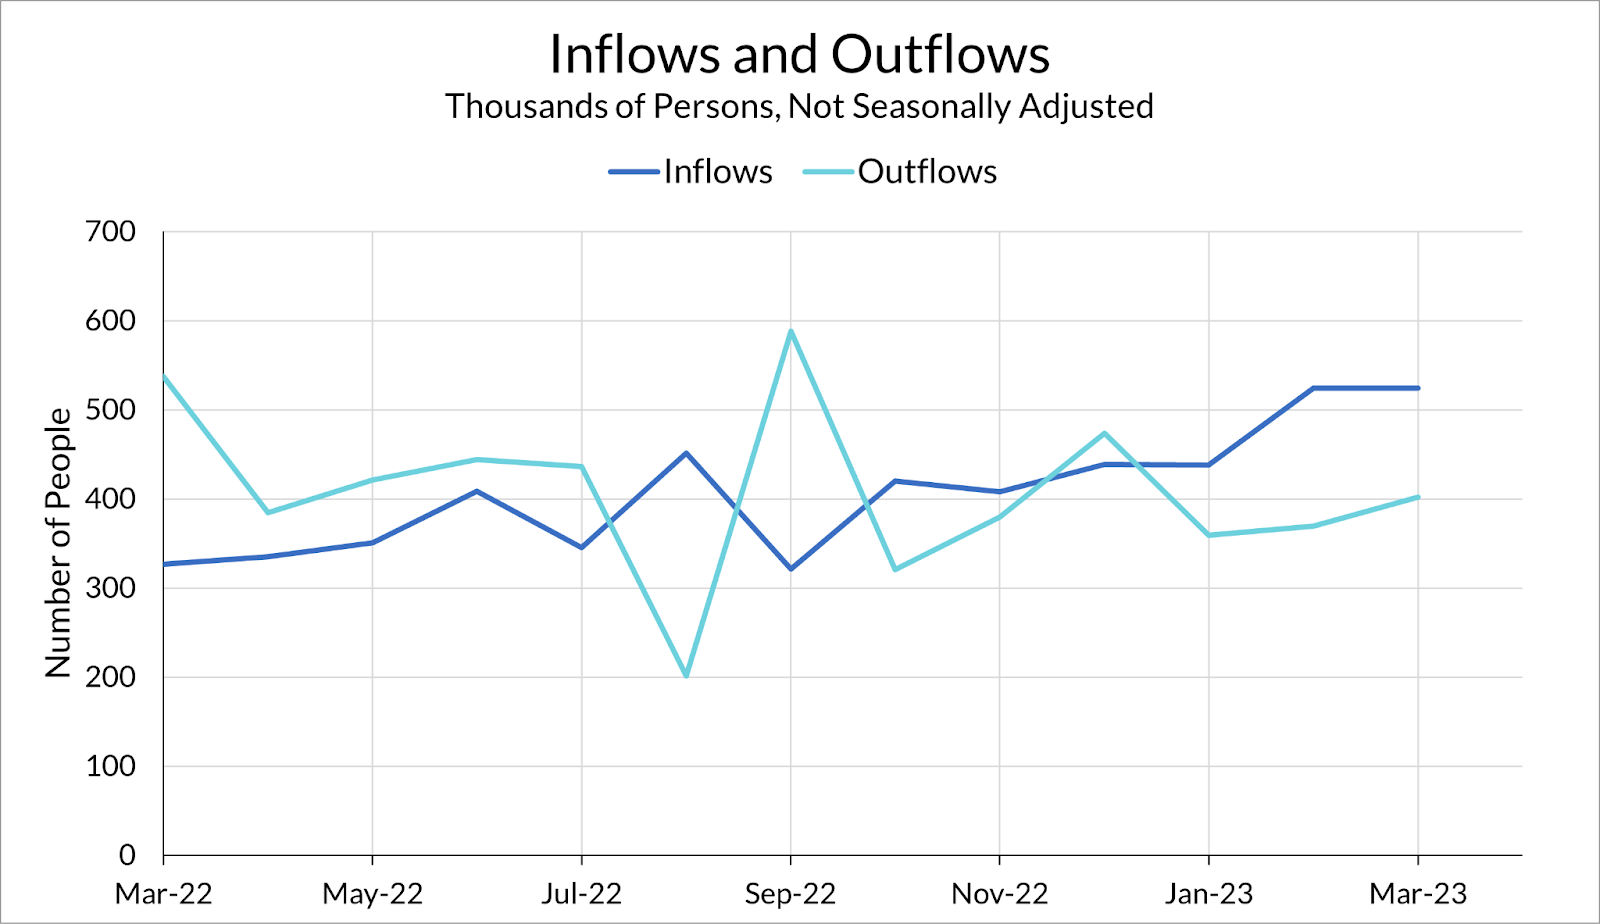
While outflows from this group are at similar levels to a year ago, inflows have steadily increased over the past year. This suggests that layoffs have increased modestly over the past few months, as we’ve seen in the JOLTS data, even though the unemployment rate hasn’t increased appreciably. This rise, combined with a steady exit rate from unemployment in this group, has resulted in the observed rise in unemployed job losers.
Another way to examine flows is to follow these individuals over time in the CPS. The CPS has a limited ability to follow households over time, since households are interviewed for four months in a row. Given the small sample size of this group, I only look at one-month-ahead changes. The graph below shows the number of unemployed in each month that are observed as employed, unemployed, or out of the labor force next month.
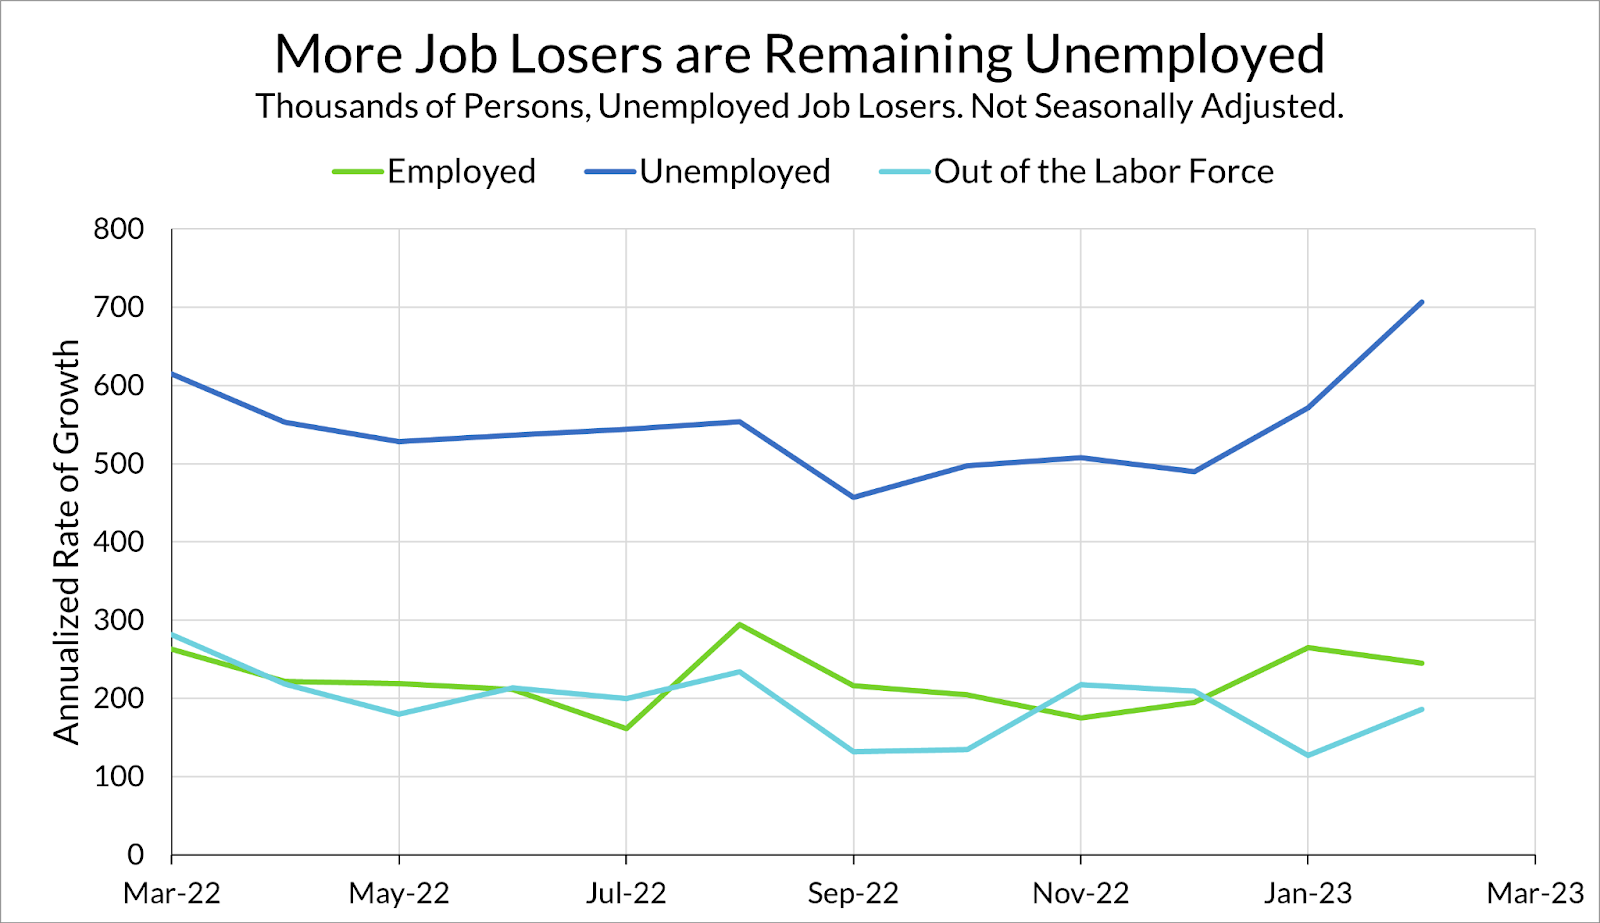
Two things stand out. The first is that since December, there has been a rise in the number of job losers who remain unemployed in the next month. The second is that the number of job losers leaving the labor force or finding employment has remained relatively constant. This means that the rate at which permanent job losers find jobs is falling, even while levels remain steady. Whether this should be interpreted as a sign of a hiring slowdown is a matter of interpretation, but it does appear that hiring has failed to reabsorb these layoffs into new employment relationships.
Much ado has been made about a “white-collar recession” given the wave of high-profile tech layoff headlines. By and large, we haven’t seen a significant effect of these layoffs in the aggregate data. However, if one takes a close look at permanent job losers, there does seem to be a rise in job losers coming from white-collar jobs.
The CPS asks unemployed workers about their industry and occupation at their last place of employment. Since the sample size is relatively small, we can’t glean much information at the level of fine categories, but despite this it does look like a sizeable portion of the rise in job losers is due to white-collar layoffs. Relative to a year ago, white-collar occupations and industries have accounted for a plurality of the increase in unemployed job losers, with construction and manufacturing also contributing to the year-on-year increase.
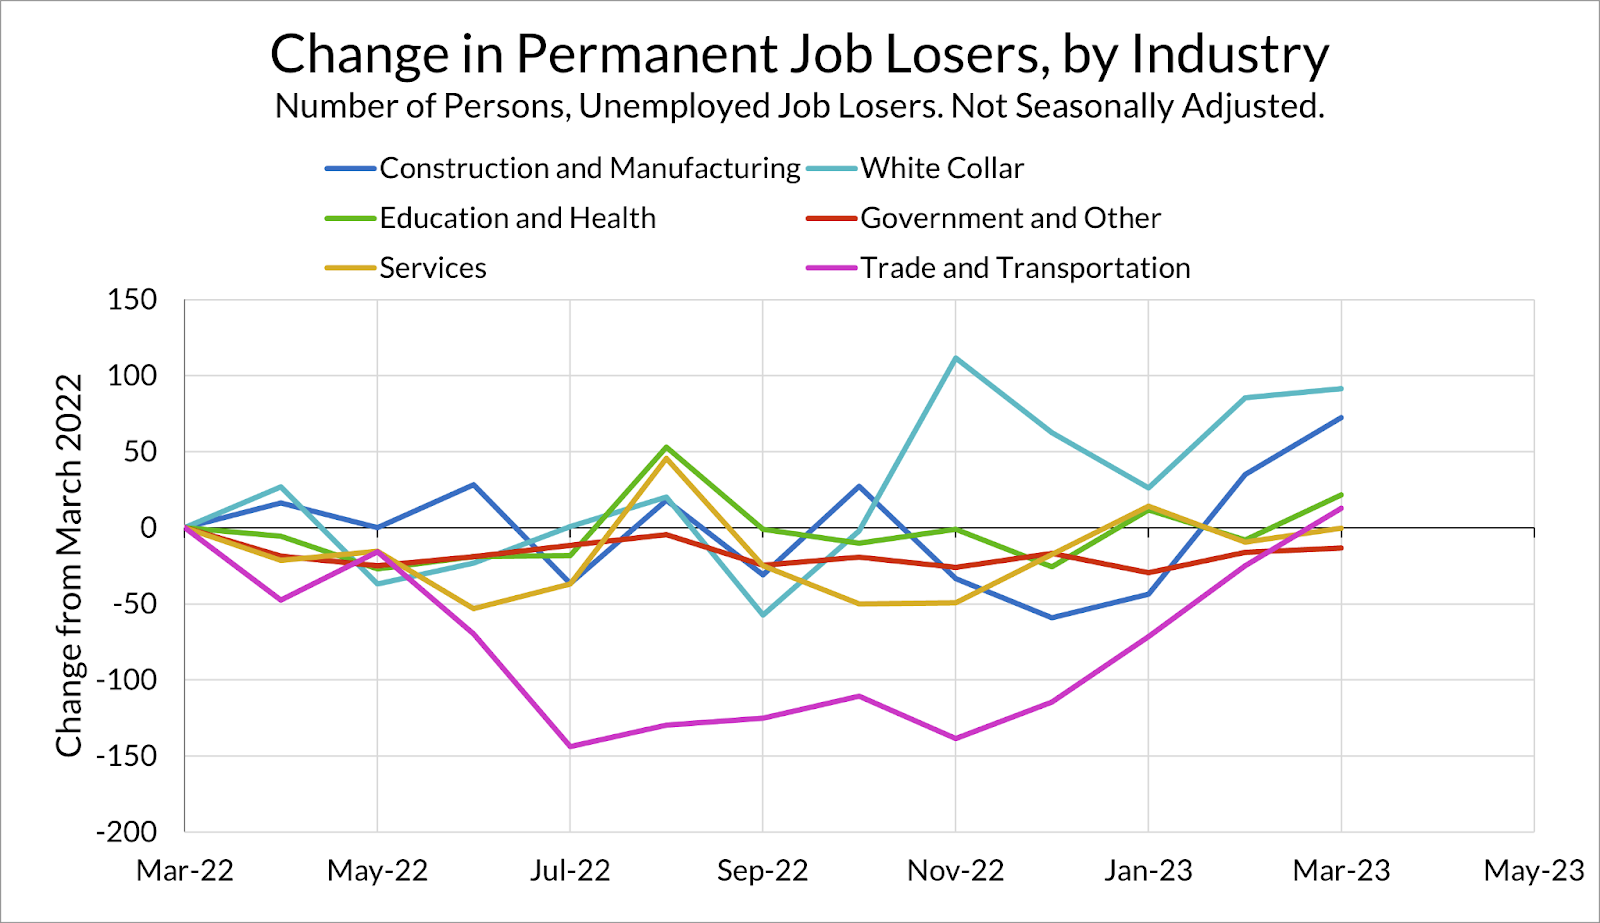
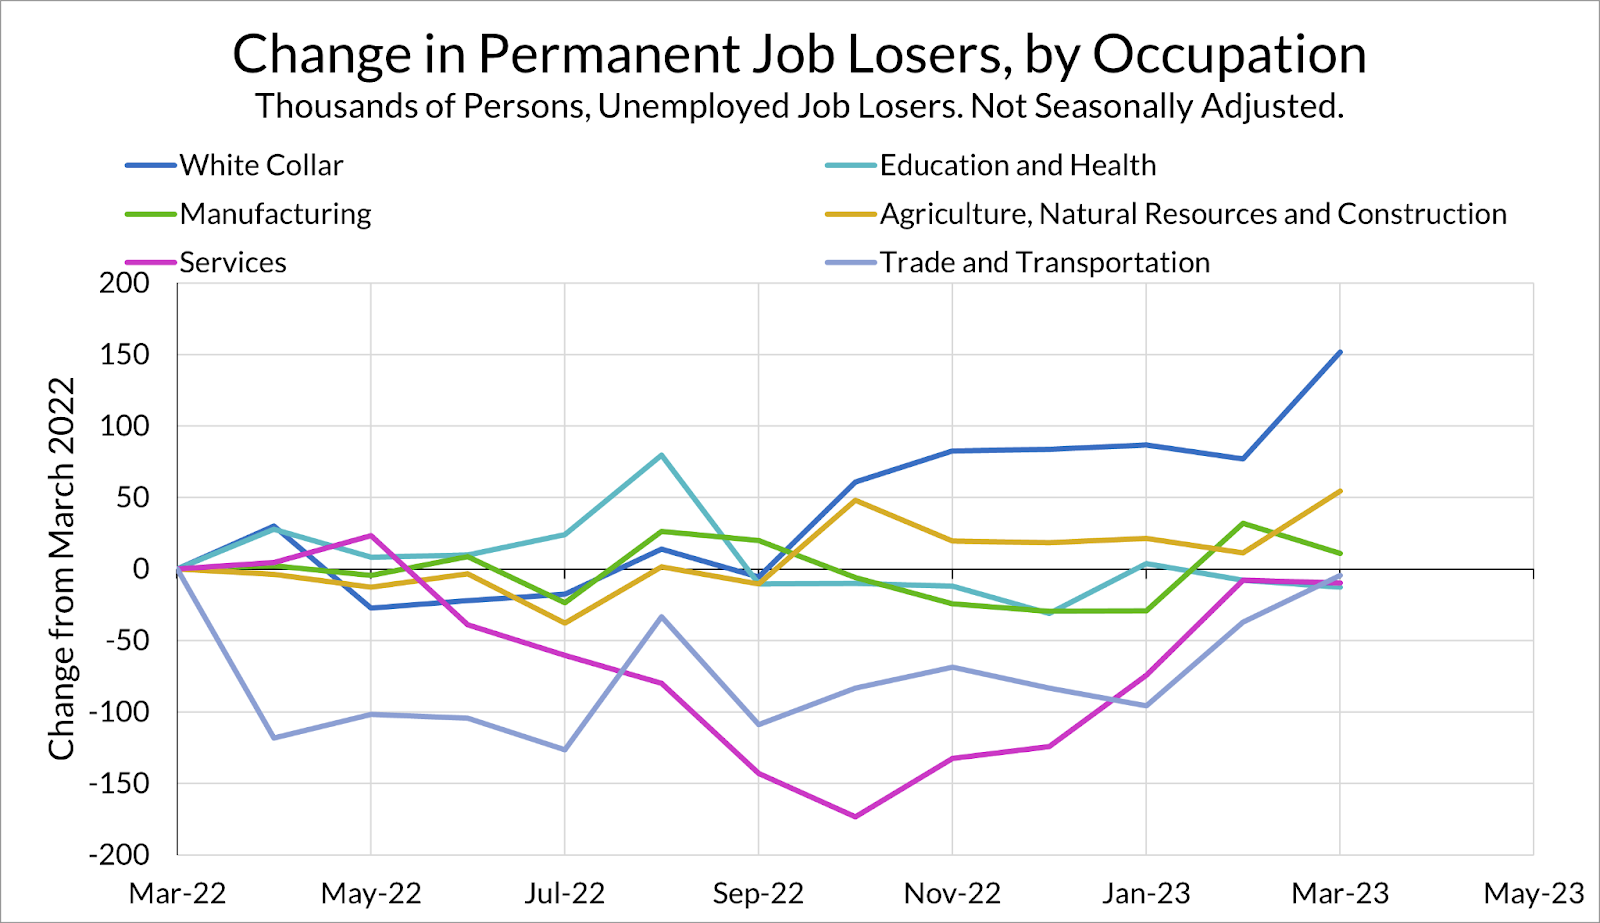
More recently, white-collar jobs have also led an increase in permanent job losers since September 2022. However, job loss in other industries, especially in trade and transportation, have also contributed to the overall increase during that period. This matches with the slowdown in employment growth in that industry reported in the Current Employment Statistics data.
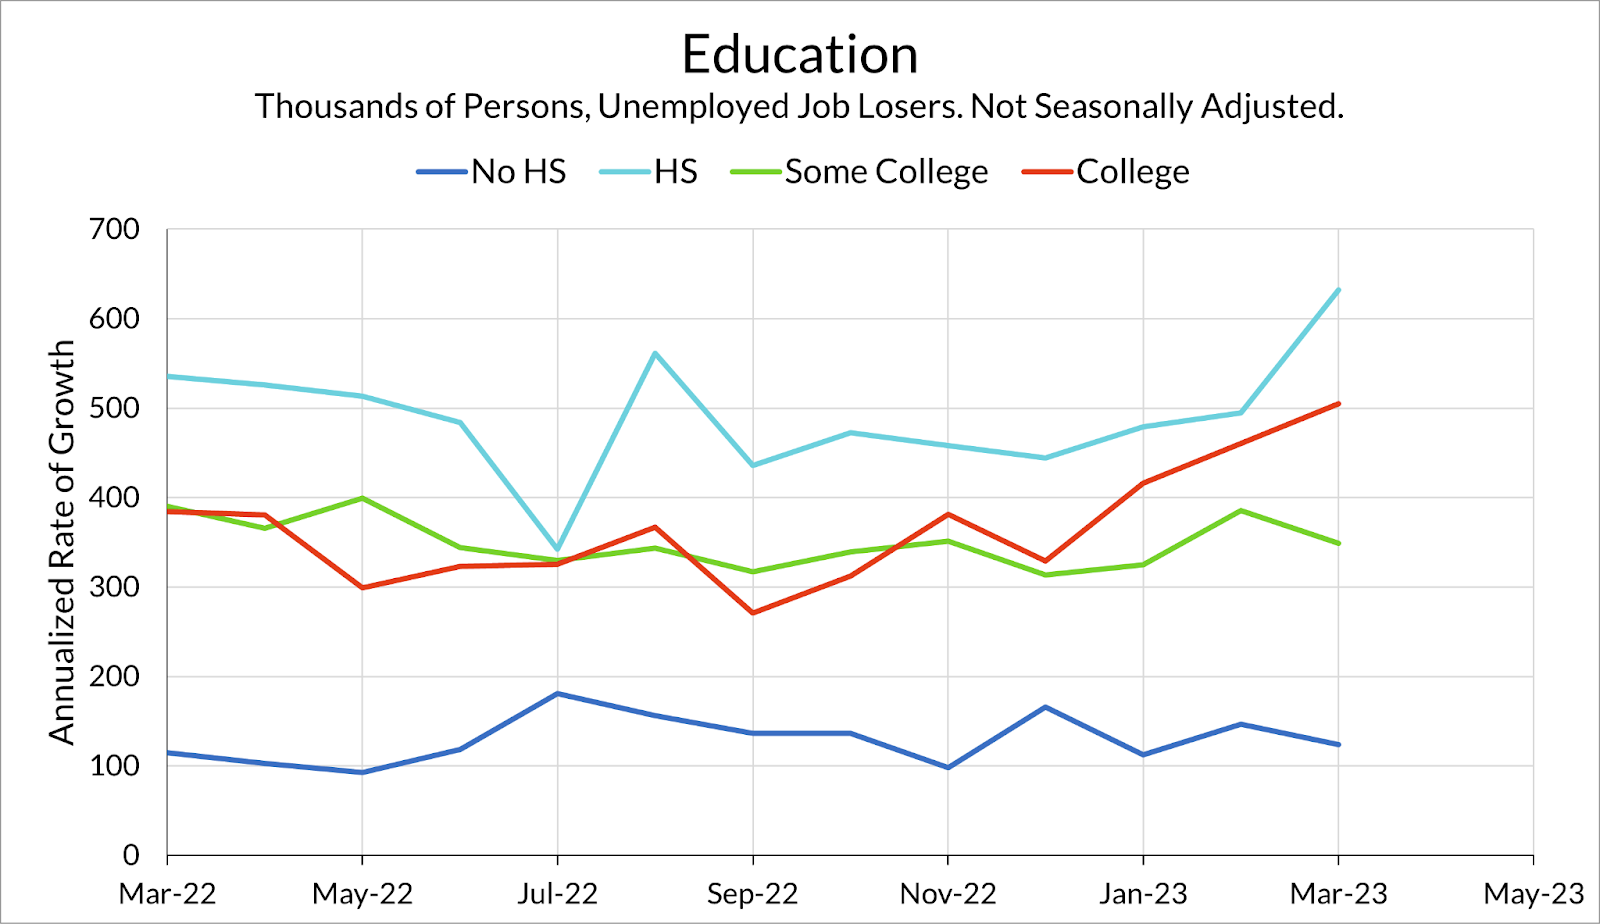
The white-collar layoffs are also apparent in the composition of unemployed job losers by education level, with a steady increase in the number of college-educated workers with permanent job loss. It also appears that there may be an increase in job loss among high school graduates, although much of that increase comes from just the last month of data.
Many, including ourselves, have been looking at the aggregate labor market data and asking: “What layoff recession?” While the aggregate data remains strong, and does not imply a recession either now or in the immediate future, it does look like we are starting to see these layoffs show up if one looks deeper into these more disaggregated groups in the CPS.
Going forward, the question is whether the rise in permanent job loss will continue, and if it will spread beyond white collar jobs and trade and transportation. More broadly, it shows that the downside risks to the labor market may look different this time around. Historically speaking, manufacturing and construction are the industries that suffer the most during labor market downturns. The Fed should be attentive to the possibility that labor market risks may be coming from a different sector this time.