Labor Market Recap January 2023: Disinflation Amidst Labor Market Strength

The data from the January labor market show an unequivocally strong labor market. Nearly every indicator from every data source is showing strong employment against a backdrop of slowing nominal price and wage growth.
Although the consensus anticipated an uptick, the unemployment rate fell to 3.4%, its lowest since 1969 (in line with our preview yesterday). Prime-age employment ticked up to 80.2%, with female prime-age employment regaining its pre-pandemic peak of 74.7%. The establishment survey showed a whopping 517,000 jobs added in January. Despite tech layoffs in the headlines, the aggregate data from multiple sources show no sign of this dynamic impacting the broader labor market.
Meanwhile, the wage data has shown deceleration. The Employment Cost Index release a few days ago showed wage growth at around an 4.0% rate, annualized, during 2022 Q4. Average hourly earnings came in at an annualized growth rate of 3.7% in January (3.0% for production workers), although that figure is subject to strong revisions over the next few months.
Going into this month’s report, there were worries that the new Current Population Survey (CPS) population controls would make the figures difficult to interpret. In fact, the new population controls do not undercut the narrative at all. Applying the new population controls to the December estimates show only a small change to the unemployment, employment, and participation rates. While there might be some flukes with measurement and seasonality, all signs point to a strong labor market.
For months, the Fed has been telling a story that “pain” in the labor market will be necessary to bring down inflation. Recent months have shown decelerating prices and wages amidst a backdrop of a resilient labor market. The Fed should back off from this Phillips Curve-centric view.

As I wrote during my Fed meeting preview earlier this week, the Fed has been operating with a Phillips curve-informed view of the labor market and inflation. This framework can be summed up in three propositions:
The Fed should revise its views based on the last few months of data. The unemployment rate is at a historic low. The prime-age employment rate, while not at a historic high, is at its highest level since COVID began.

Meanwhile, nominal wage growth has been slowing. This month saw upwards revisions to the December AHE numbers, but we have higher-quality Employment Cost Index measures for December that show deceleration from September. Wage growth for nonsupervisory workers came in at a very low 3.0% annualized rate in January, but one should not place much weight on that number given its propensity to be revised (in either direction).

Along with recent disinflationary data from the CPI, we are seeing what many said to be impossible: slowing inflation in prices and wages even as levels of labor market strength remain strong across the board.
As with last month, I am keeping an eye on labor market flows, which are key to understanding the evolution of employment and unemployment. With tech layoffs dominating the headlines, all eyes were on the JOLTS data to see if this would show up in the aggregate economy. The JOLTS data showed only a slight uptick in the layoff rate:
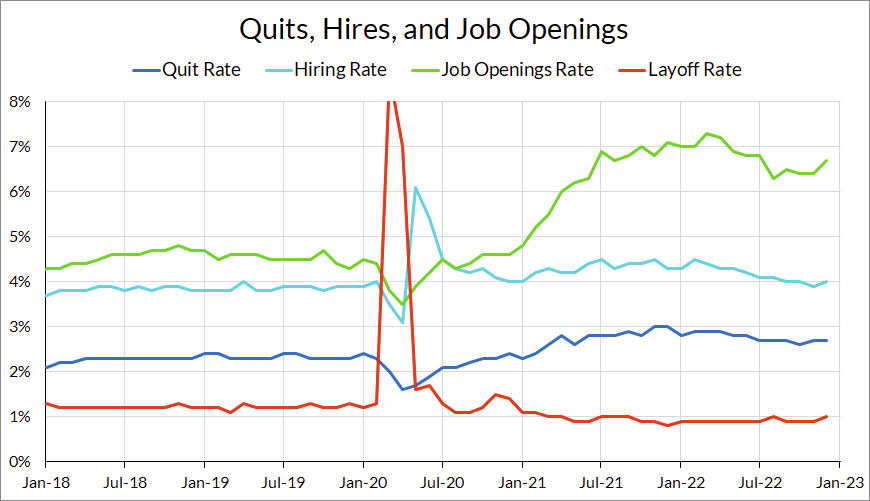
I’m a little hesitant to lean too heavily on the JOLTS data, due to the fall in response rates over the past year (they were at 30% for the last available response rate). Luckily, the JOLTS story is corroborated by the other data we can bring to bear on this question. Another place to look is unemployment insurance claims.
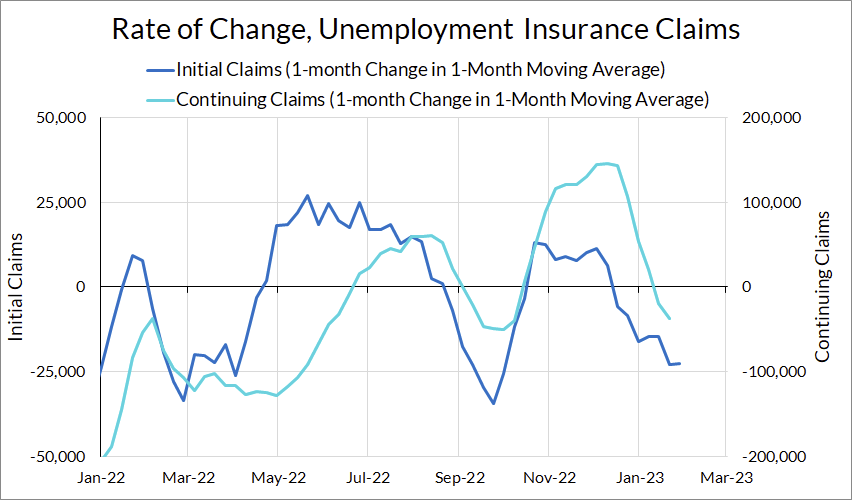
If anything, both initial claims have been falling, belying any story of excess layoffs. It’s possible that the layoffs are concentrated among people who are not likely to take unemployment insurance due to receiving severance, but the lack of an increase in initial claims is relieving.
Finally, we turn to the Current Population Survey. Two figures are key here, the first is the number of unemployed for less than five weeks. These are the people who are likely to be recently laid off. No sign of the layoff recession there:

Another place to look is the job leavers as a percentage of the unemployed. If layoffs were driving what little unemployment we’re seeing, it’s not showing up here either.

No matter which way you cut it, there just isn’t any sign of layoffs hitting the labor market in any meaningful aggregate sense.
Last week, I wrote about how important hiring is to expansions and recessions. In that piece, I decomposed the changes in the unemployment rate into changes attributable to changes in the unemployment inflow and outflow rates. That flow decomposition (and the one I have used in previous labor market recaps) relied on a simplified model of the labor market with only employment and unemployment. But what about labor force participation?
For months, the Fed has bemoaned the lack of labor force participation as a drag on labor supply. I previously wrote about how the shortfall in the overall employment population ratio is mostly driven by aging and lower employment rates among the oldest in the population. Fed research around the same time told broadly the same story for labor force participation, but their breakdown shows a greater scope for actual falls in participation and less for aging.
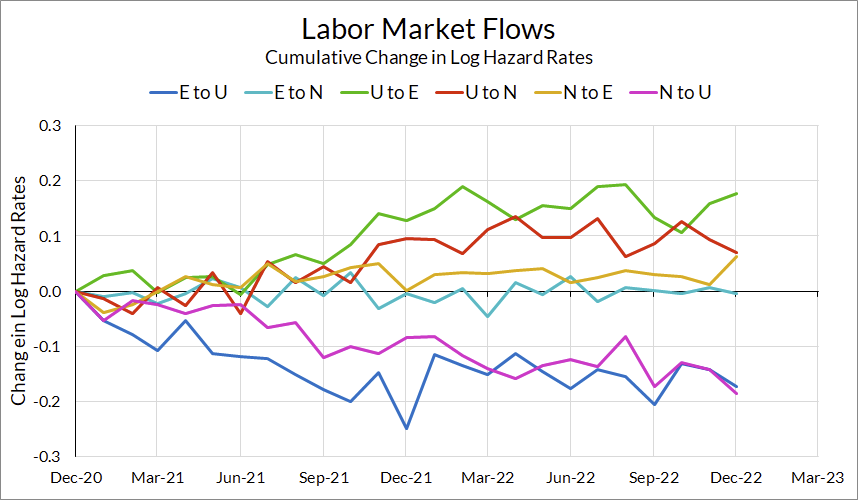
Following Shimer (2012) again, I calculate the flow rates between employment, unemployment, and non-participation (this method basically takes the CPS gross flows data and adjusts for the time aggregation bias of only interviewing people once a month). We now have six flow rates, between each pair of the three labor force status (employment, unemployment, and nonparticipation). These labor market flows are quite noisy in the month-to-month data, so a single month does not tell us much. However, the longer trend is informative. Below, I plot the cumulative change in each log hazard rate since December 2022:
Another way of reading what happened:
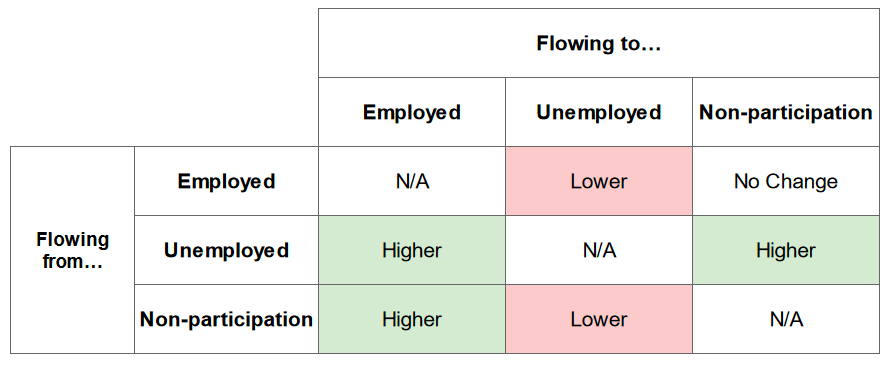
The thing that jumps out about non-participation is that non-participants have become less likely to enter the labor force as unemployed, but more likely to enter the labor force as employed. Does that seem like a story where people don’t want to work anymore?
What we see now is a labor market where the unemployment rate is historically low, and the employment and participation rates are high, but not historically high. It’s not that people don’t want to be employed anymore, it’s that no one wants to be unemployed. As we’ve written about before, the focus on unemployment can be misleading as the lines between unemployed and nonparticipants can be blurred. While there is a shortfall in participation, the shortfall has more to do with less unemployment and not less participation in the labor market overall. If you’re the Fed and focused on job openings per unemployed, you probably think the labor market is hotter than it actually is.
As my colleague Alex Williams wrote earlier this week, recent data developments have undercut the story that we need to force labor market pain to see wage slowdowns that more hawkish voices, the Fed included, have been calling for. The next few months are likely to be bumpy, with quirks in rent inflation measurements, difficulties in measuring wages, and residual seasonality. But the past few months tell a clear story: we can have disinflation without increasing unemployment.
Powell had a chance to acknowledge that fact at the last press conference, but decided to punt when directly asked about the unemployment rate trajectory:
You know, we're going to write down new forecasts at the March meeting, and we'll see at that time. I will say that it is gratifying to see the disinflationary process now getting underway, and we continue to get strong labor market data. So -- But, you know, we'll update those forecasts in March.
– Jay Powell, February 1st, 2023 FOMC Press Conference
The next Fed meeting comes with an update to the Summary of Economic Projections. We hope they back off from their current projections, which call for an unnecessary recessionary increase in the unemployment rate.