Labor Market Recap May 2023: Renormalization
The data from the May labor market shows continued renormalization of the labor market, with strong employment, continued slowing of wage growth, and reduced churn.

The data from the May labor market shows continued renormalization of the labor market, with strong employment, continued slowing of wage growth, and reduced churn.
Some of the data we use on our labor market analysis is created in-house. We make those data series available to premium donors at our new labor market dashboard page here. To learn more about our Premium Donor Program, click here.
The data from the May labor market shows continued renormalization of the labor market, with strong employment, continued slowing of wage growth, and reduced churn.
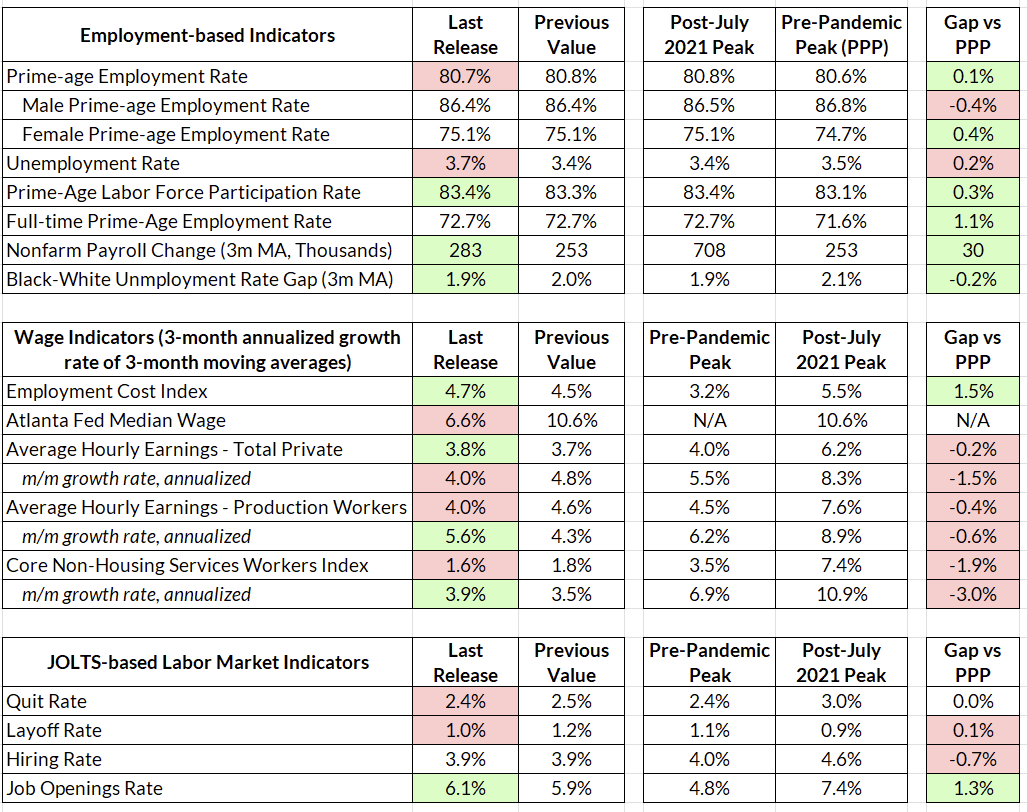
The headline unemployment number rose from 3.4% to 3.7% and the establishment survey showed a very strong 339,000 jobs added in May. The prime-age employment rate fell slightly from 80.8% to 80.7%, prime-age labor force participation rose from 83.3% to 83.4%, and prime-age full-time employment remained flat at 72.7%. There are certainly a few areas for concern—unemployed job losers made another local high and black unemployment increased—but the balance of evidence points towards a labor market that remains resilient but is decelerating.
While at first glance the household and establishment survey figures are contradictory, much of the difference is accounted for by differences in definitions of employment in the two surveys. The household survey, adjusted to match establishment survey concepts, showed an increase of 394,000 jobs in May. The difference is largely attributable to a fall in unincorporated self-employed workers (which would not be picked up by the establishment survey).
The theme of the day is renormalization. Quits, which have been elevated, have fallen to pre-pandemic levels. Wage growth, especially in the core non-housing services sectors, continues to follow a downwards (but bumpy) trajectory. Employment growth was especially strong in sectors that have been sluggish to return from the pandemic, such as education, health services, and government.
Coming into this jobs report, Fedspeak has signaled an openness to pausing at the June meeting, pending the data. While this report is strong, the headline unemployment rate and the absence of a reaccelerating labor market should be enough that the Fed will be comfortable with a pause in June.
At first glance, the May jobs report is confusing, with a very strong increase in employment from the establishment survey but an increase in the unemployment rate in the household survey. It appears that the difference between the surveys this month is mostly attributable to differences in the definitions of employment in the household survey versus jobs in the establishment survey.
Conceptually, the difference between the household survey and the establishment survey is that the household survey includes:
The establishment survey does not include jobs held by the above. However, the establishment survey also includes jobs held by multiple jobholders.
The BLS publishes an experimental series where the household data is adapted to the establishment survey concepts. Once adjusted for these differences, the household survey shows similar job growth to the establishment survey in May:
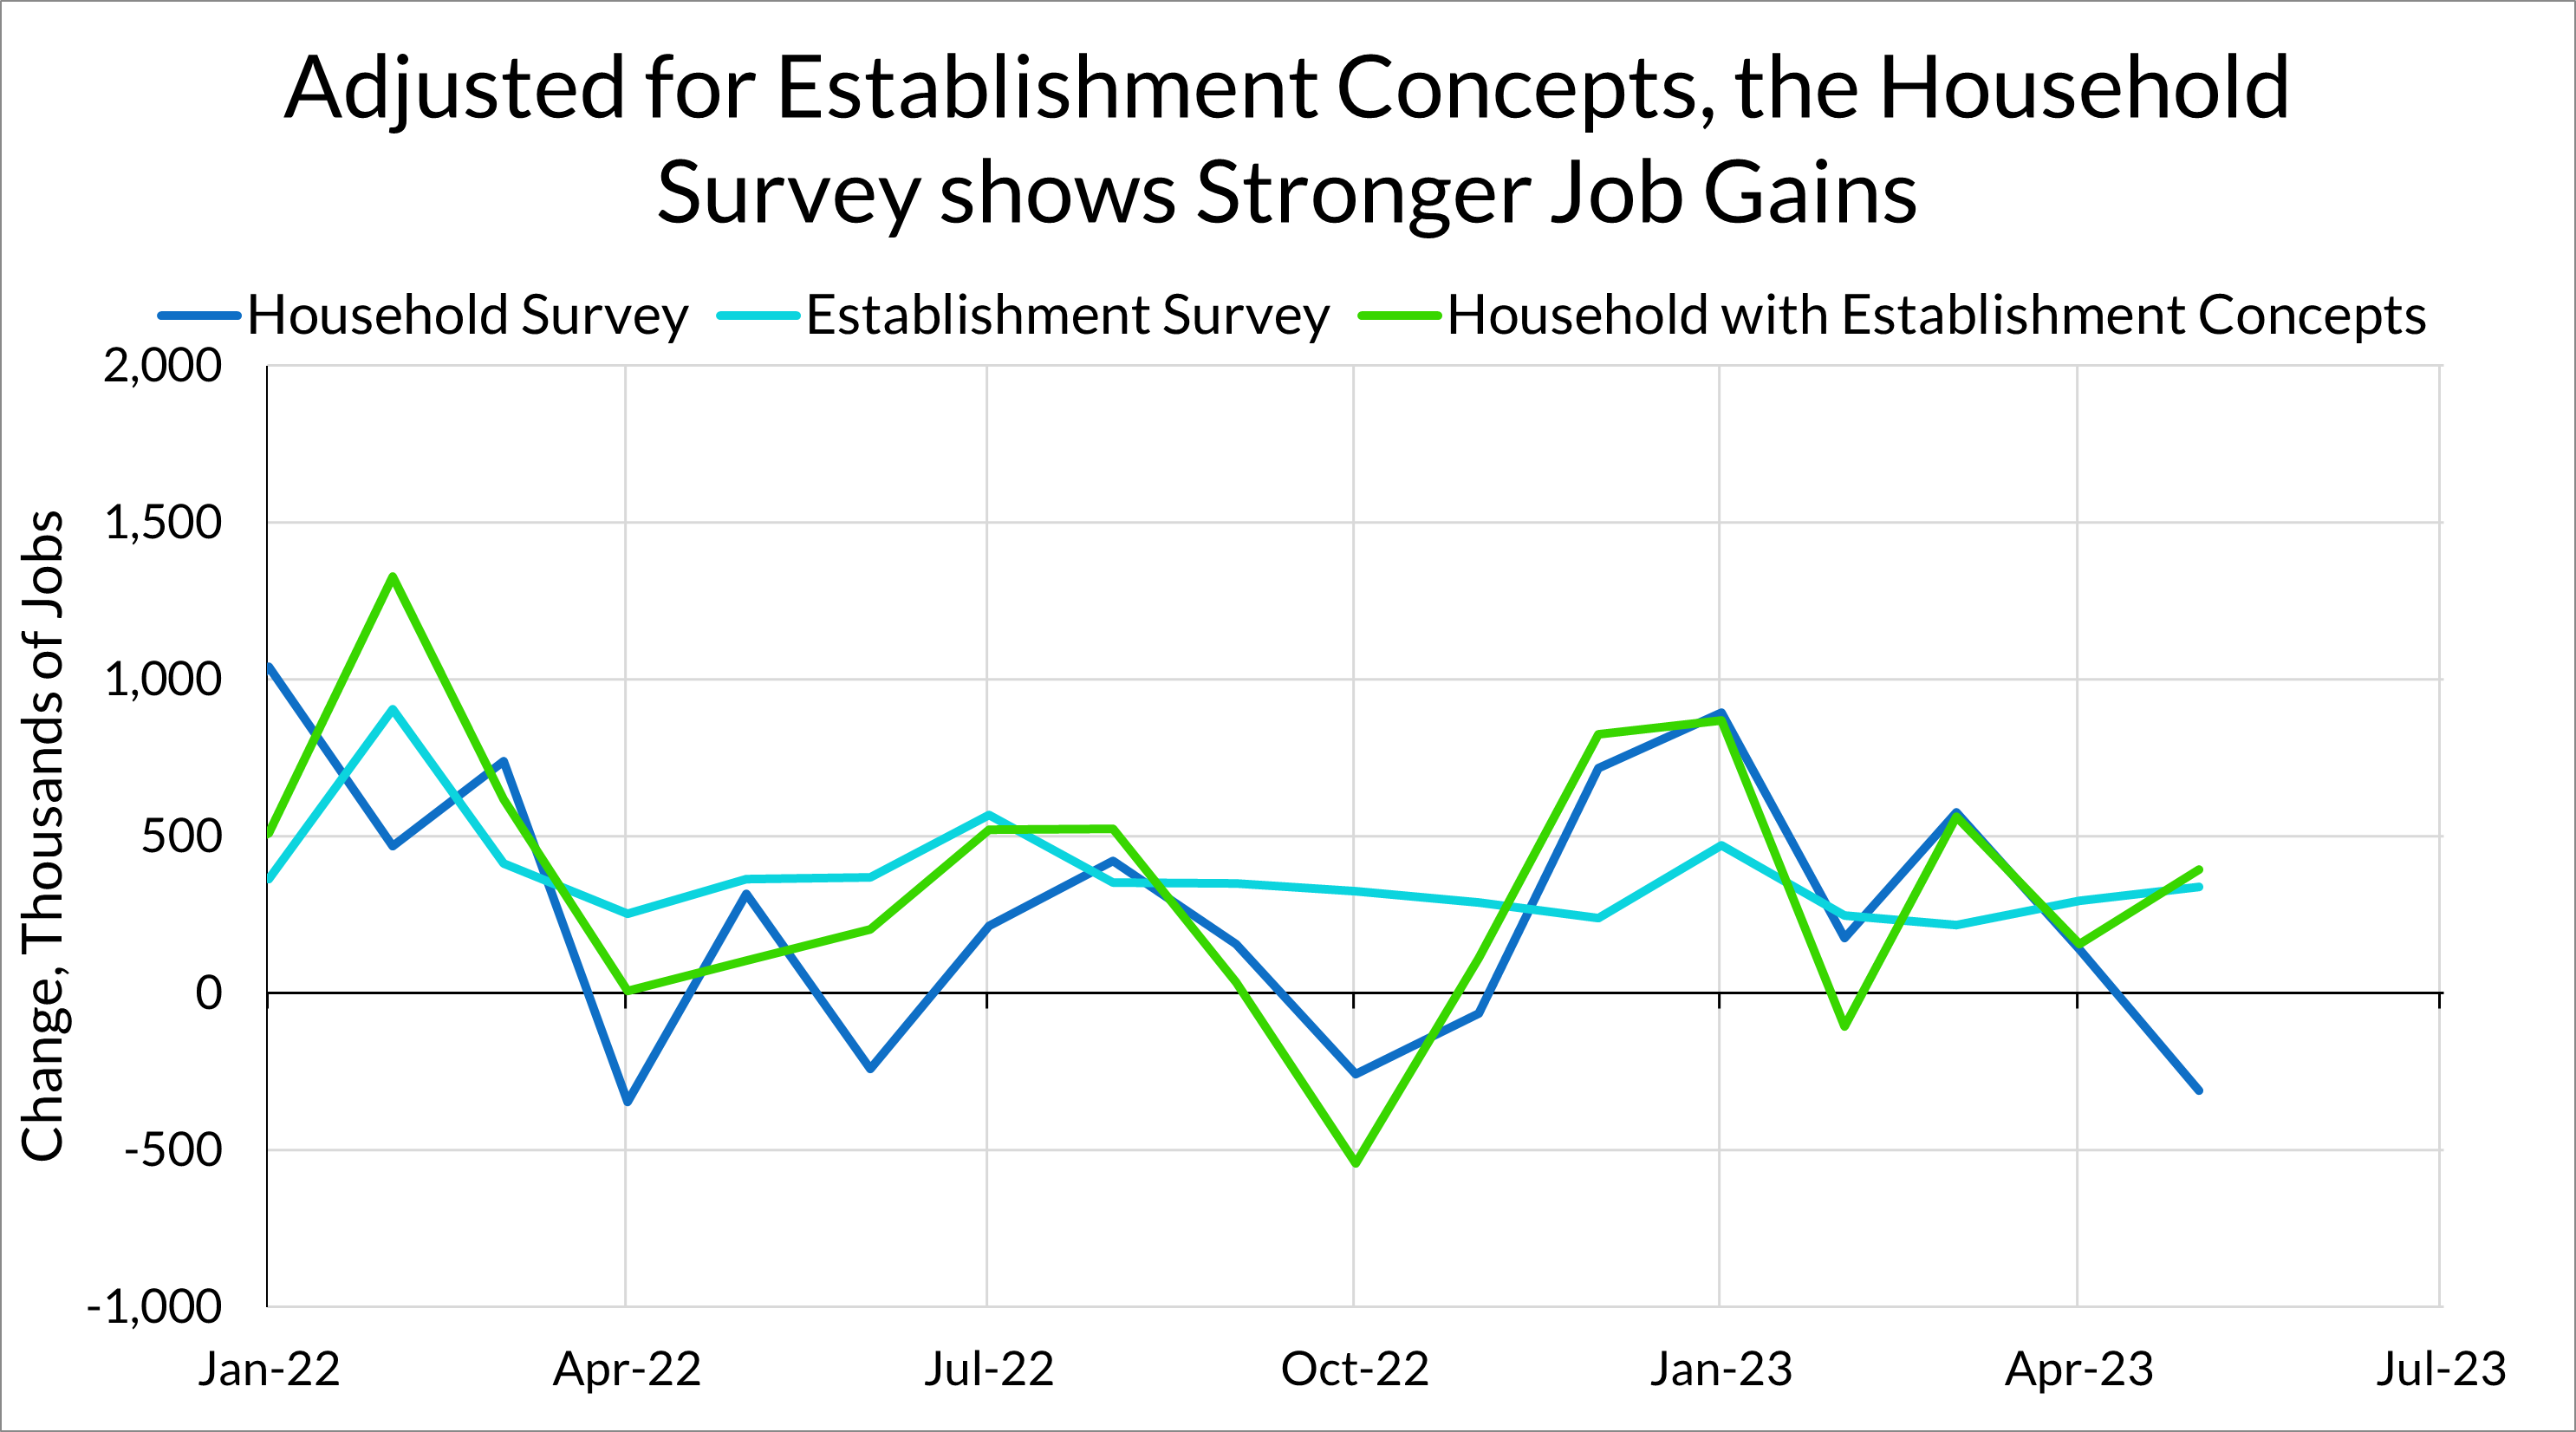
The discrepancy between the two surveys appears to be mostly accounted for by a sharp decrease in the number of respondents who are self-employed in unincorporated businesses. The number of these self-employed workers fell sharply in May, and would affect the household survey employment numbers but not the establishment survey jobs numbers.
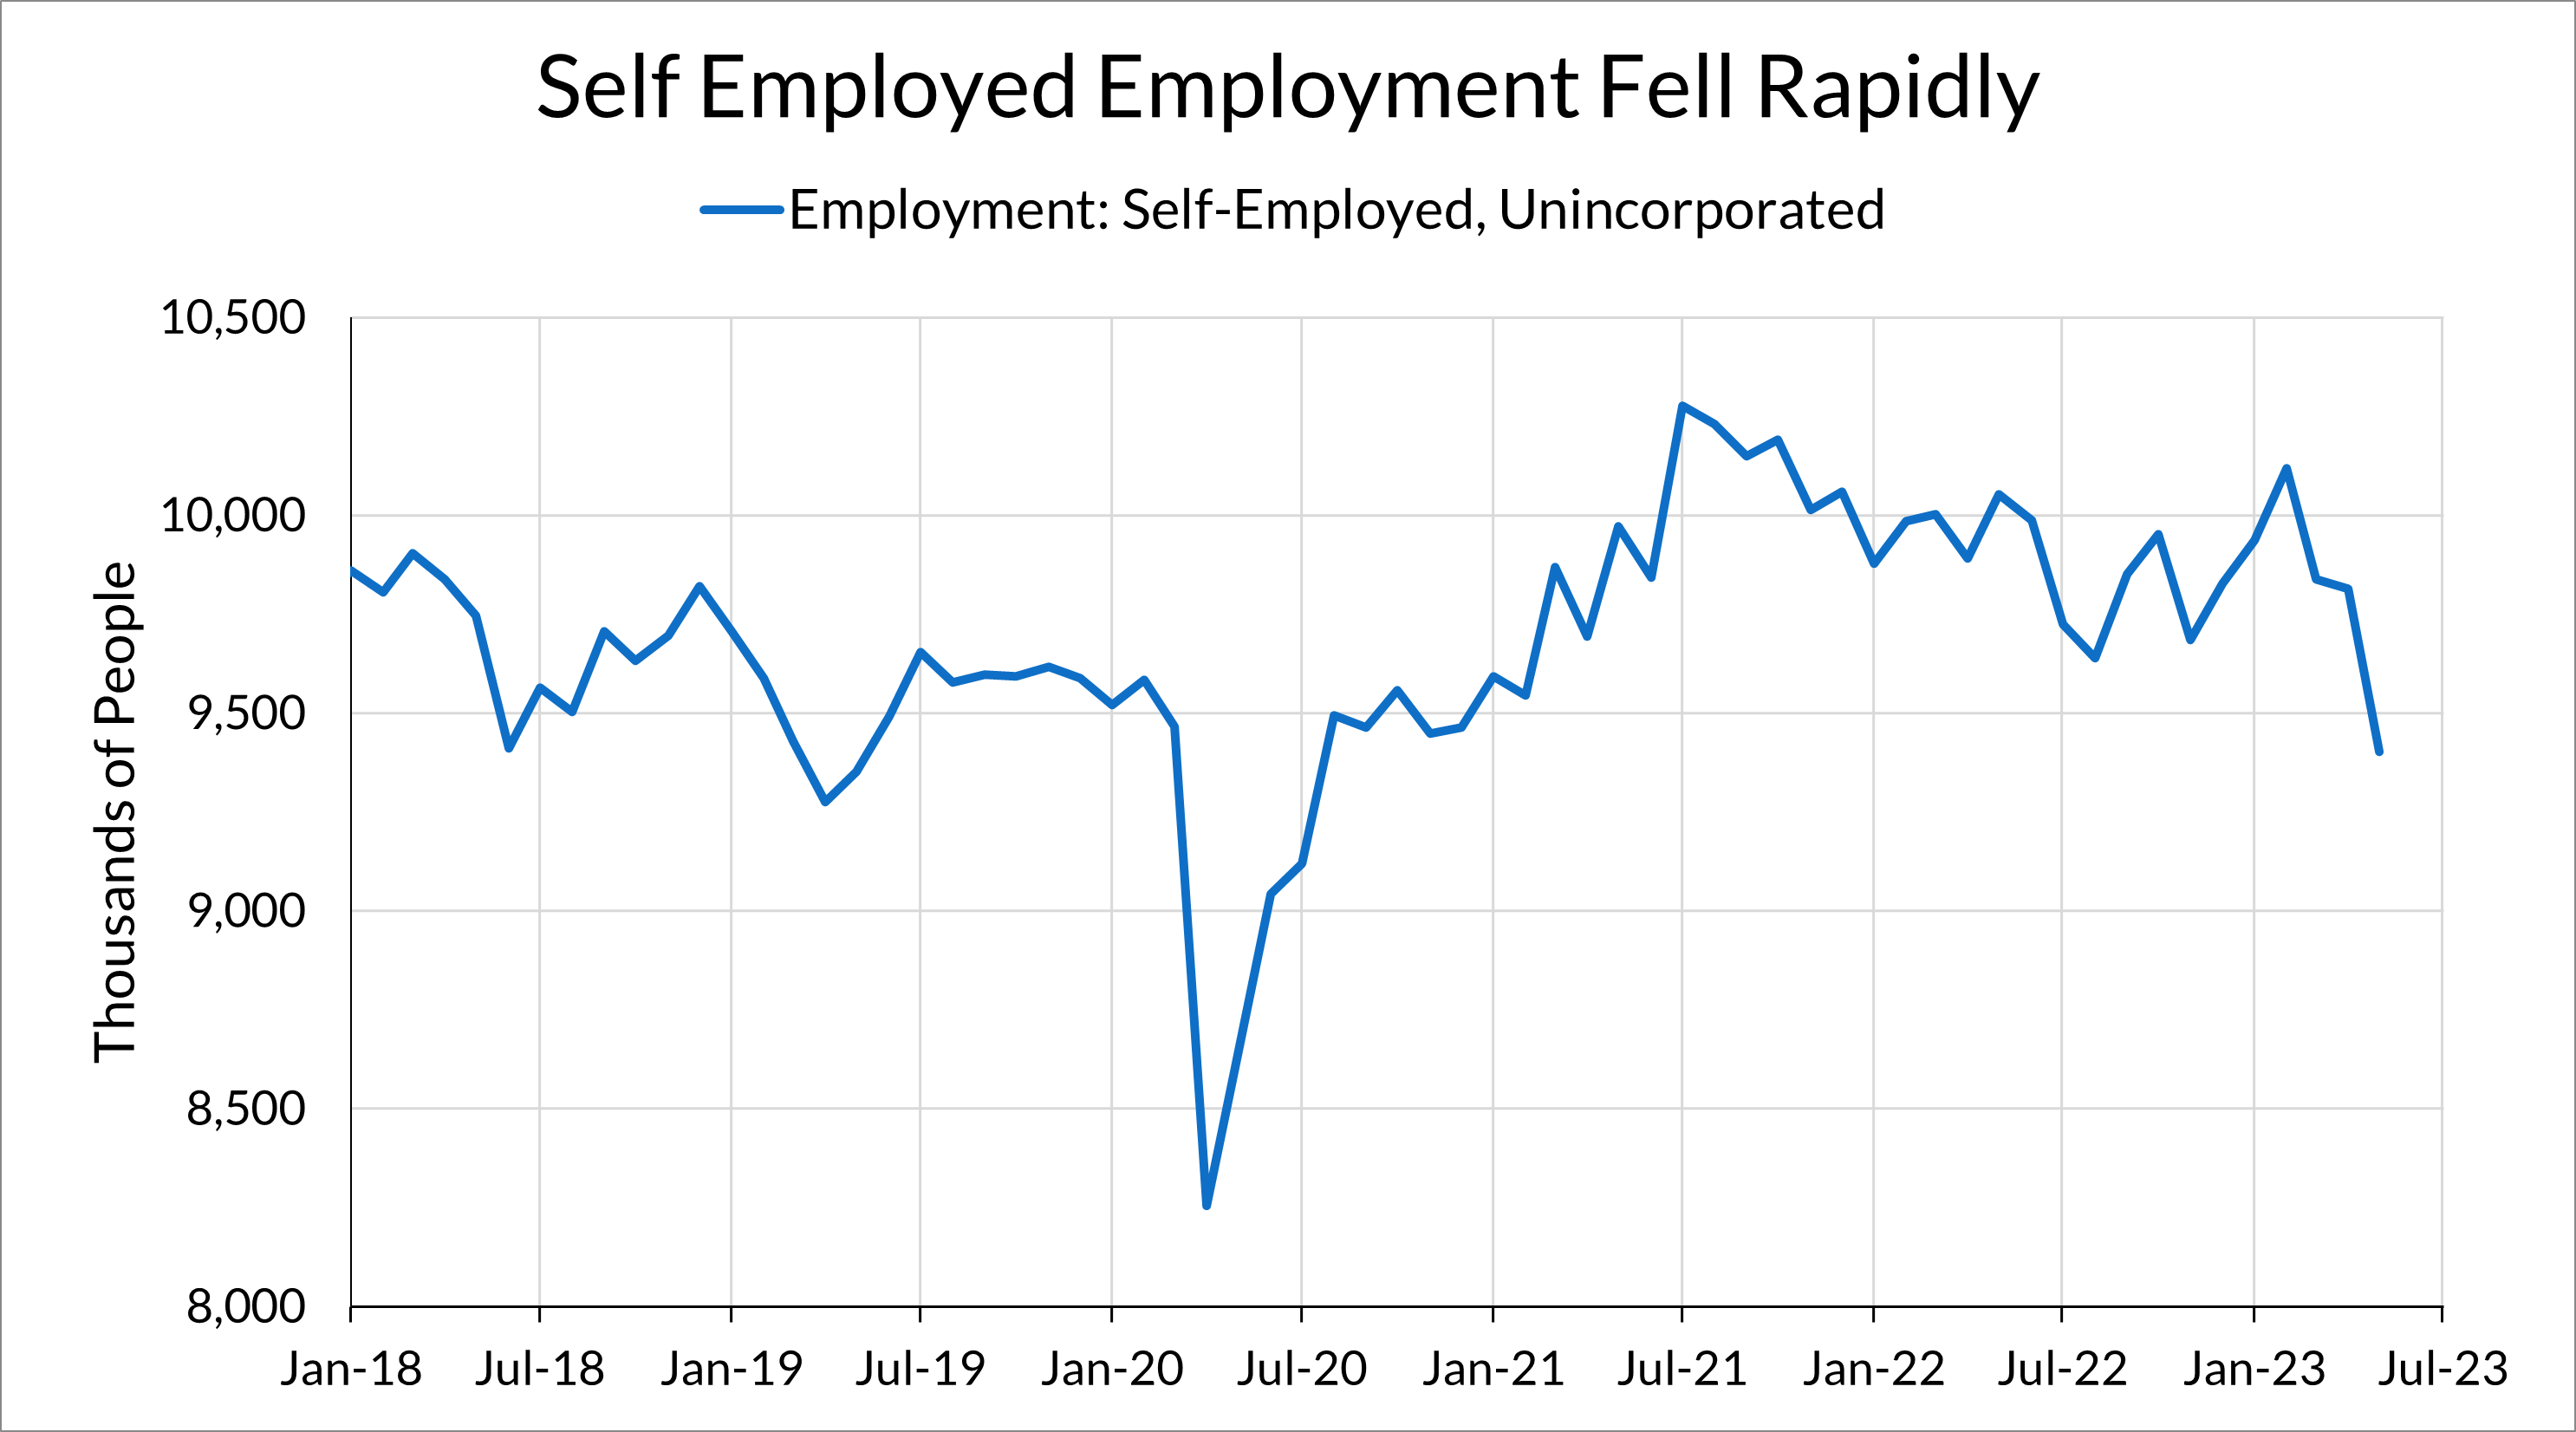
As with many other labor market indicators, this looks more like a renormalization of the labor market. Following a spurt of self-employment activity after the pandemic, self-employment has returned to normal levels.
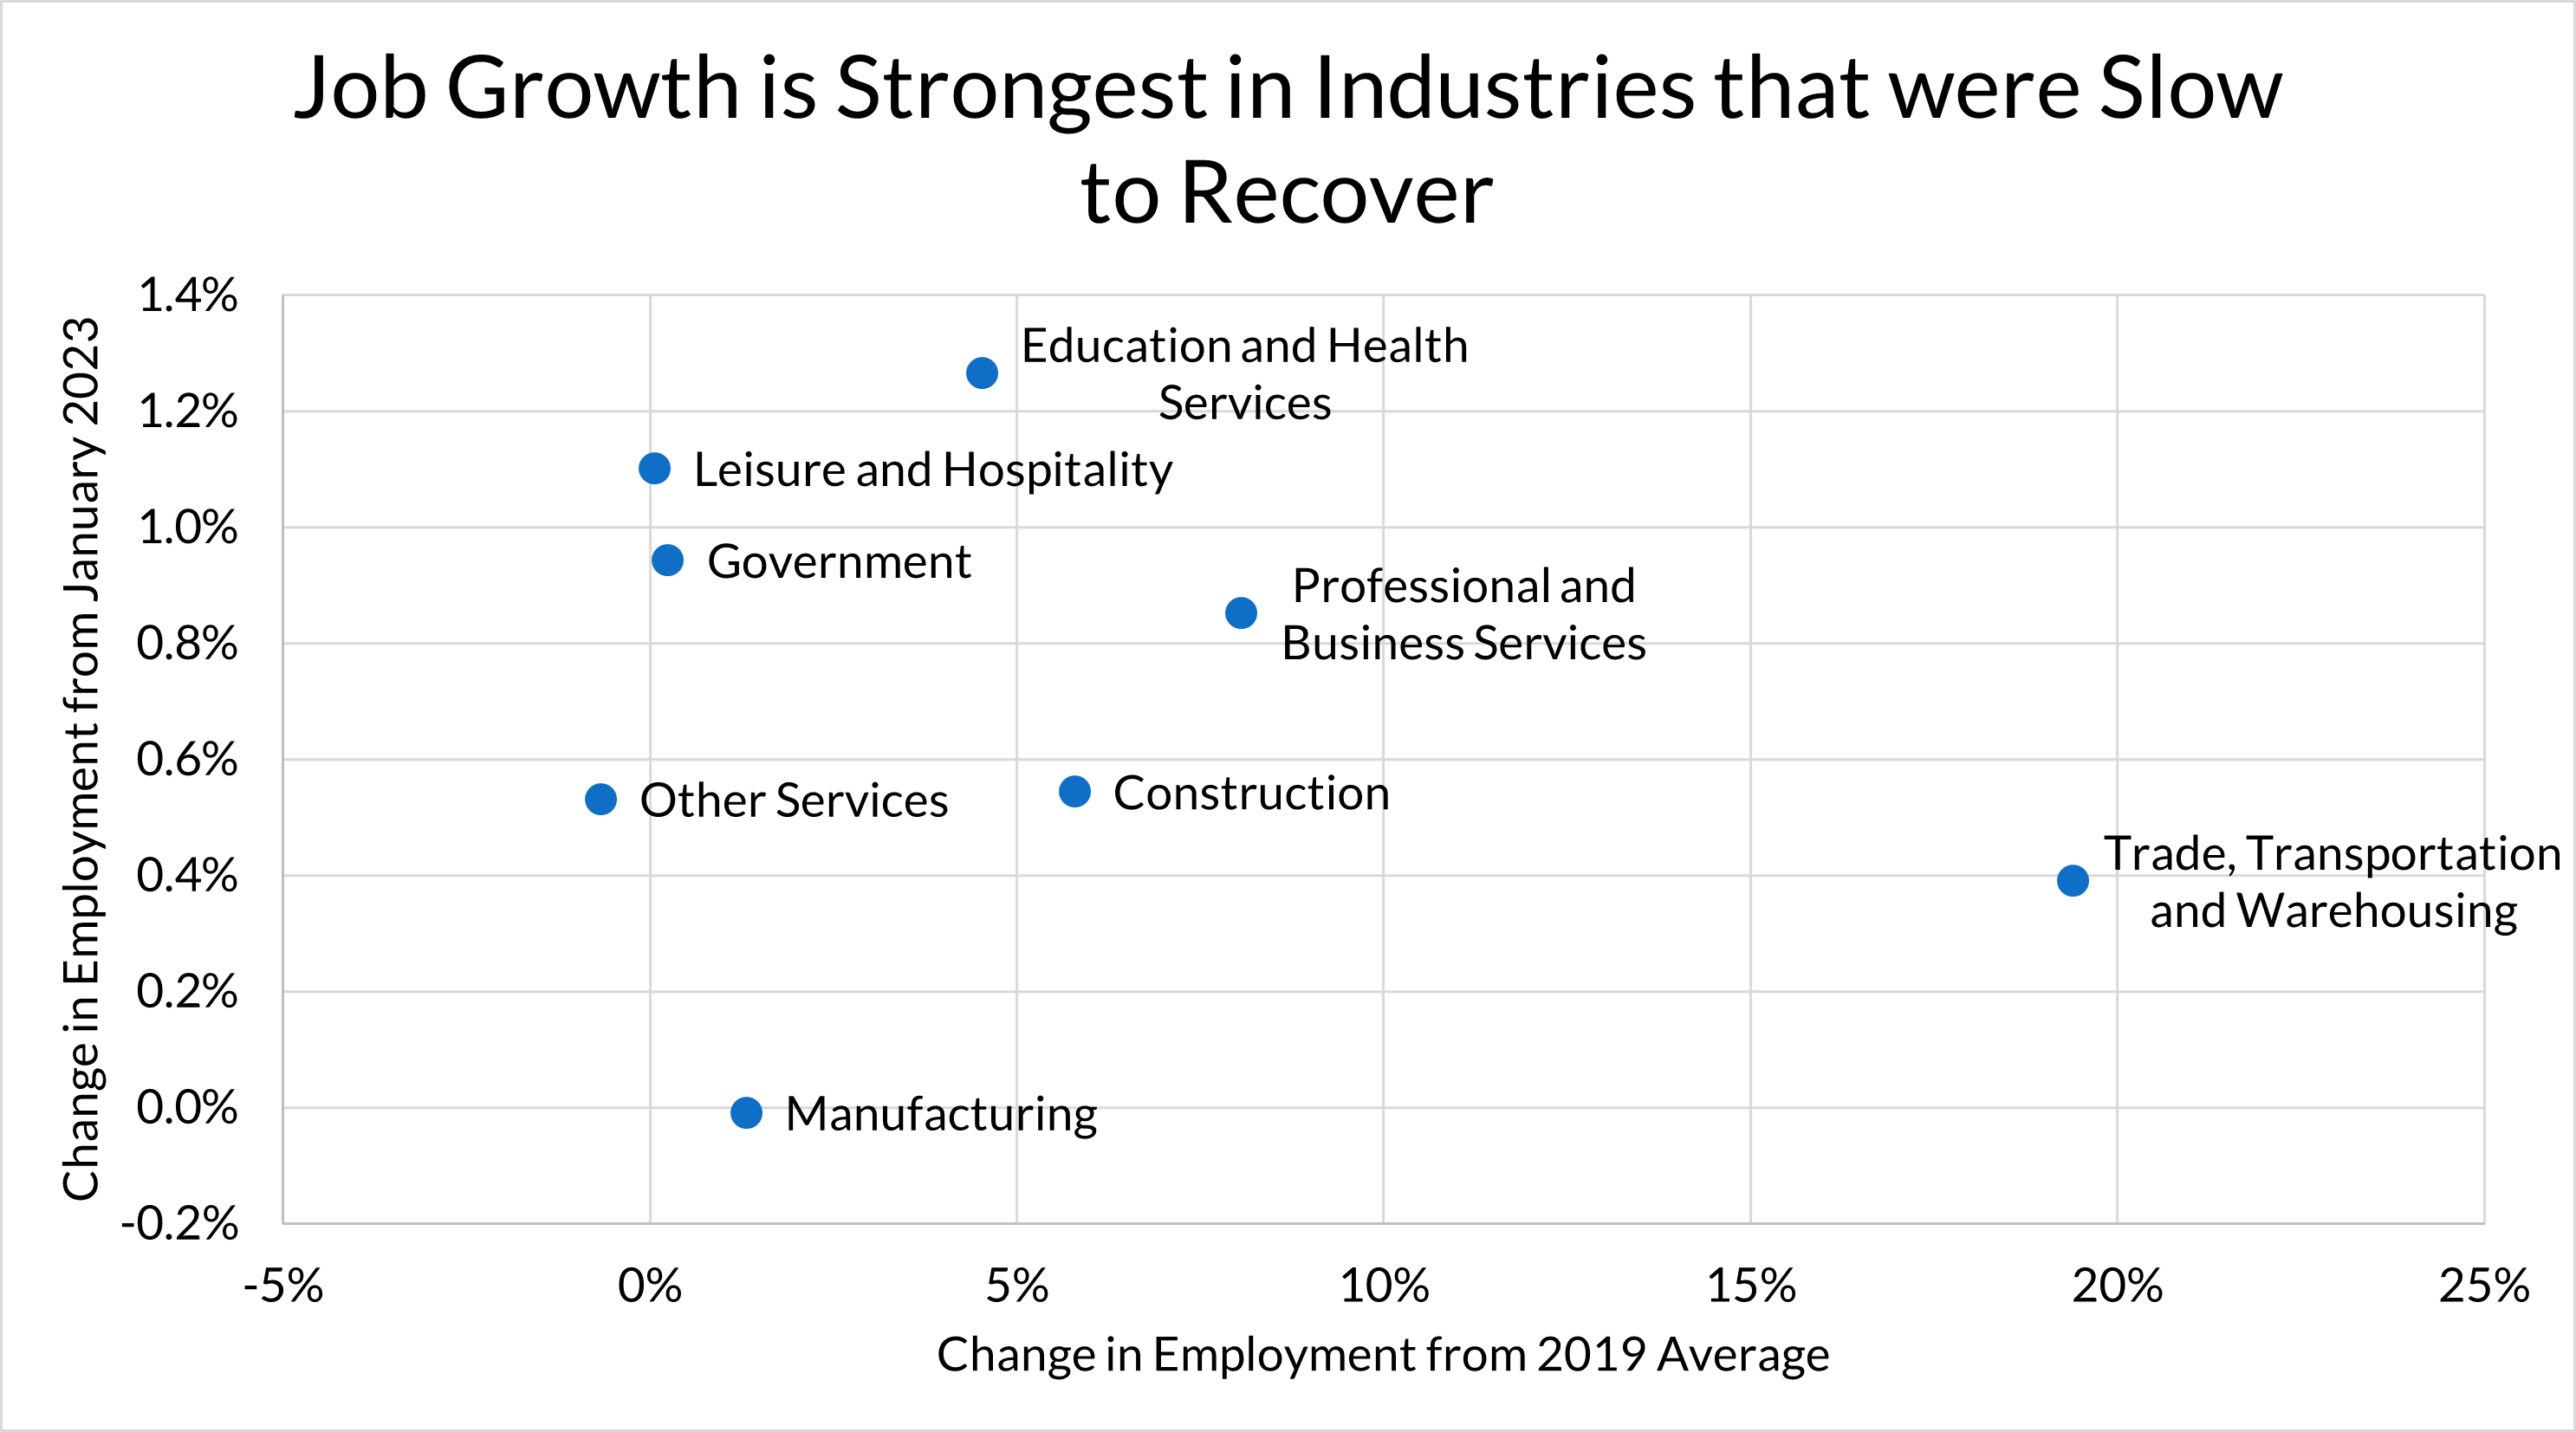
We can see this “renormalization” in many other parts of the labor metric. Today’s establishment survey showed strong job growth in education and health services and government, two of the sectors that have been slowest in recovering from the COVID recession. Across industries, job growth in 2023 has been strongest in the industries that have seen the least recovery, relative to 2019.
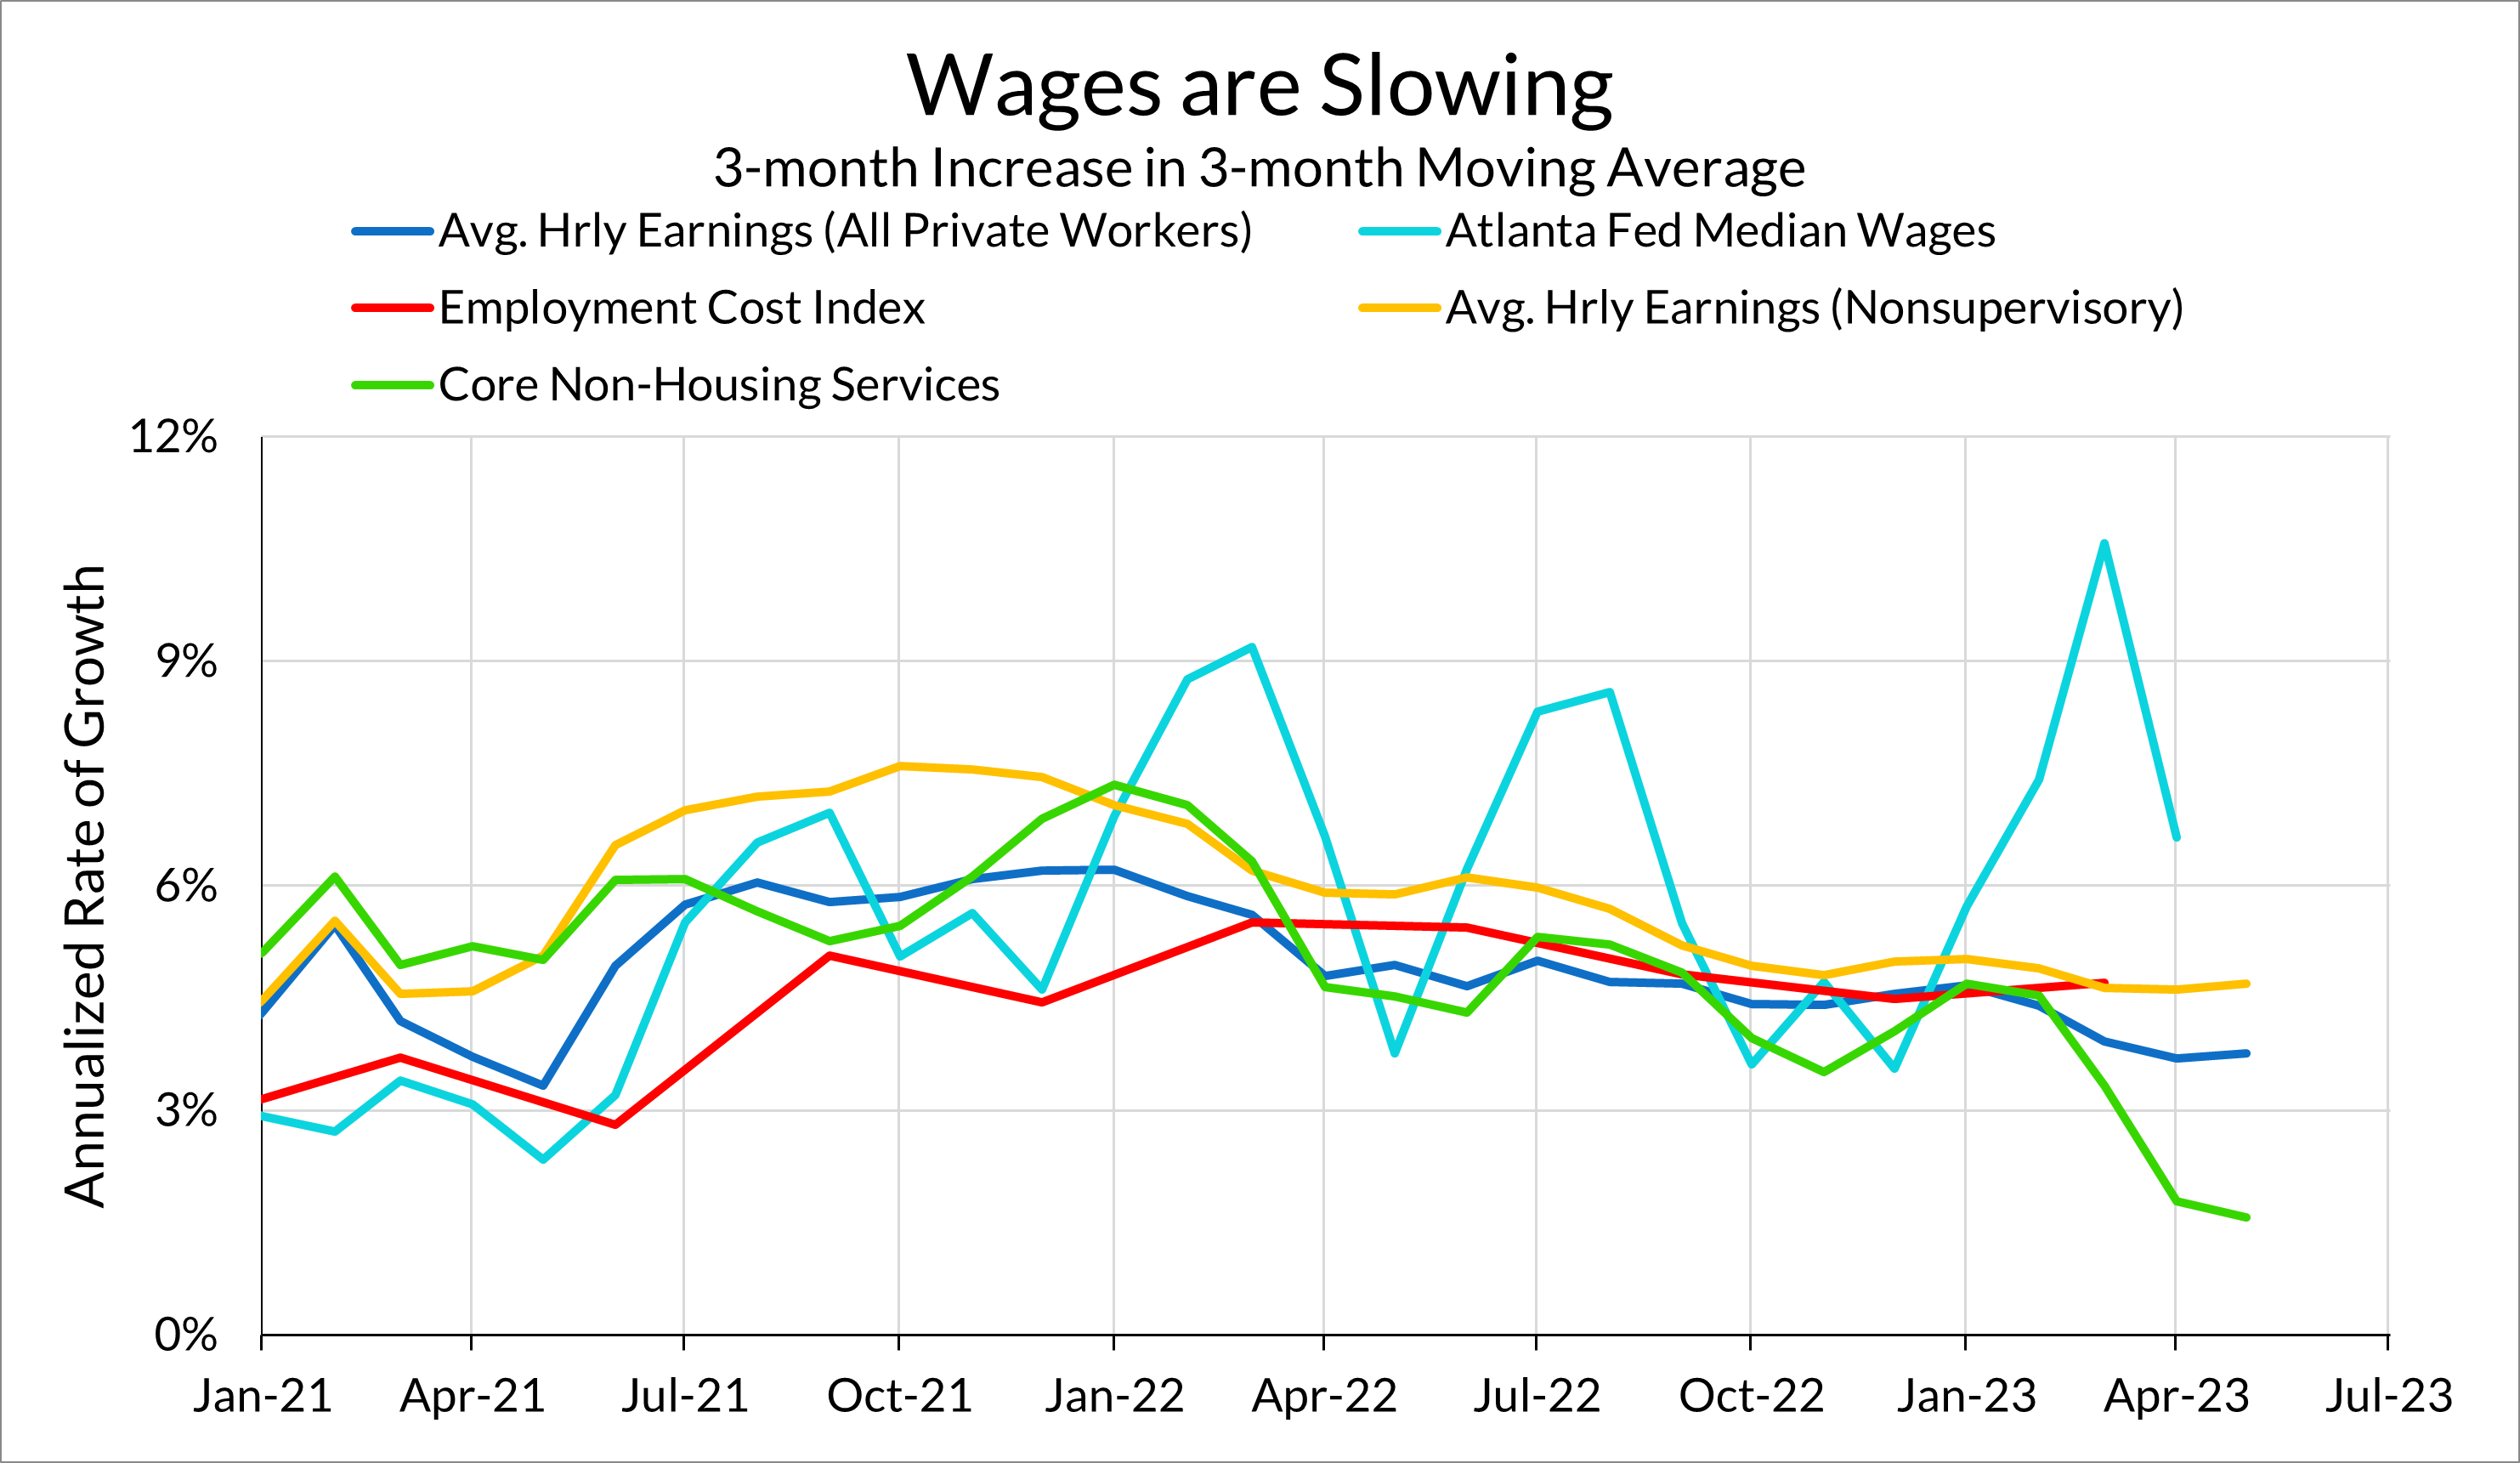
Wage growth is, broadly speaking, on a downward but bumpy trajectory back towards pre-pandemic levels. Asides from the highly volatile Atlanta Fed median wage tracker measure, wage growth is decelerating towards levels the Fed considers consistent with 2% inflation. Notably, core non-housing services average hourly earnings (see here for more information about this series) has been very slow recently, with the 3-month growth in the 3-month moving average at 1.6% annualized.
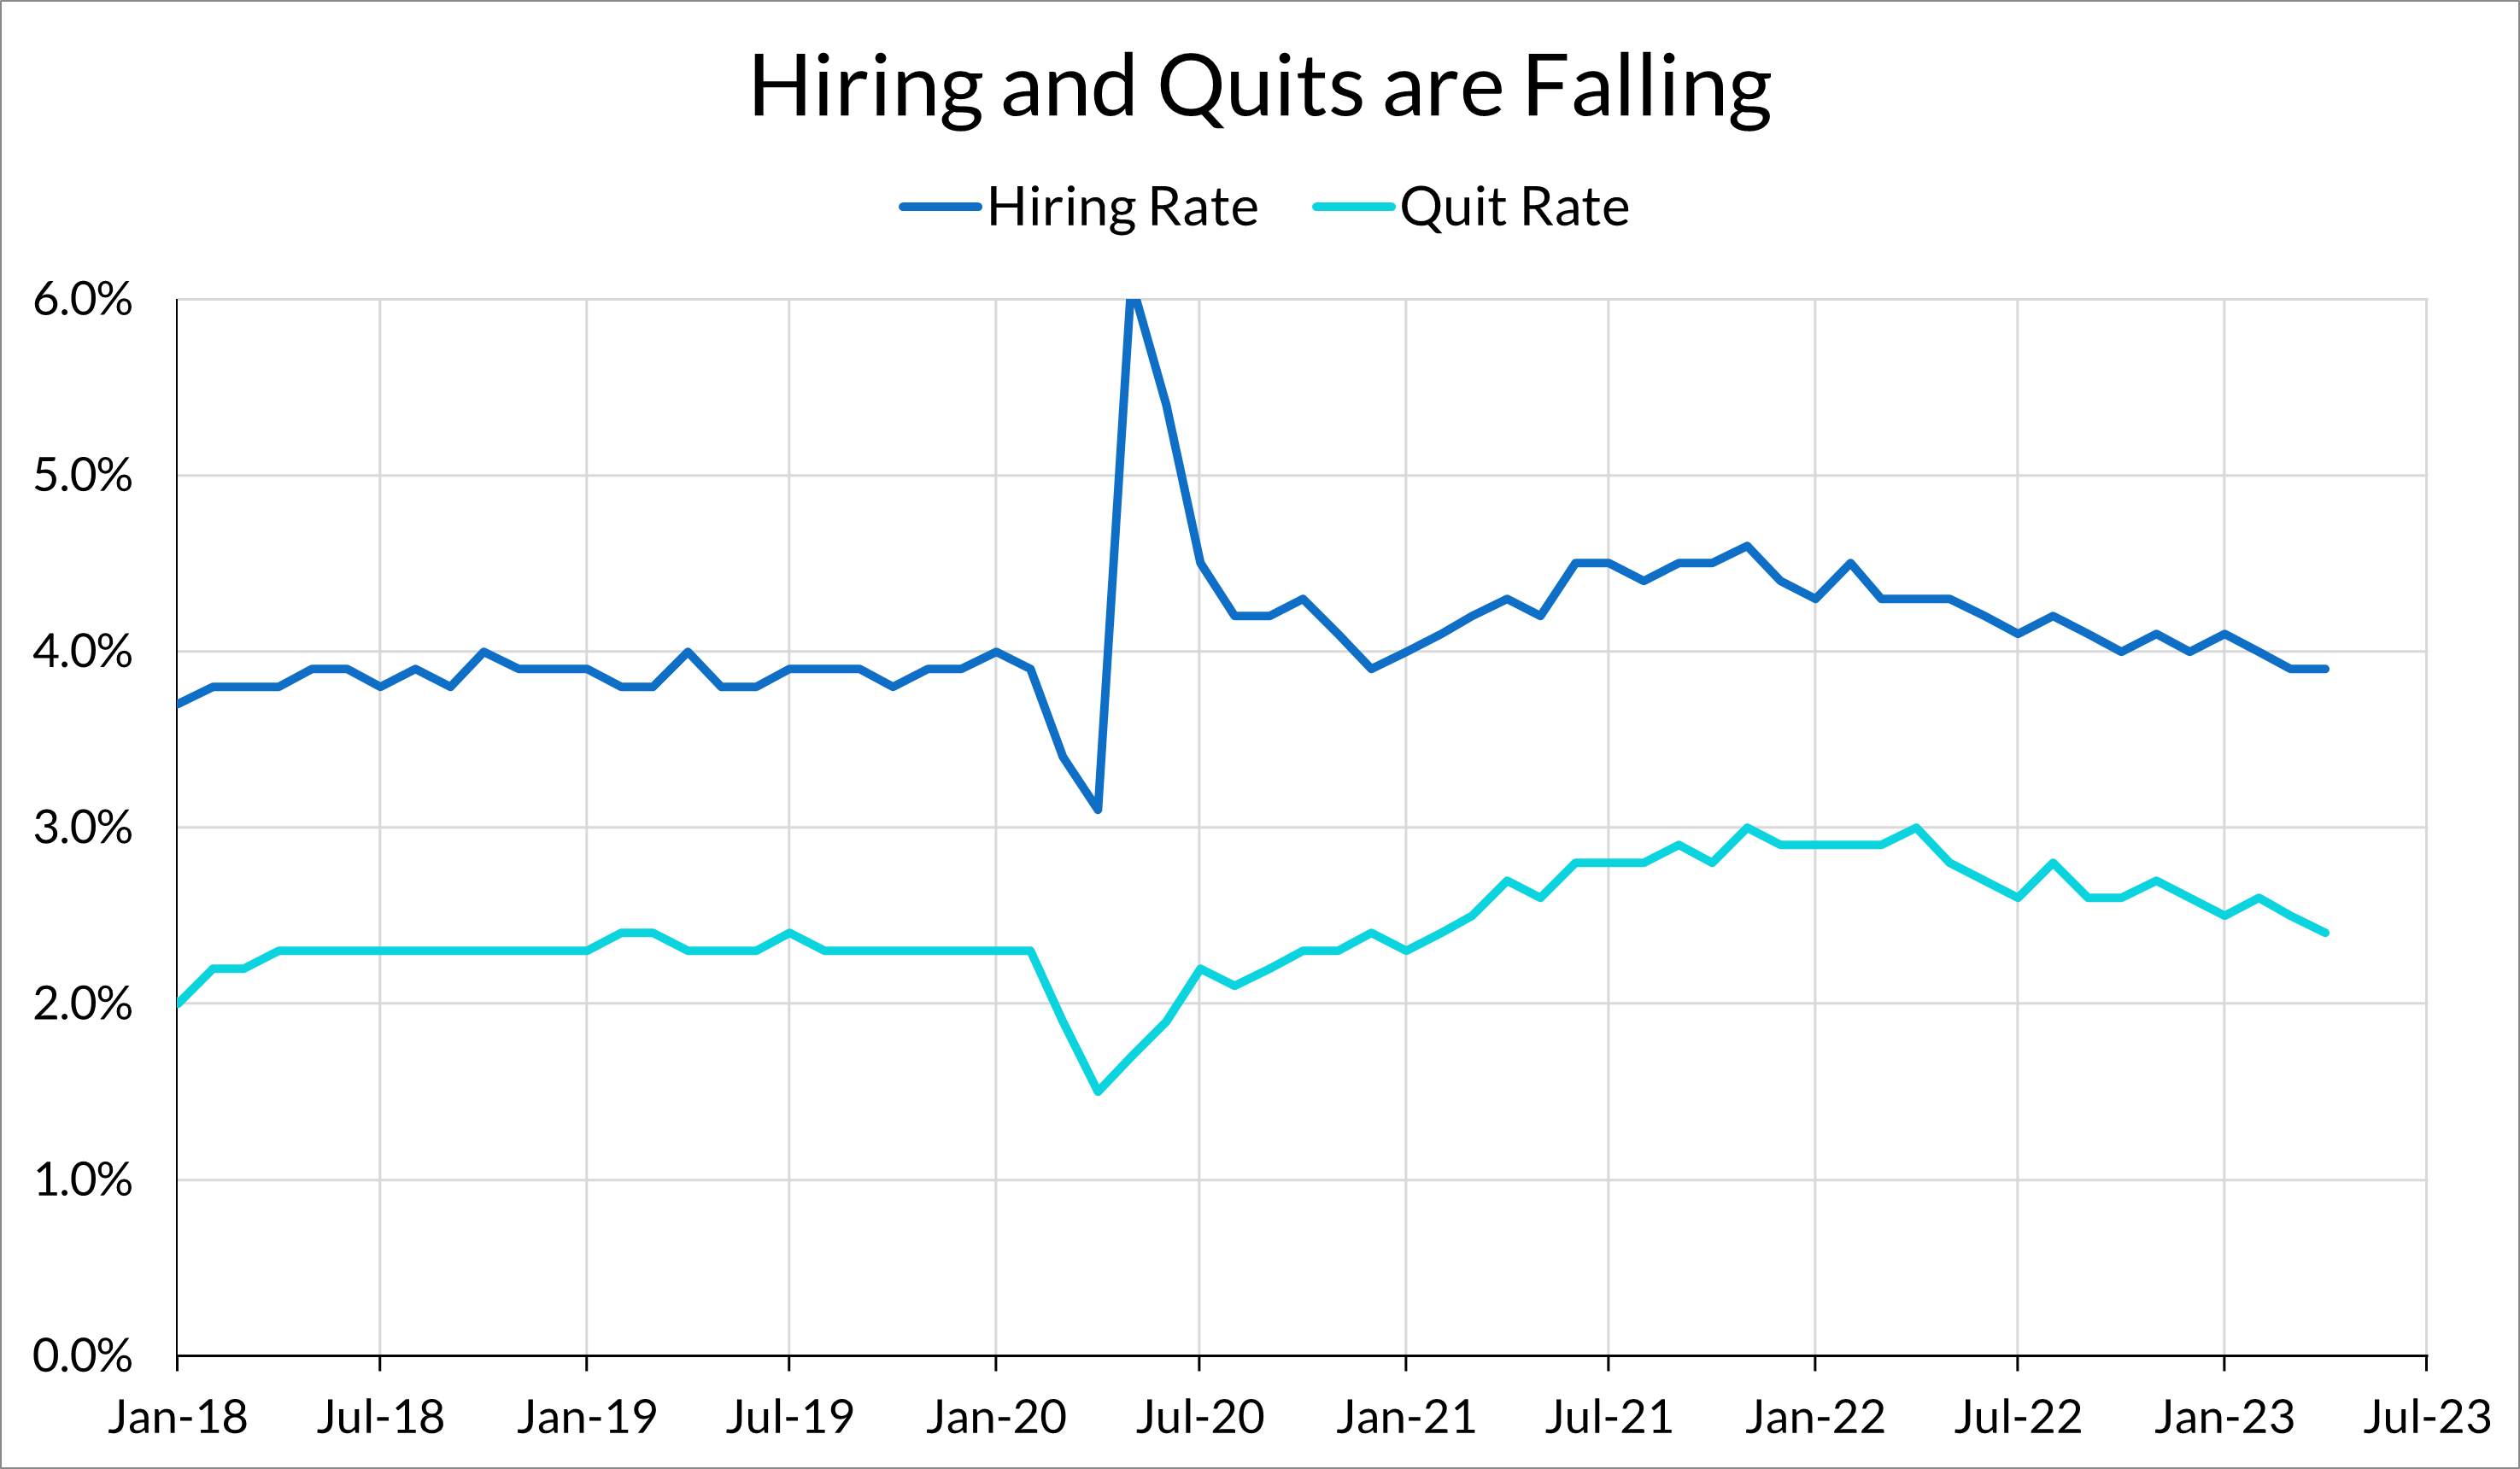
Churn in the labor market is also normalizing. The JOLTS quit rate fell further to 2.4%, and now both the hiring rate and the quit rate are at 2019 levels.
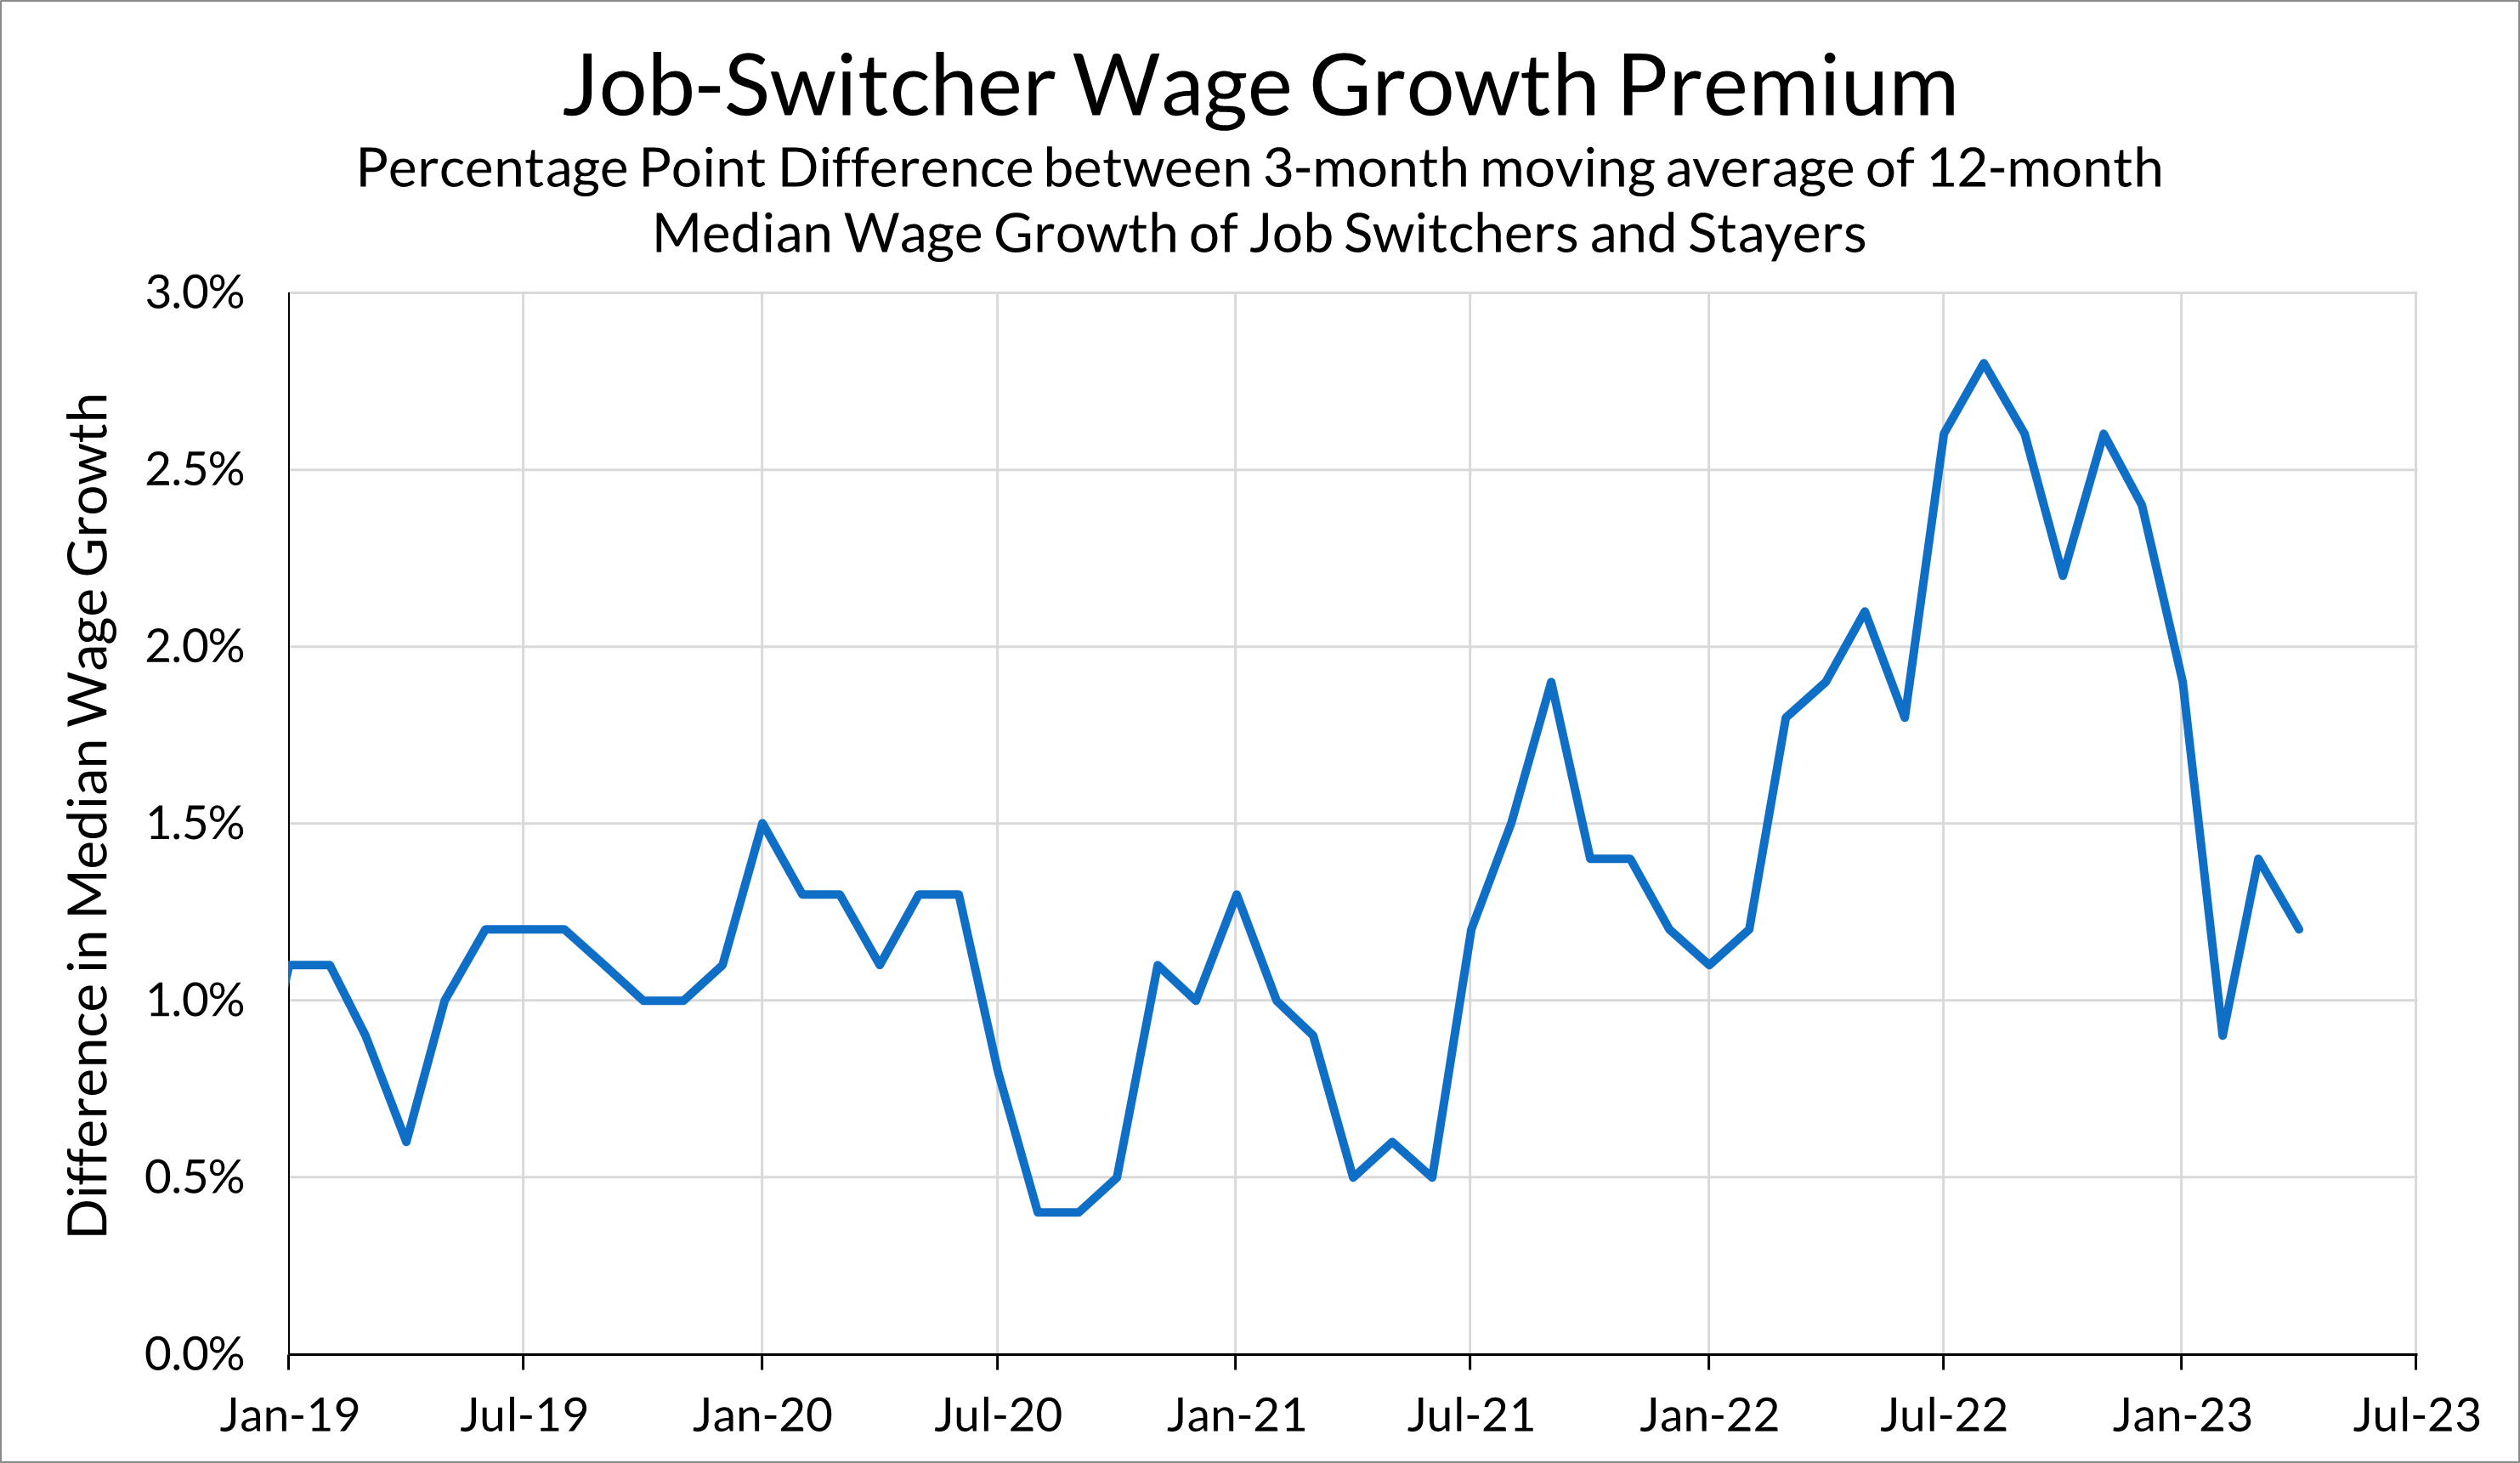
Another sign that labor market churn is returning to normal is that the job-switching premium has returned to normal levels. The graph below shows the difference between the Atlanta Fed’s Wage Growth Tracker for job switchers and job stayers. While job switchers saw their wages grow far faster during 2022, the difference between wage growth in the two groups has fallen sharply over the past six to nine months and is now near 2019 levels.
As a whole, the jobs data from May is broadly a continuation of the labor market story we’ve told over the last few months: the labor market is resilient, with utilization levels high and climbing. Wage growth and churn have come back down from historic highs back down to levels that are very close to where things were before the pandemic (which, I should stress, is still a good place to be—2019 was still a very strong labor market).
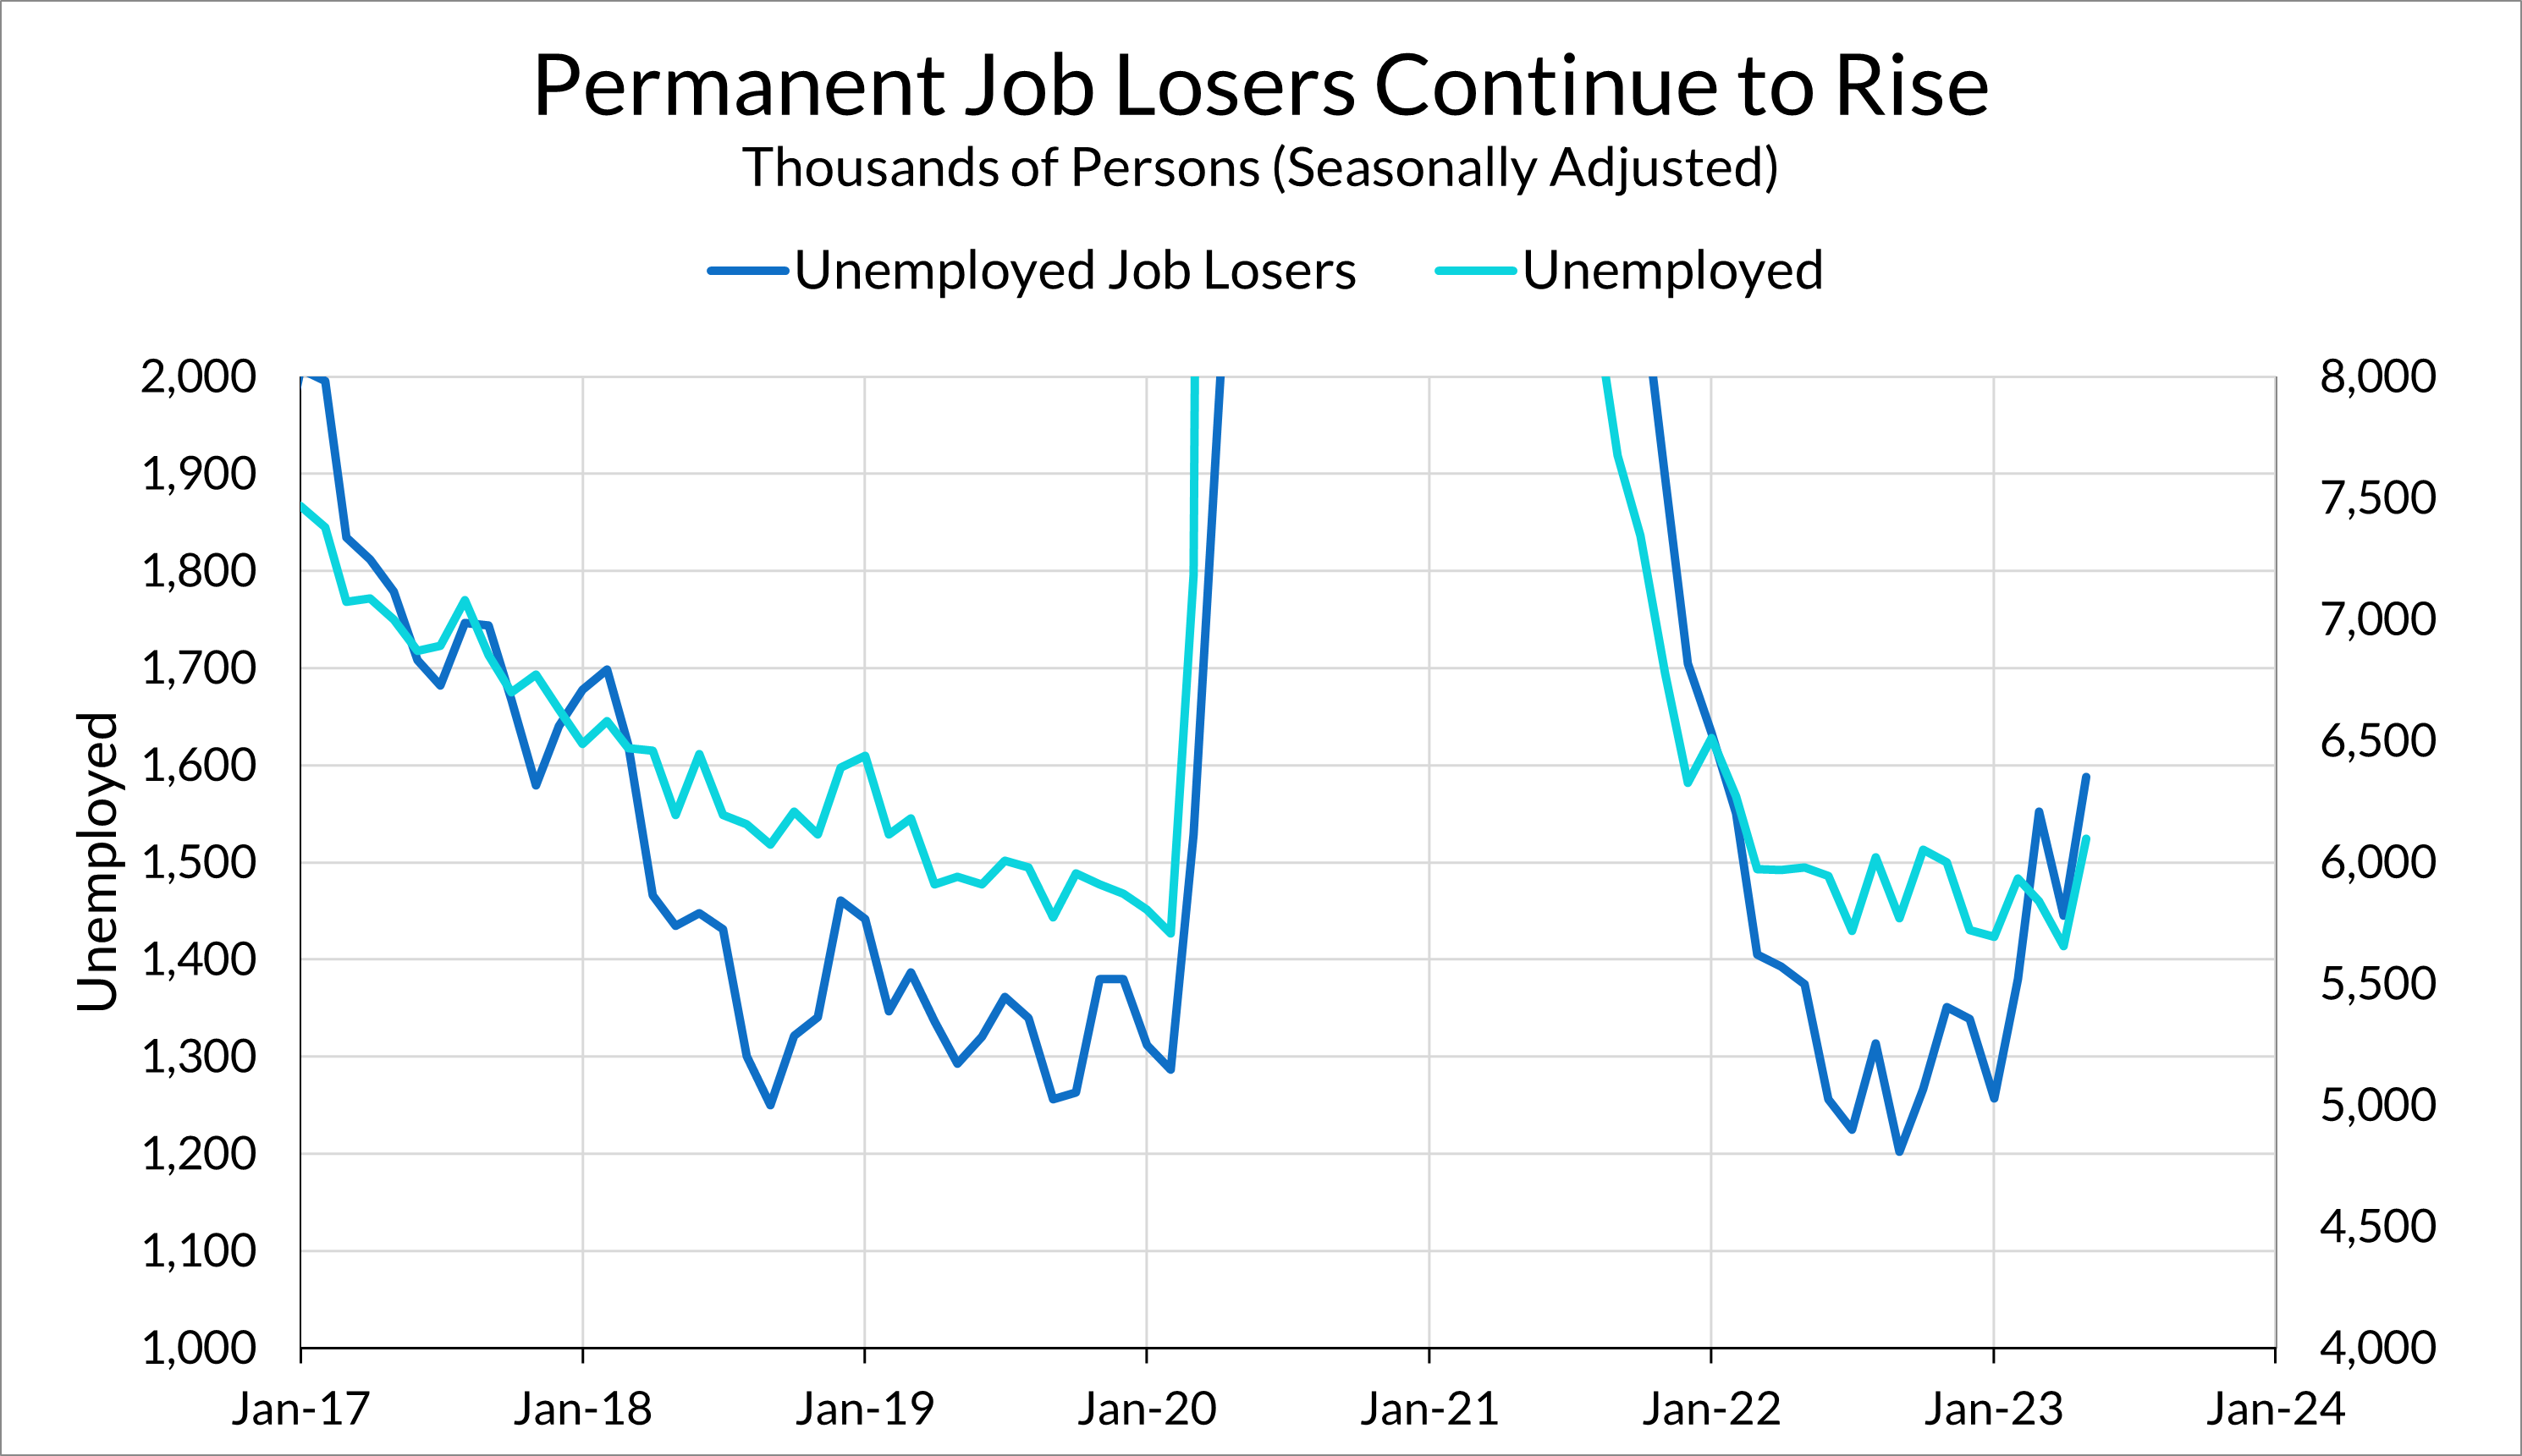
While the bulk of the evidence was for a strong labor market, there are two signs of weakness that give concern. The first is that the level of permanent job losers continues to rise after falling slightly last month. There does genuinely seem to be a recent wave of layoffs that is showing up in the household survey, and as of a month ago it seemed to be largely due to white collar layoffs (we’ll know more about the last two months when the CPS microdata is released).
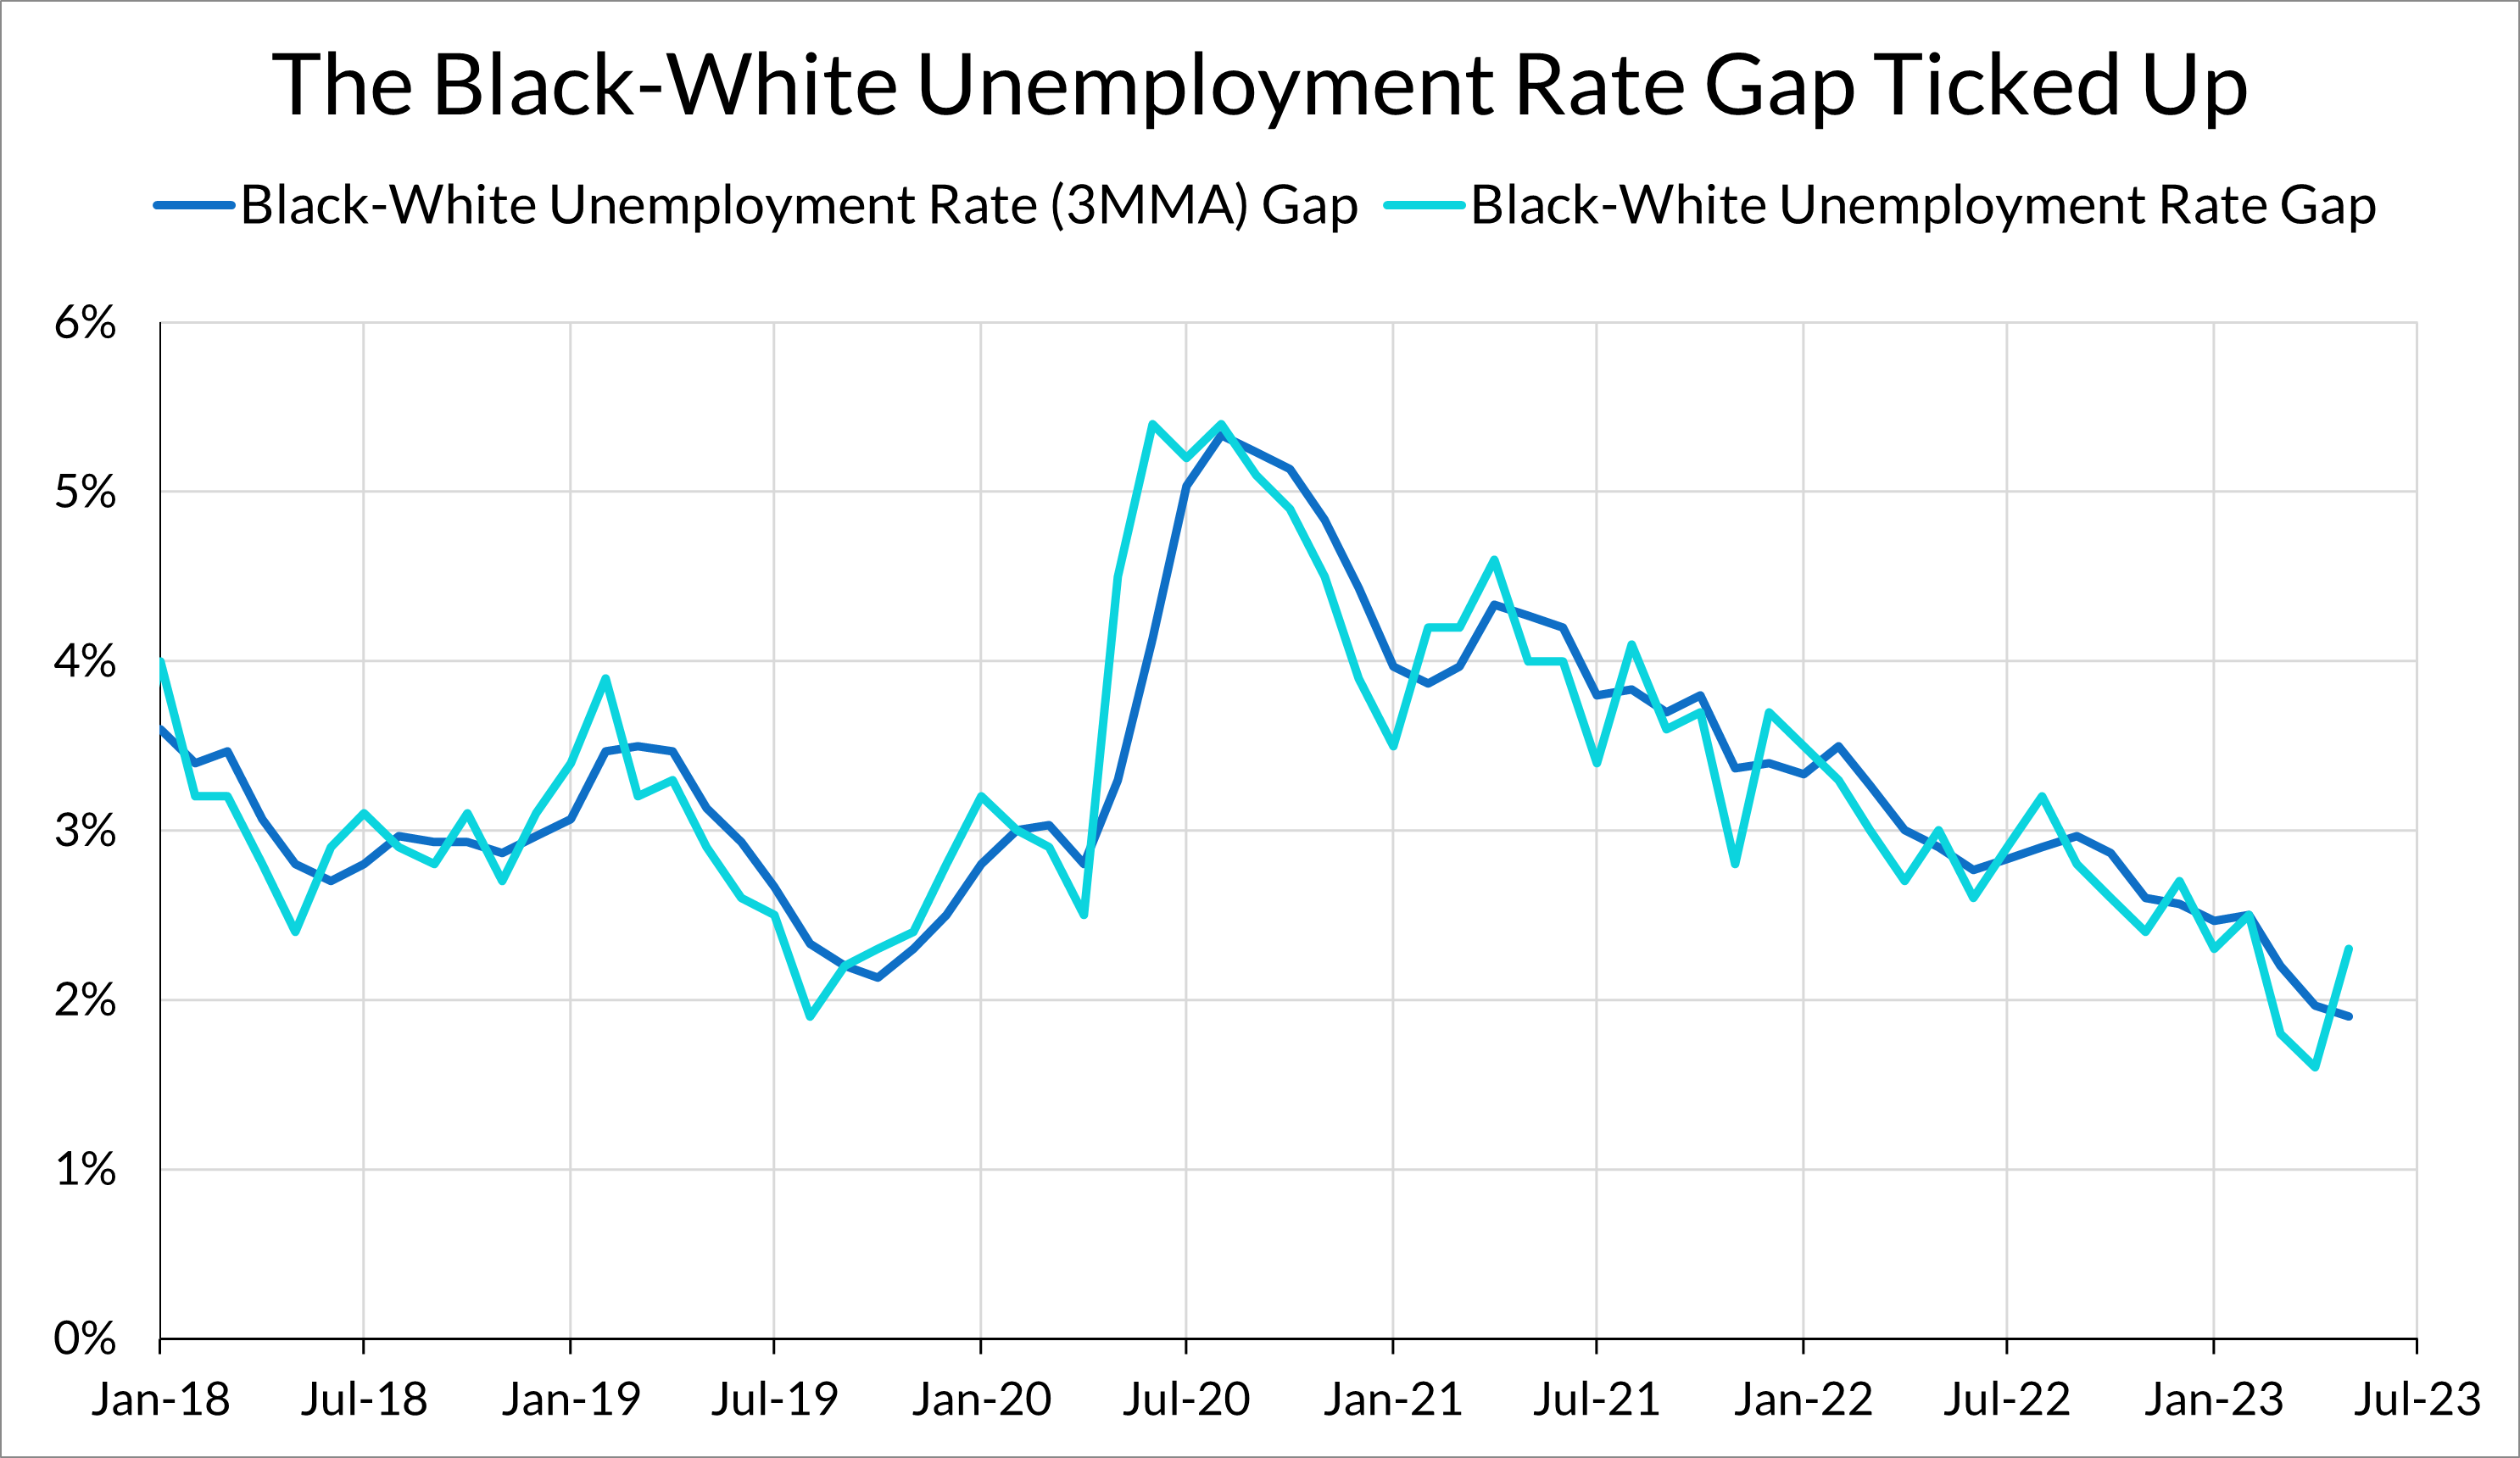
Second, the rise in the unemployment rate this month was largely due to an increase in black unemployment. The black unemployment rate rose from 4.6% to 5.6%. This is a very sharp increase, but in historical context the black unemployment rate is still very low and this series is volatile from month to month. A continued increase in this series would be cause for concern, and a reminder that tight labor markets disproportionately benefit marginalized workers. Calls to “soften the labor market” will likely fall on groups that are traditionally least attached to the labor market.
The base case in our jobs preview was for a June “skip” and a July hike. Today’s jobs report, with an increase in the unemployment rate, an increase in permanent job losers, and a fall in average hourly earnings retains that base case. The conflicting signals from the headline establishment and household survey will likely encourage the Fed to take a wait-and-see approach during the next meeting while signaling the possibility of further rate increases. However, the strong establishment survey and the still-relatively-high wage growth numbers mean that a second hold in July looks less likely.
Over the past few months, the labor market has been on a slow trajectory to what looks a lot like the labor market in 2019 after a spurt of labor market churn, sectoral reallocation, and wage growth concentrated at the low-end. All of those trends appear to be renormalizing back to pre-pandemic levels, but additional Fed tightening would risk giving back some of the gains we saw during this recovery.