Core-Cast is our nowcasting model to track the Fed's preferred inflation gauges before and through their release date. The heatmaps below give a comprehensive view of how inflation components and themes are performing relative to what transpires when inflation is running at 2%.
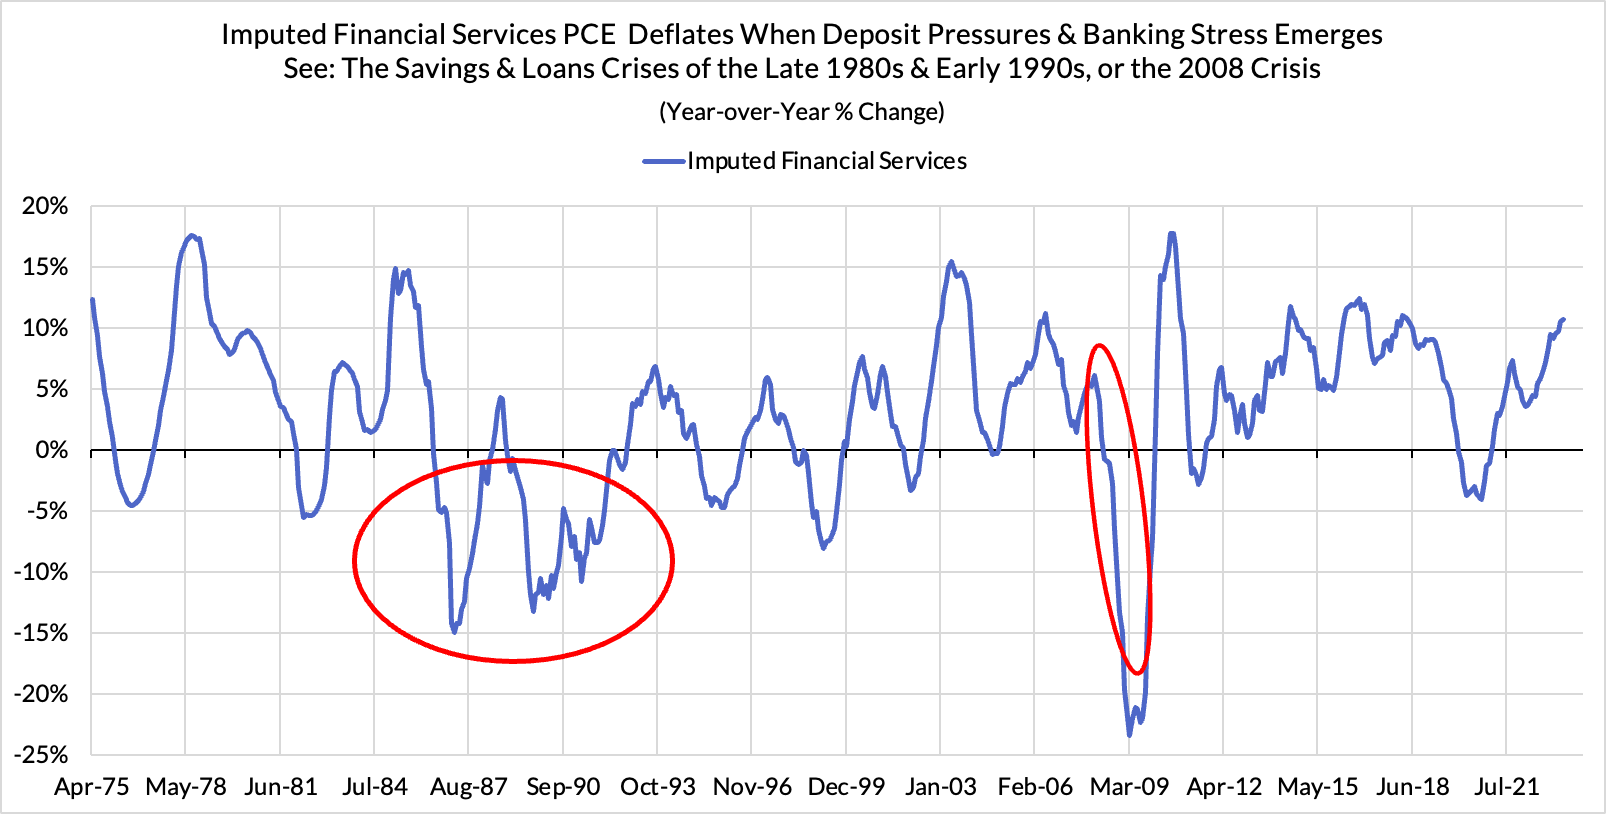
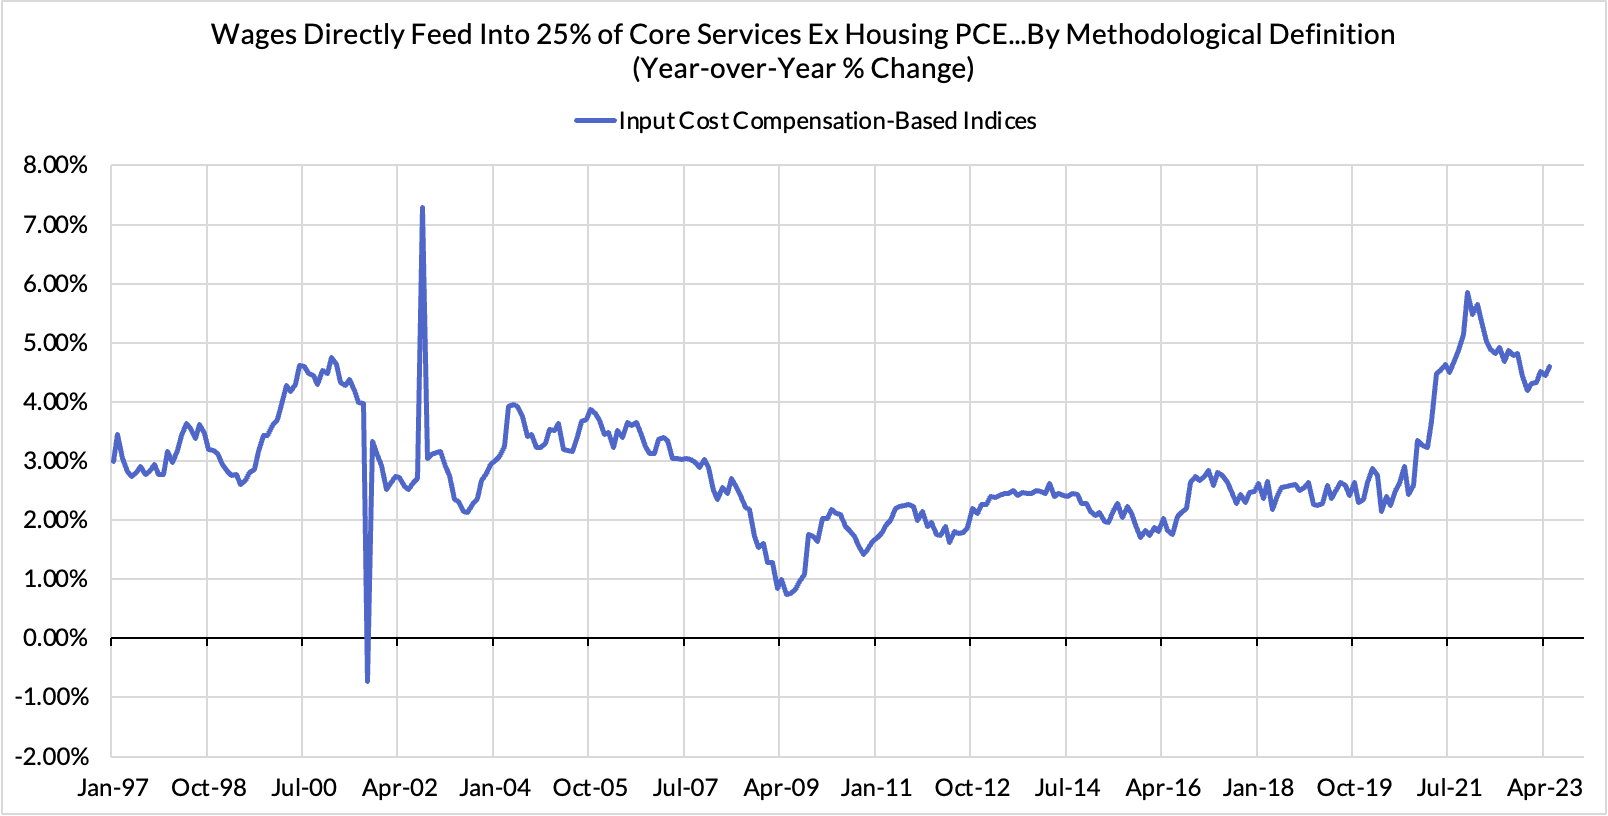
Today and yesterday's data served to confirm what we've been tracking in our nowcasts. The "dark spaces" of PCE (imputed financial services, input cost indices) did not have much impact on our projected year-over-year readings, with some of the Q1 upside revised down but still looking a little stronger over the past two months. Our core PCE and core services ex housing PCE nowcasts were within 1 basis point of what transpired on a monthly basis (headline PCE growth fell further vs our nowcast due to spending composition shifts). Right now a July hike remains everyone's base case (including ours) but there is a "shoot the moon" scenario where—if June CPI and PPI breaks perfectly—the Fed may consider punting a July hike into September.
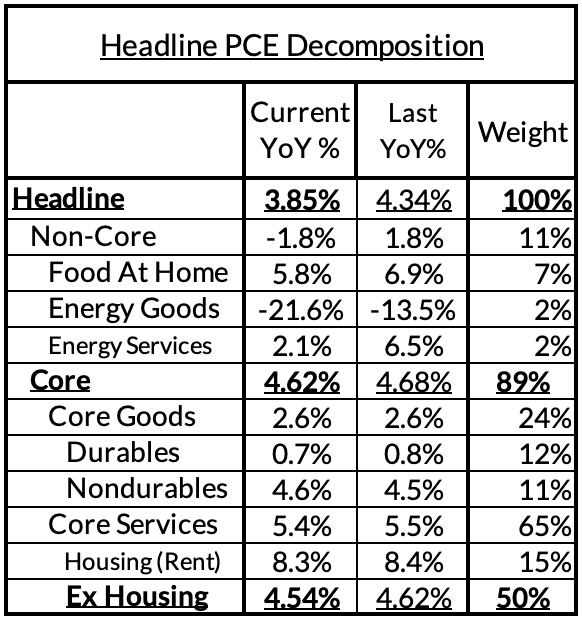
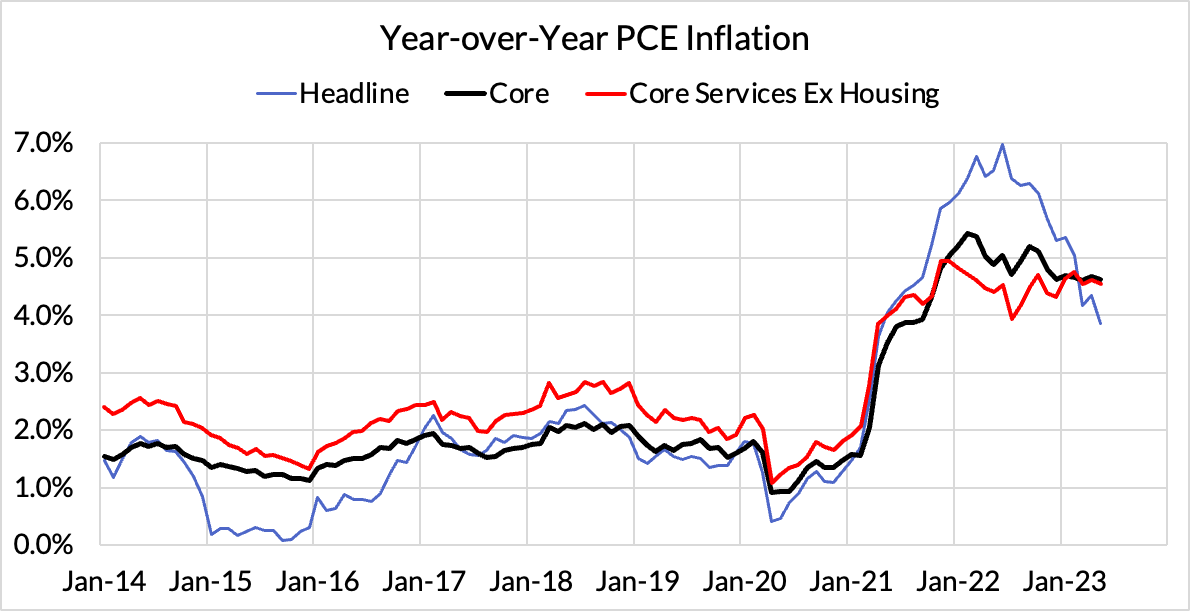
Headline PCE fell, from 4.34%* year-over-year in April to 3.85% in May. (0.13% monthly increase, relative to the 0.23% nowcast). *Revisions pushed down year-over-year readings from 4.36% to 4.34% for April.
Core PCE fell, from 4.68%* year-over-year in April to 4.62% in May (0.31% monthly increase relative to our latest 0.30% monthly nowcast). *Revisions push down year-over-year readings from 4.70% to 4.68% for April.
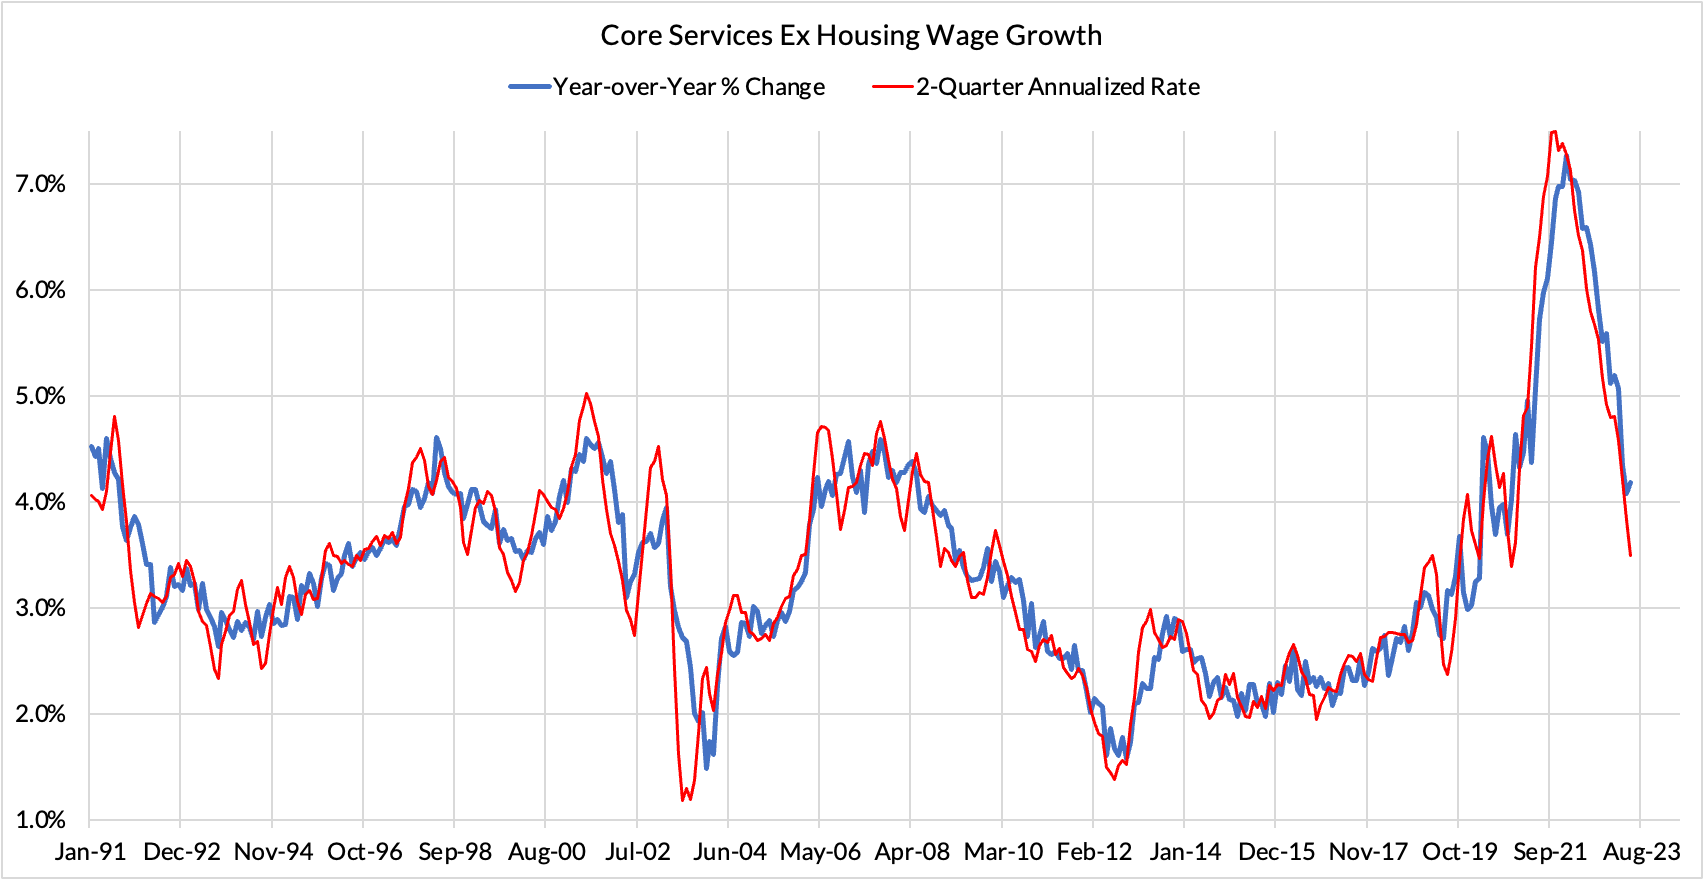
Core Services Ex Housing PCE (CSXHP) fell, from 4.62%* year-over-year in April to 4.54% in May. (0.23% monthly increase, relative to our latest 0.22% monthly nowcast). *Revisions push down April year-over-year readings from 4.65% to 4.62%. When core PCE is running at 2%, CSXHP typically runs at 2.68%. The current overshoot is effectively 197 basis points.
hese numbers get revised aggressively. So take current trajectory w/ grain of salt. These numbers get revised aggressively. So take current trajectory w/ grain of salt.
Even as wages are decelerating in the sectors that feed into "Core Services Ex Housing Consumption" activities, the scope for broader price relief has yet to substantially show. Chair Powell's most recent remarks suggest a pivot from a view of inflation driven primarily by labor costs in any direct sense. That would seem to be more reconcilable with what the data more obviously indicates right now.
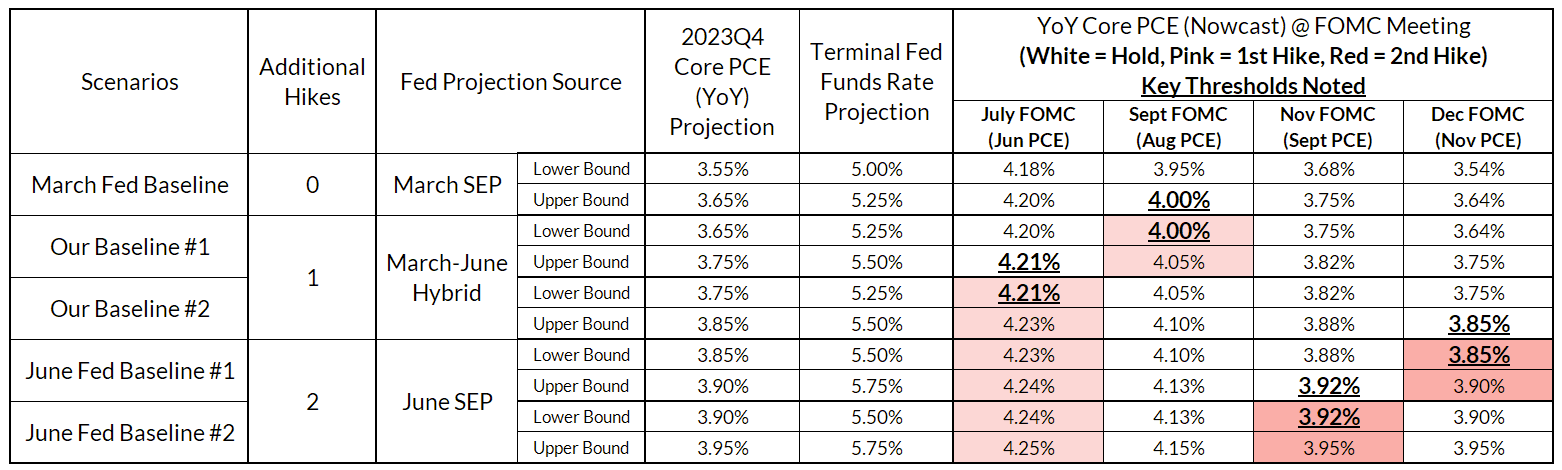
In the context of the State Space we released to Premium Donors that we laid out on Wednesday, we would likely need to see CPI and PPI imply a core PCE reading below 0.228% (4.20% year-over-year) to at least open the discussion to a July hold.
To make a July hold a more clear-cut prospect, June CPI and PPI would likely need to imply 0.180% (4.15% year-over-year). Both outcomes seem like a reach at this stage, but there are a sufficient number of idiosyncratic downside risks for June inflation that can drive that outcome (all we're saying is don't write the scenario off completely just yet).
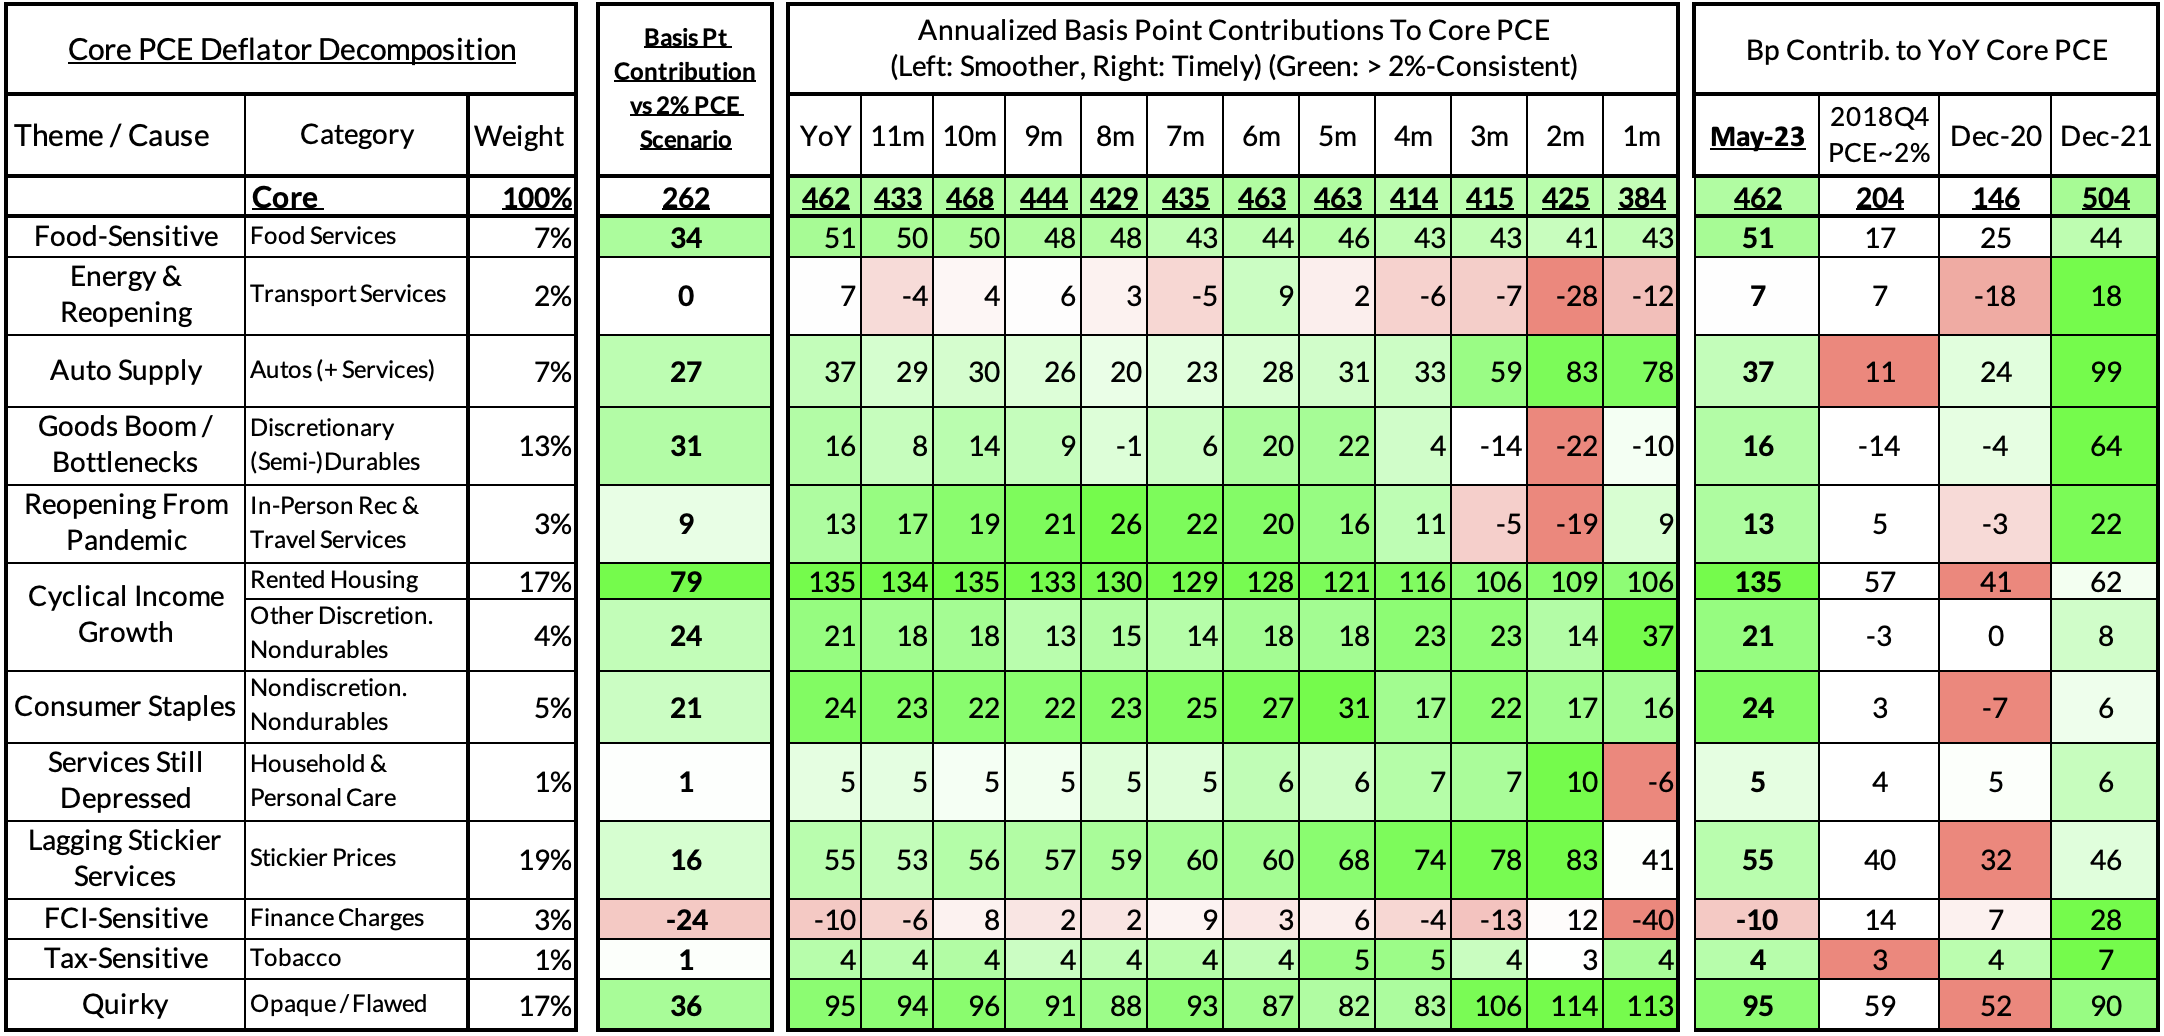
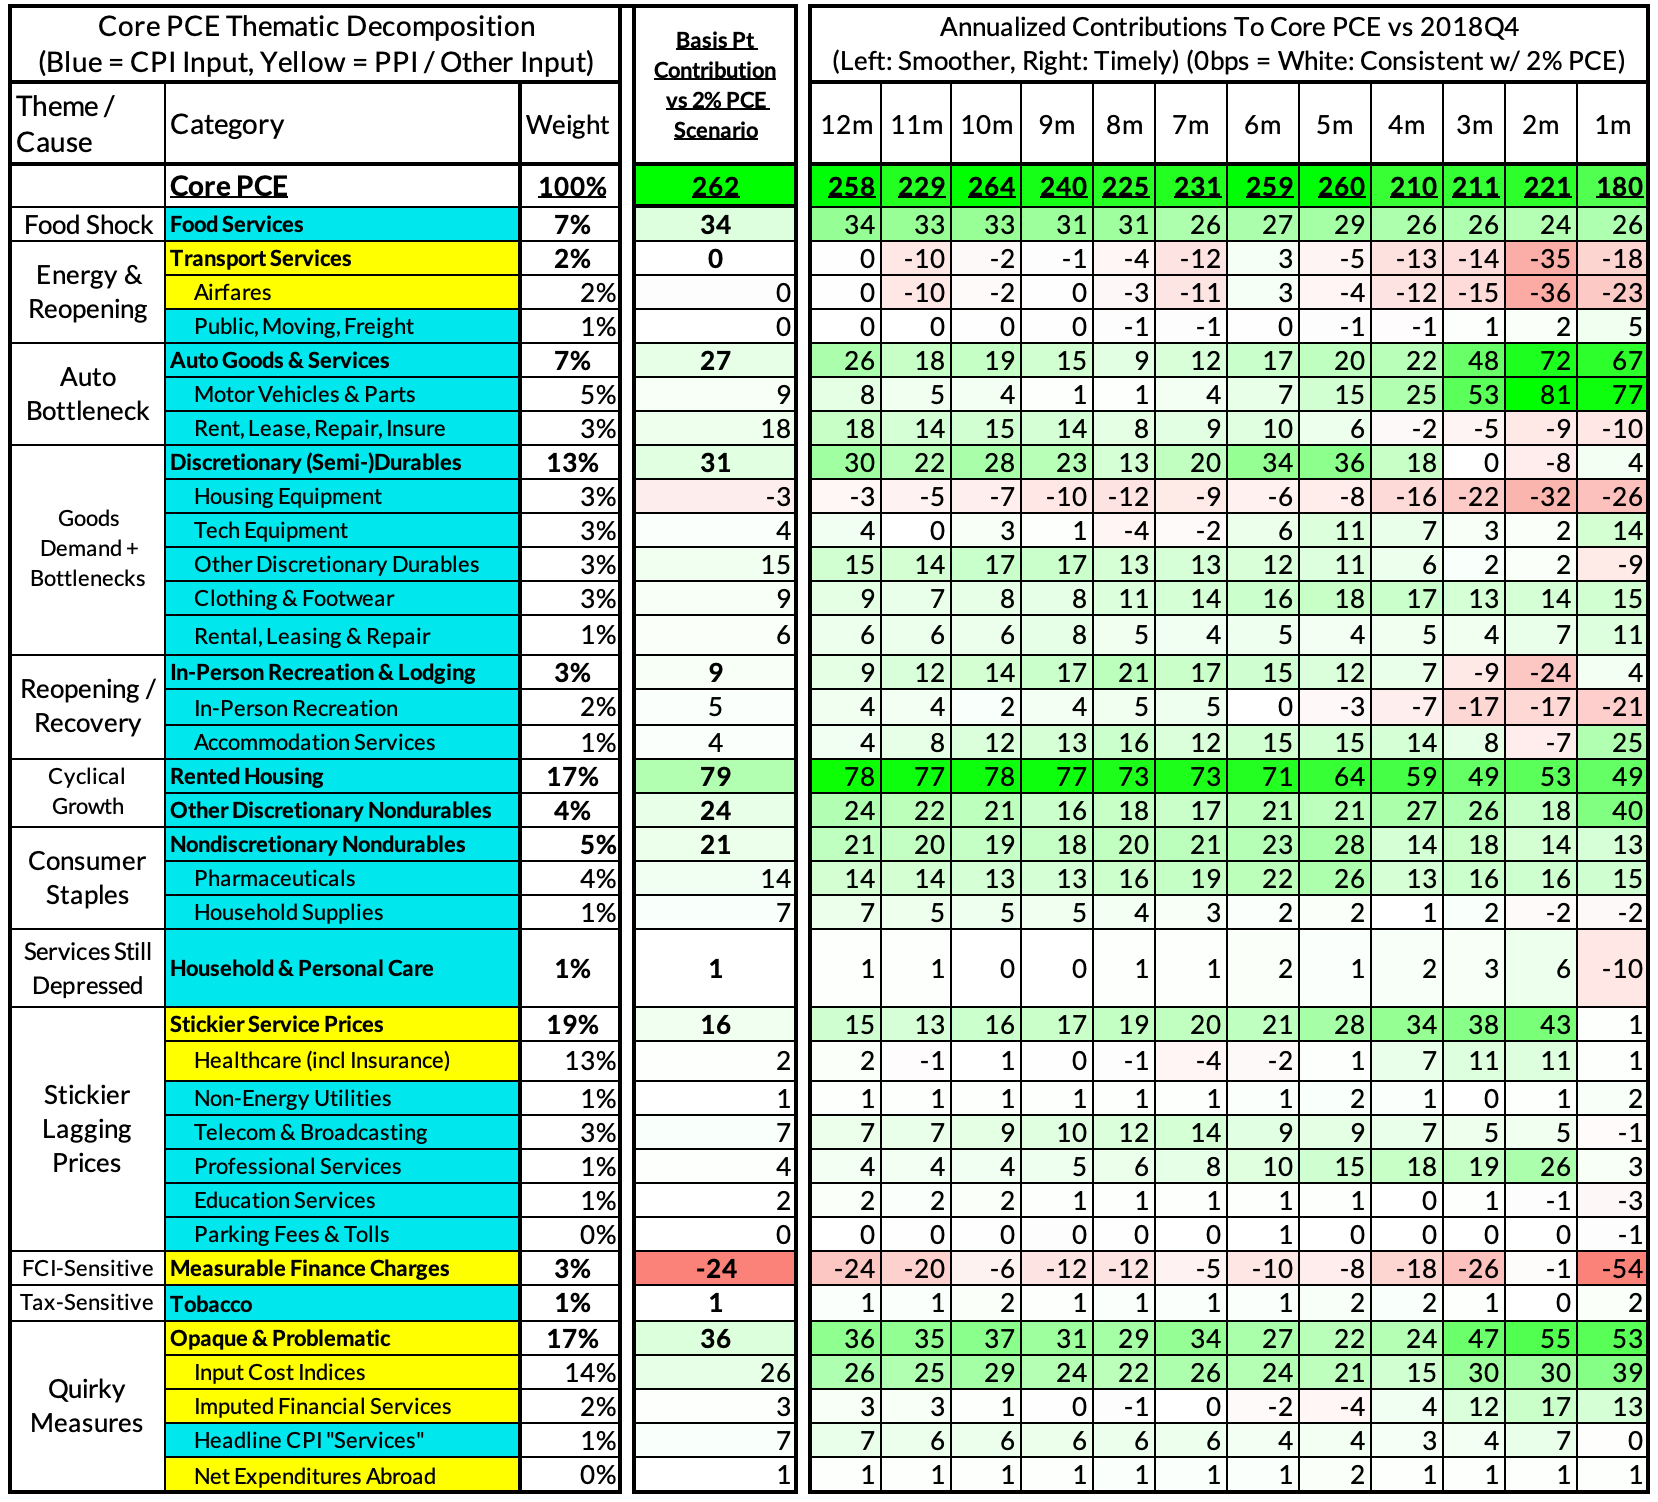
For the Detail-Oriented: Core PCE Heatmaps
Right now Core PCE (PCE less food products and energy) is running at 4.62% as of May, 262 basis points above the Fed's 2% inflation target for PCE. That overshoot is disproportionately driven by catch-up rent CPI inflation in response to the surge in household formation (a byproduct of rapidly recovering job growth) and market rents in 2021-22. Rent is contributing 79 basis points to the 262 basis point core PCE overshoot.
There are other contributors to the overshoot, some more supply-driven (automobile bottlenecks likely explain 27 basis points, while food inputs likely added 34 basis points to the overshoot), some more demand-driven (in-person recreation and travel services adding 9 basis points to the overshoot, consumer staples and discretionary nondurables adding 45 basis points).
The final heatmap here gives you a sense of the overshoot on shorter annualized run-rates. April monthly annualized core PCE yielded a 180 basis point overshoot vs 2% target inflation (3.80% annualized).
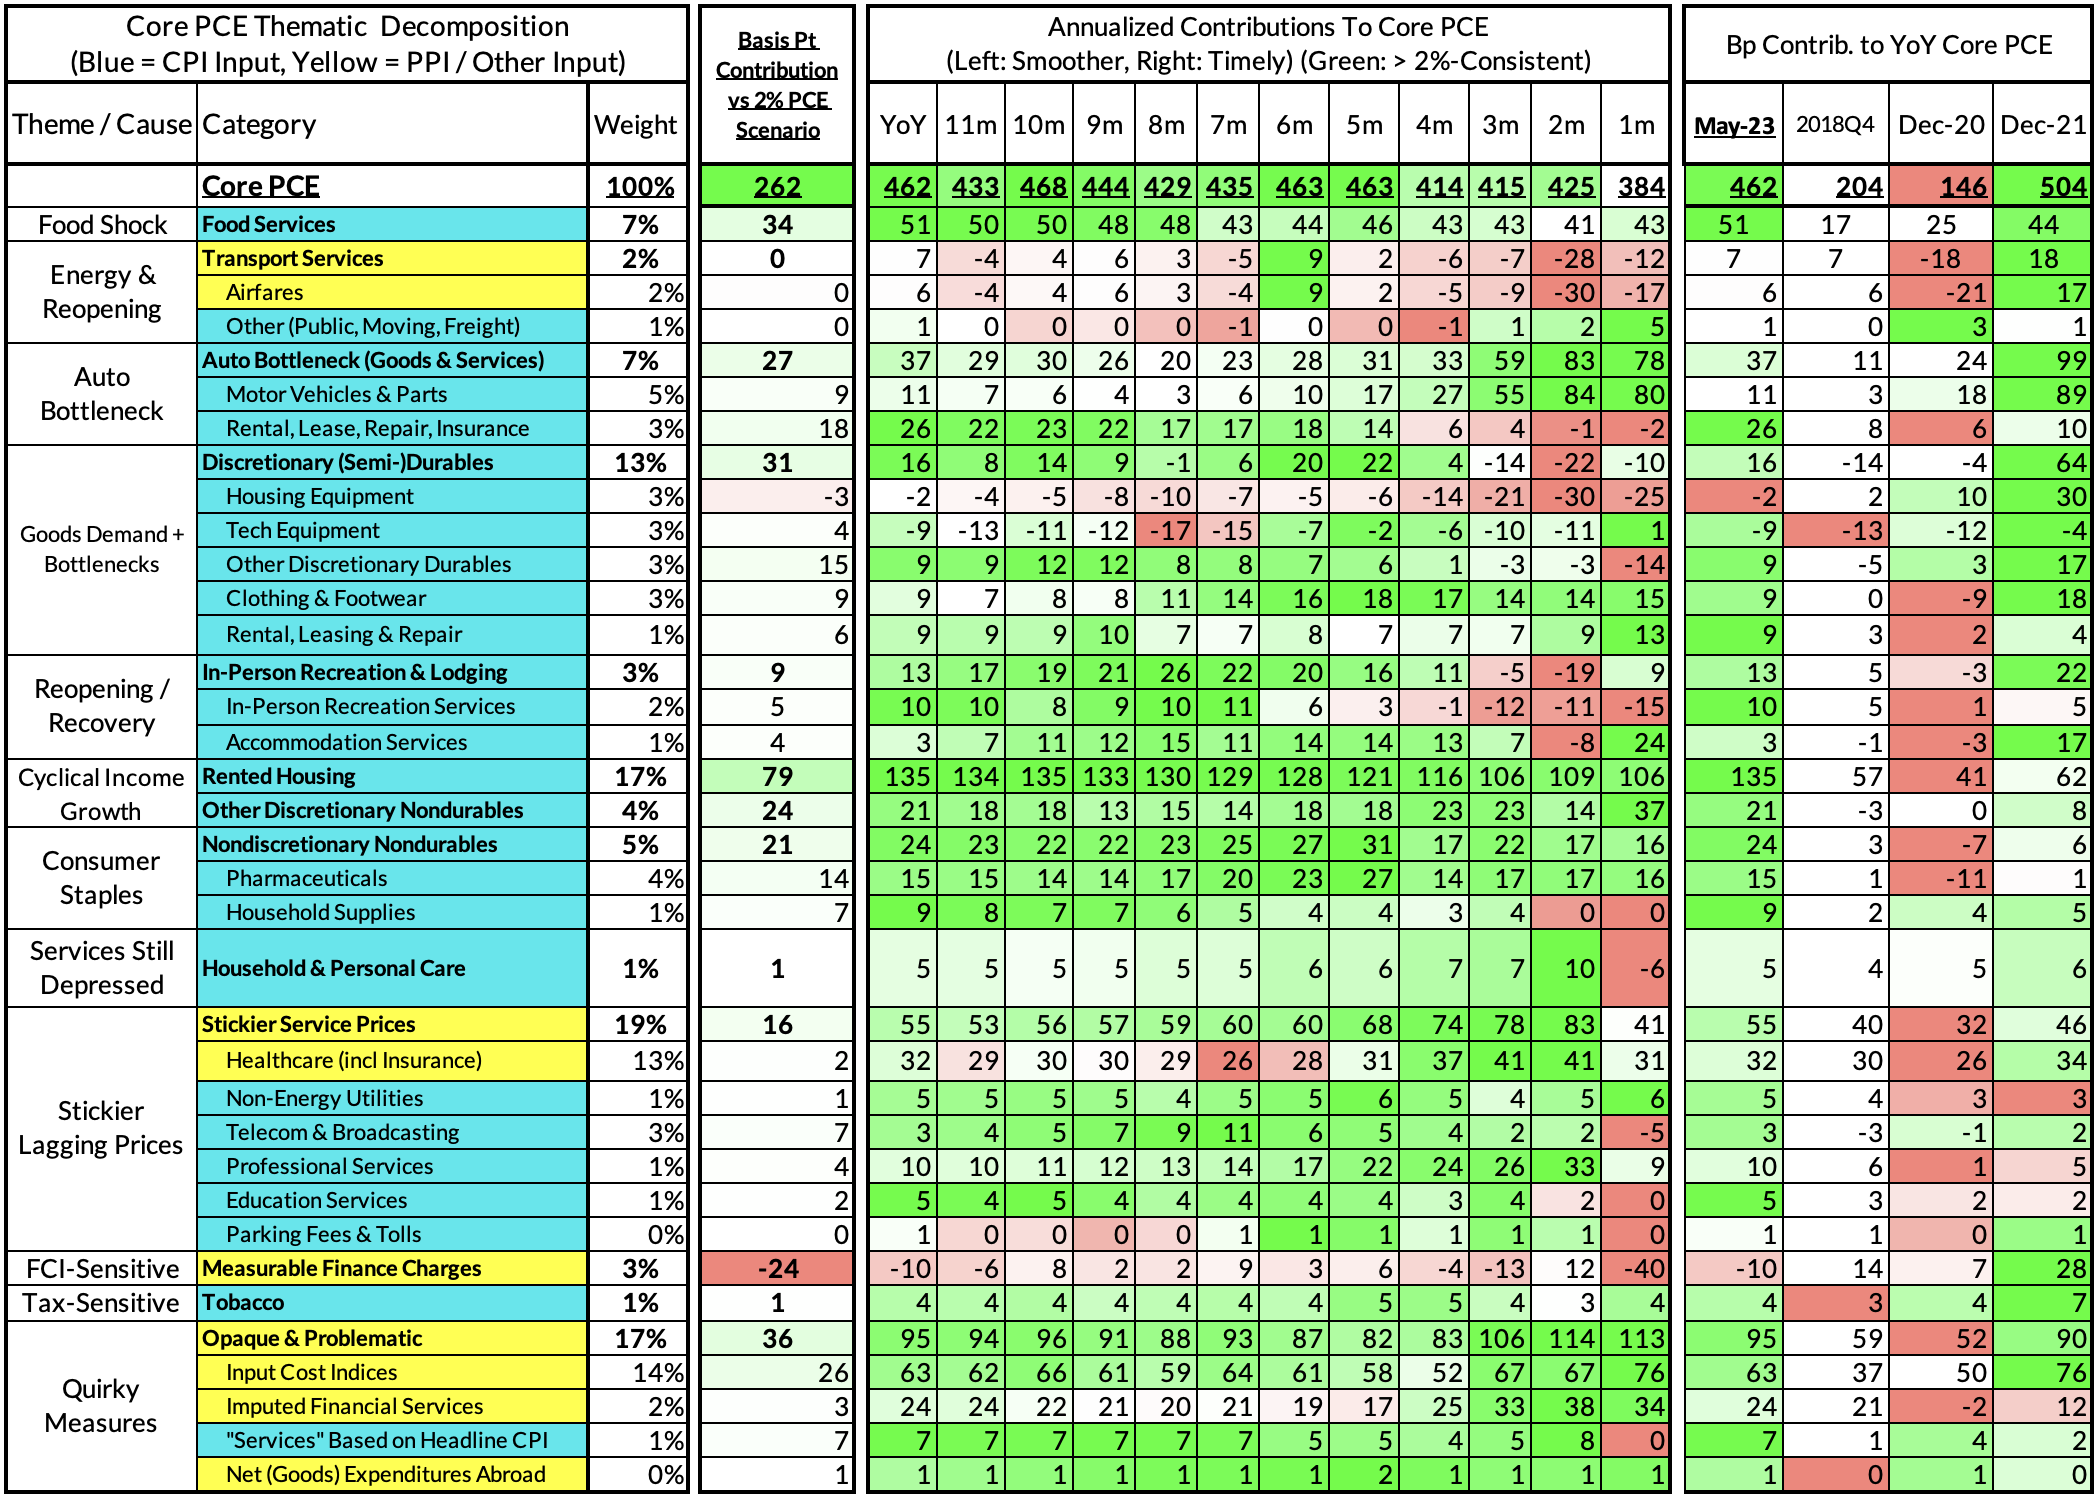
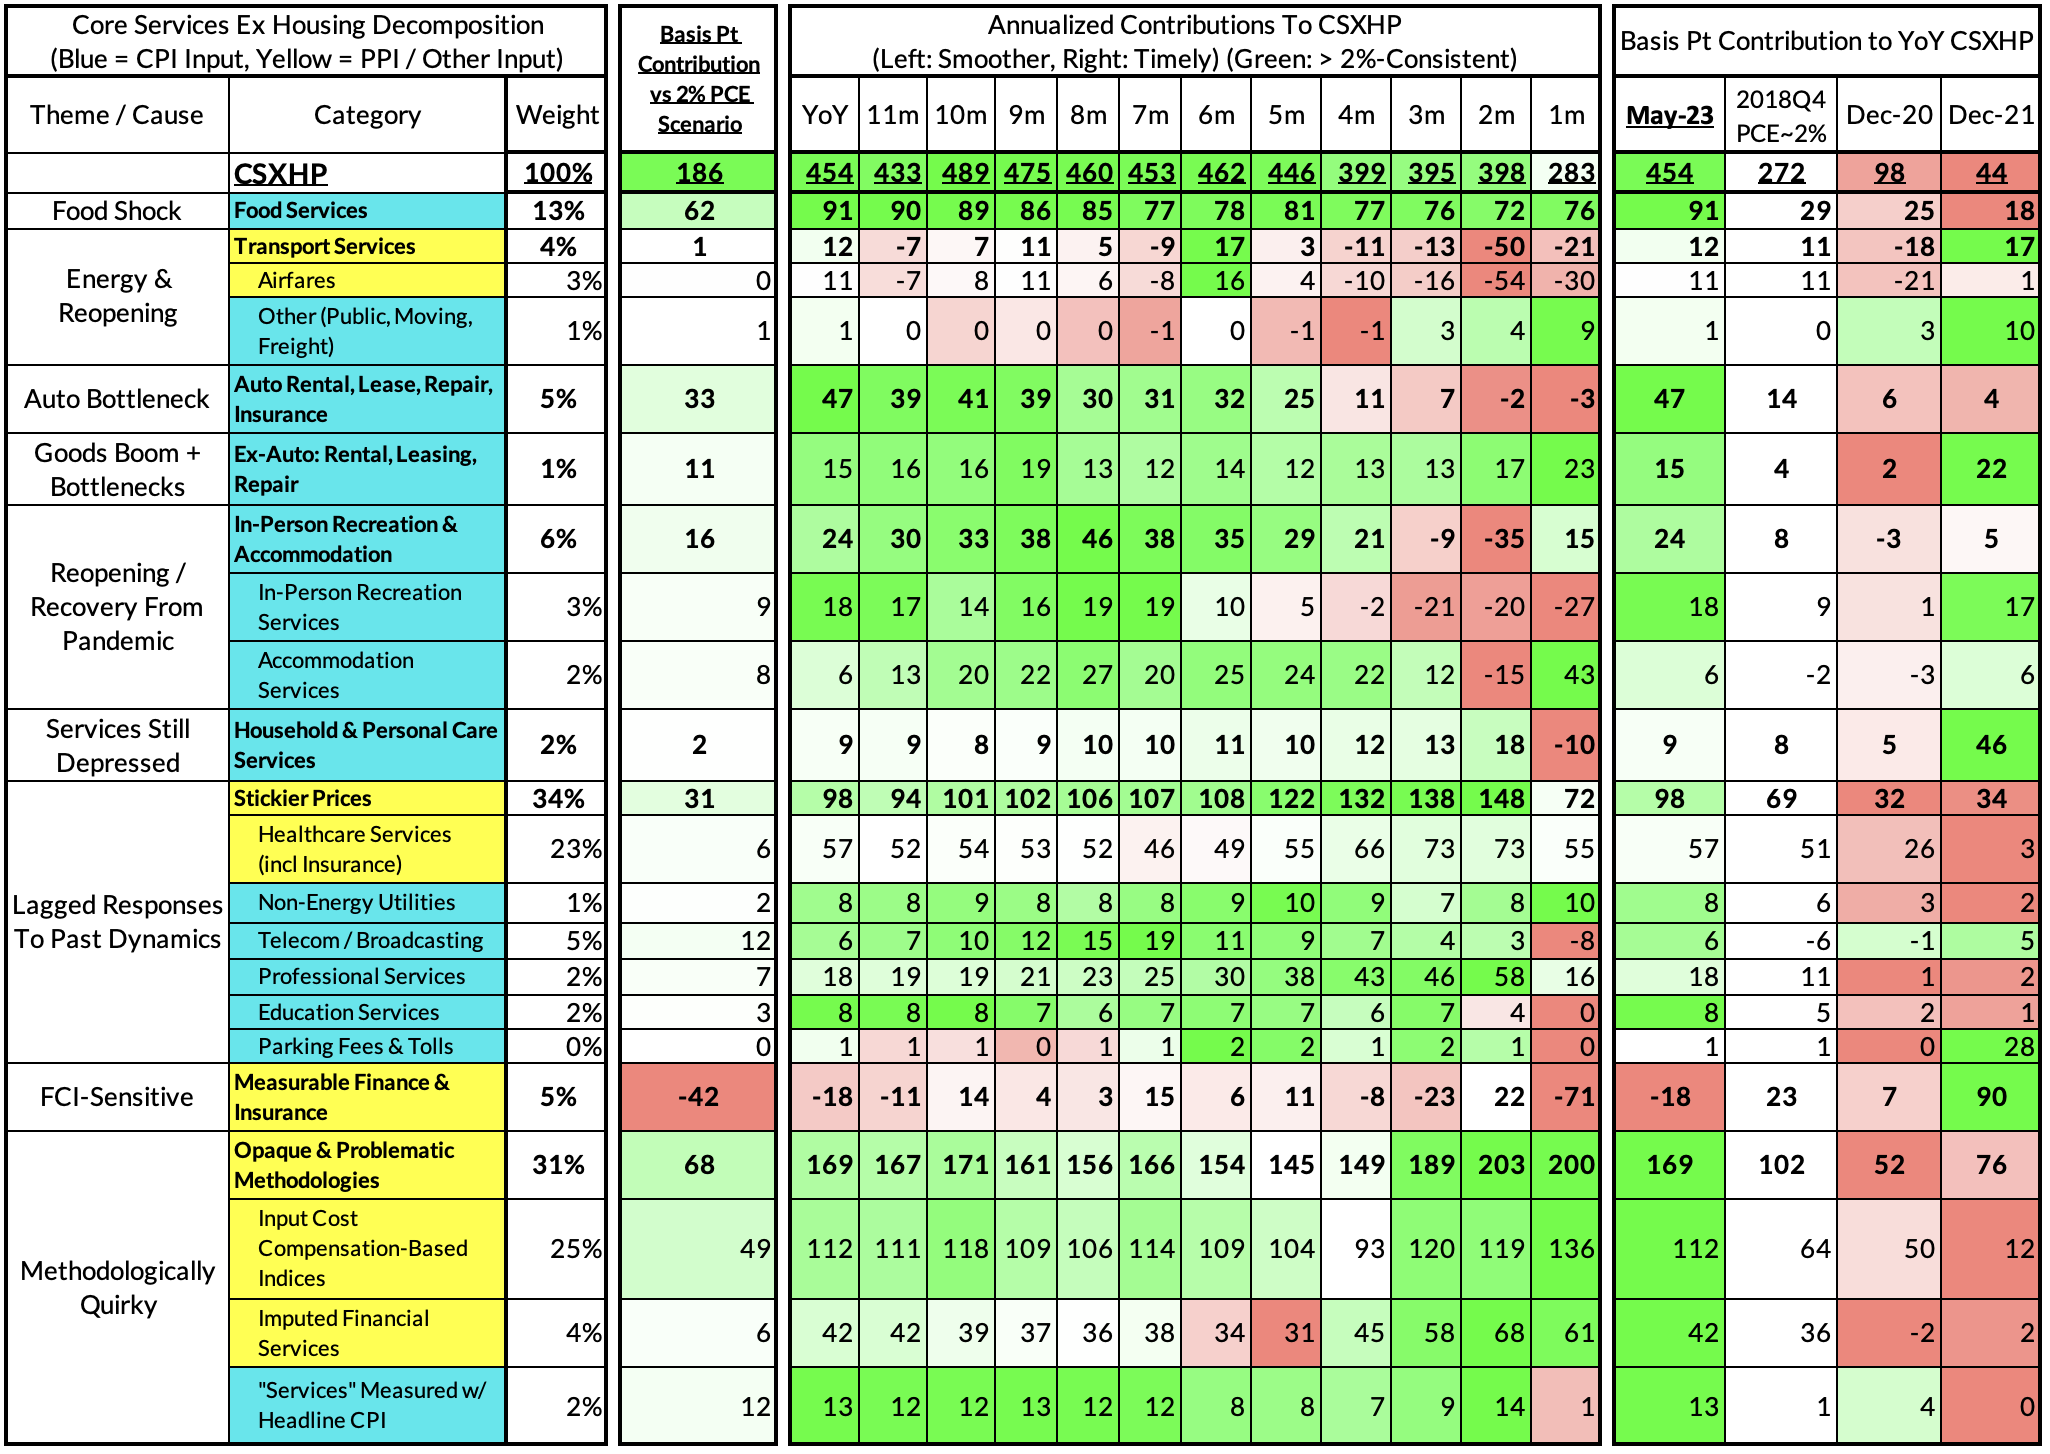
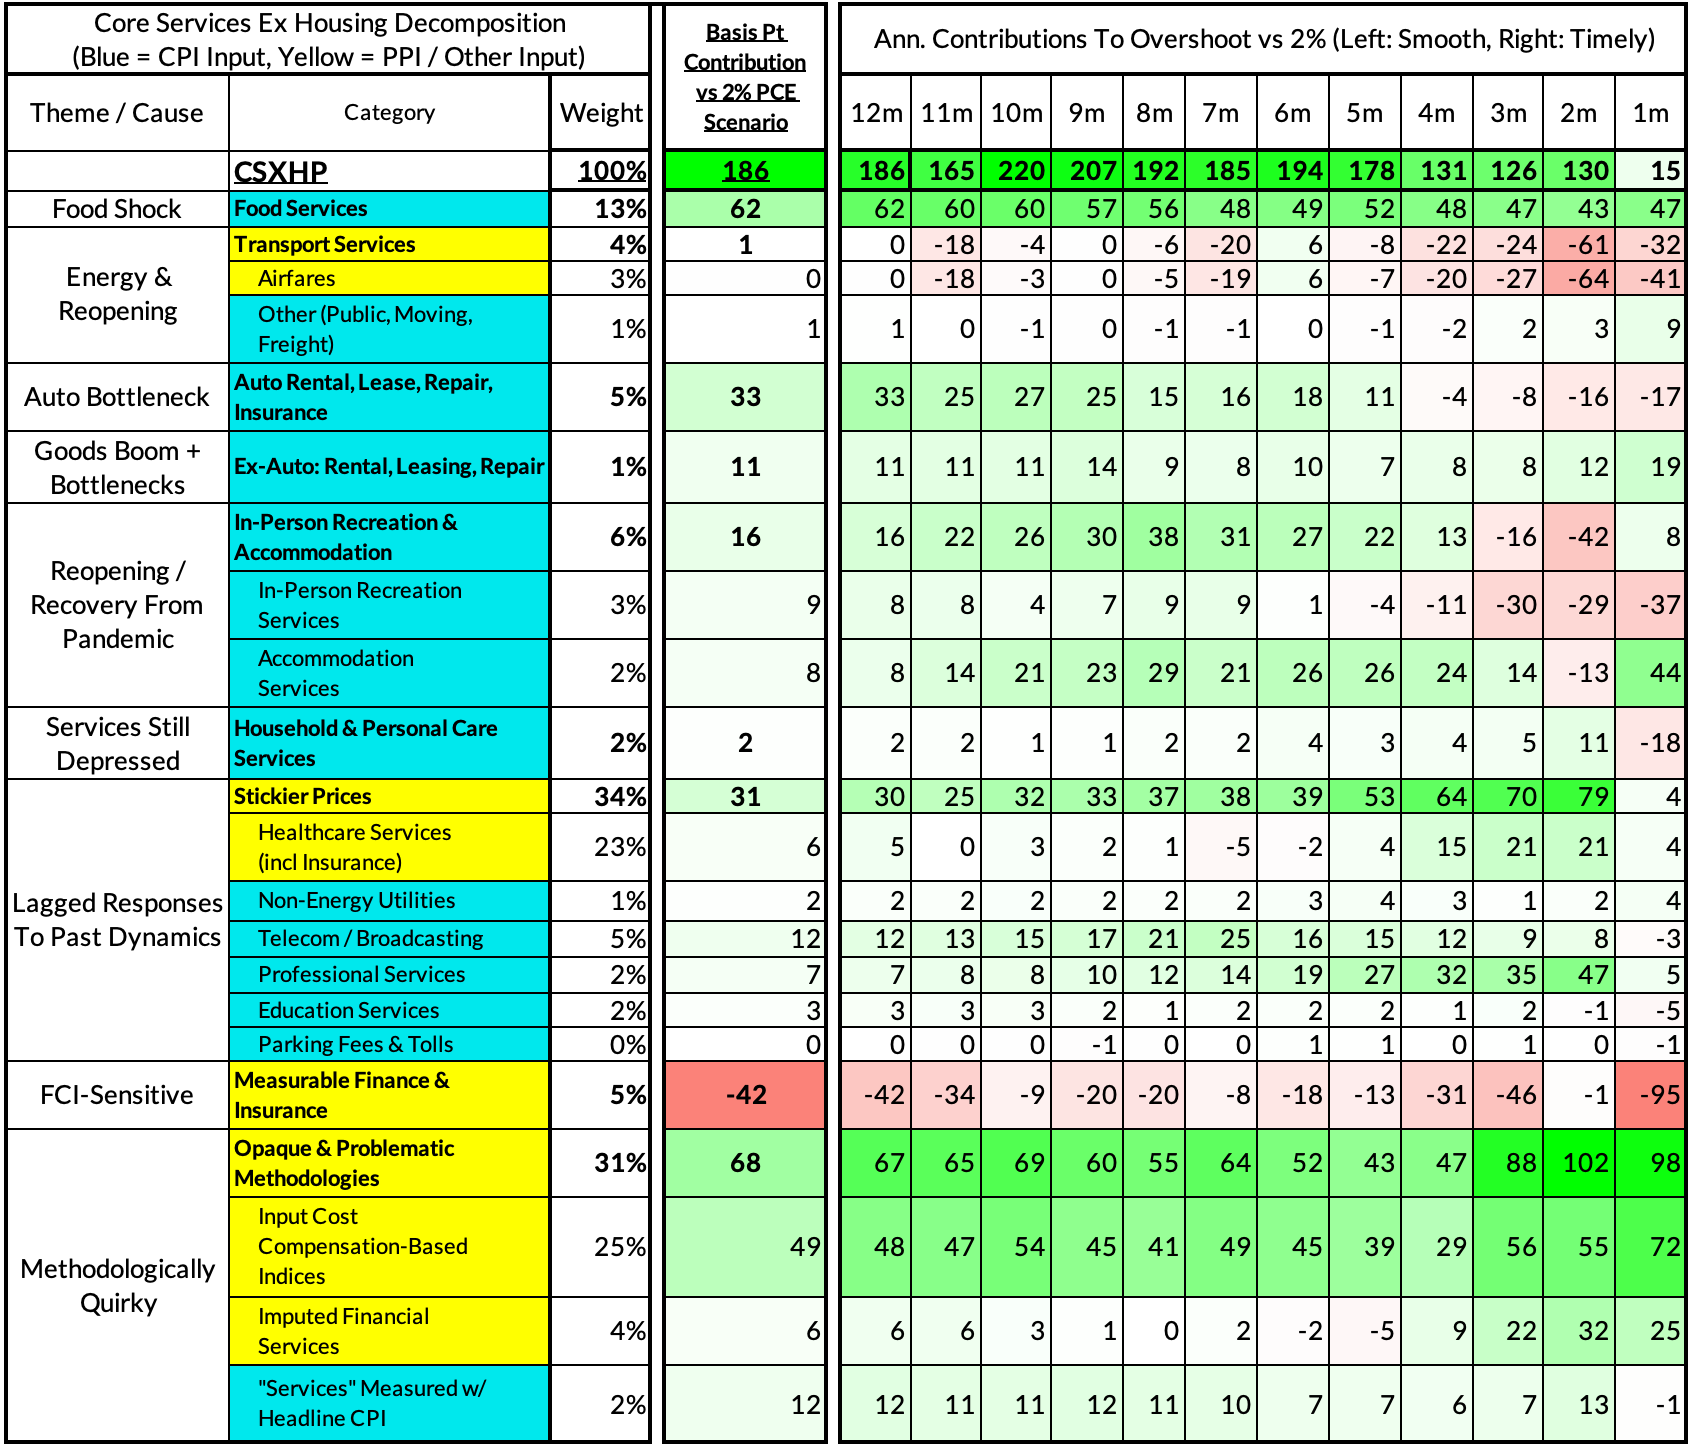
For the Detail-Oriented: Core Services Ex Housing PCE Heatmaps
The May growth rate in "Core Services Ex Housing PCE" ran at 4.54% year-over-year, a 186 basis point overshoot versus the 2.68% run rate that coincided with ~2% headline and core PCE in 2018Q4.
April monthly CSXHP ran at a 2.83% monthly annualized rate, a mere 15 basis point overshoot of what would be consistent with 2% headline and core PCE.
The link has been copied!
Your link has expired. Please request a new one.
Your link has expired. Please request a new one.
Your link has expired. Please request a new one.
Great! You've successfully signed up.
Great! You've successfully signed up.
Welcome back! You've successfully signed in.
Success! You now have access to additional content.