Core-Cast is our nowcasting model to track the Fed's preferred inflation gauges before and through their release date. The heatmaps below give a comprehensive view of how inflation components and themes are performing relative to what transpires when inflation is running at 2%.
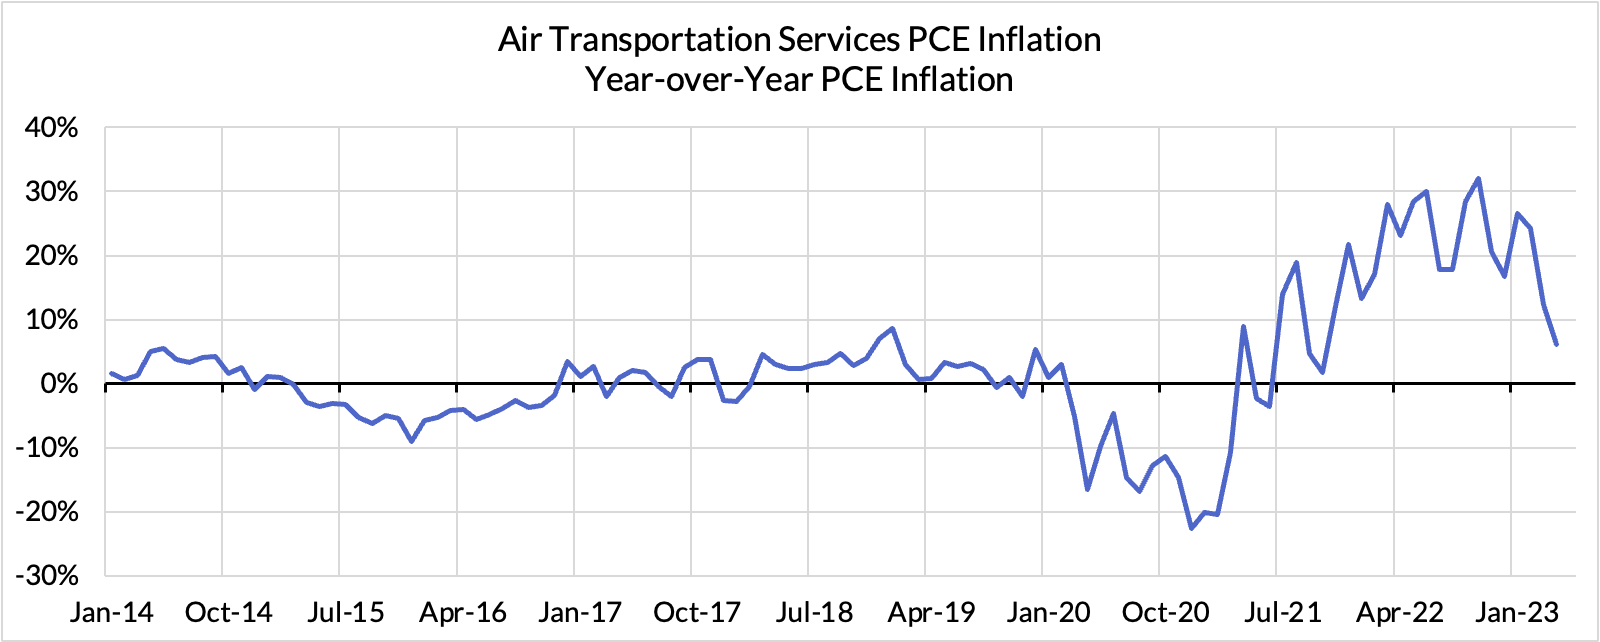
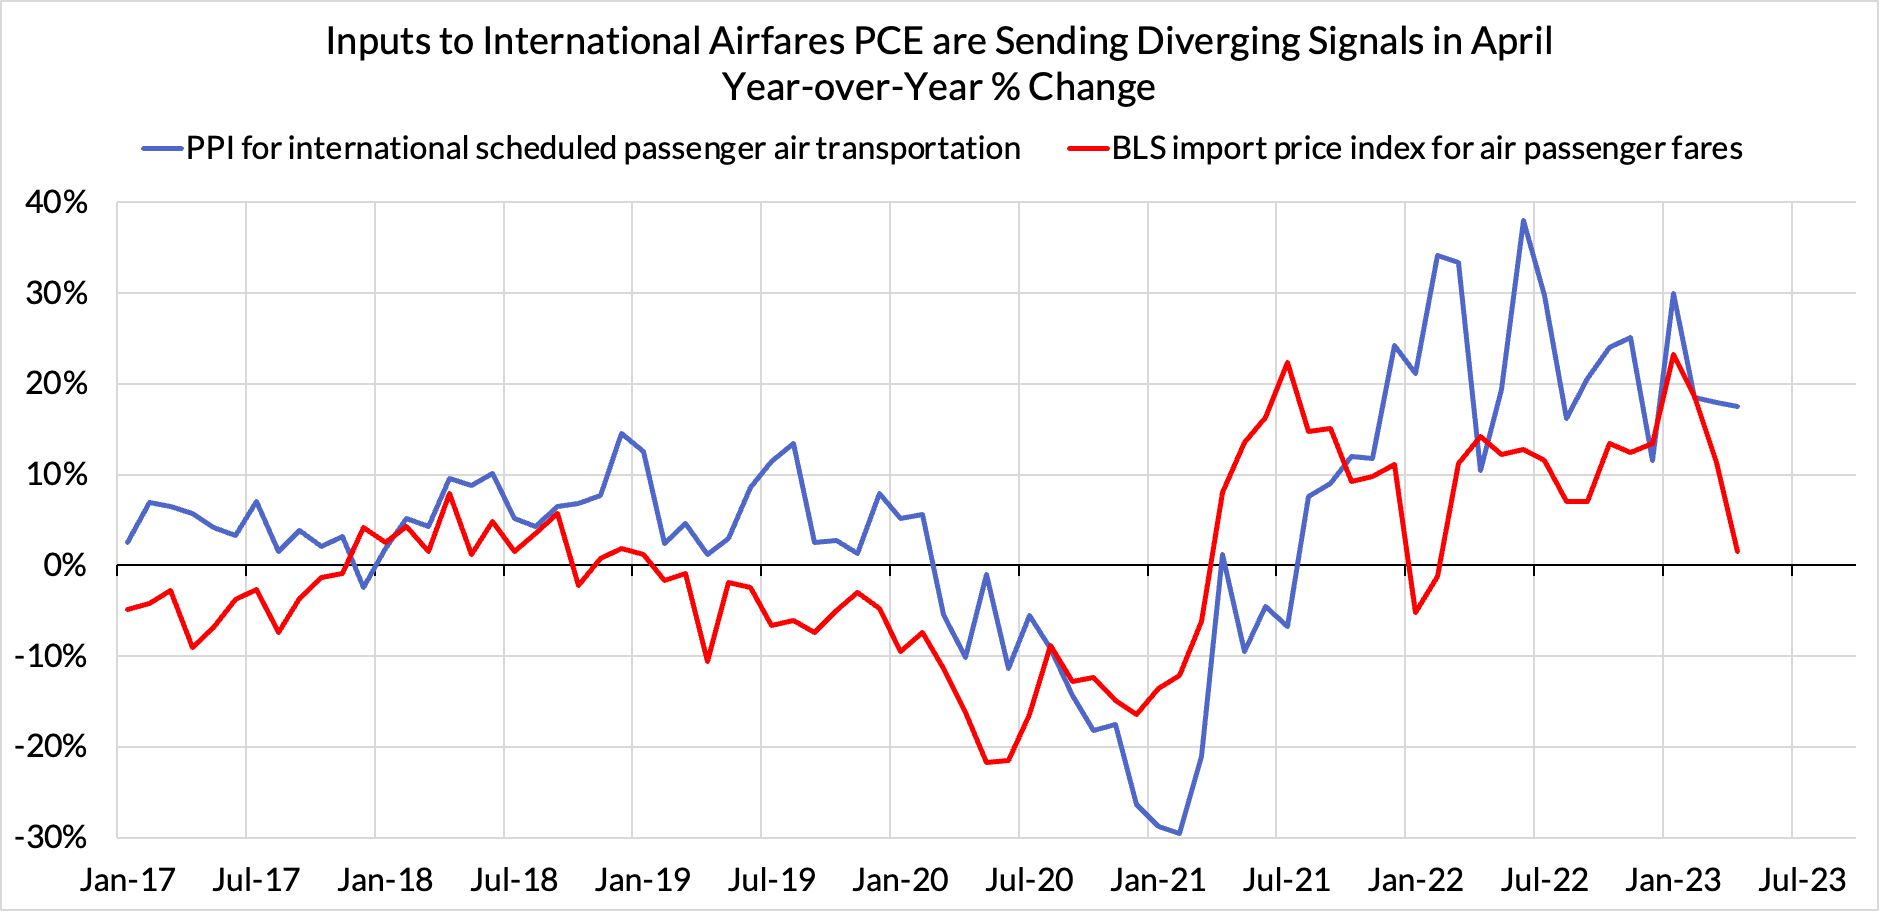
Yesterday's PPI release seemed to squash the short-term promise the April CPI release held for a slower April PCE. But as noted in yesterday's note, the import price data for airfares likely had unique leverage in the context of the PPI data. And so it did: import prices for international airfares fell 5.4% month-over-month (NSA) and are now up only 1.5% year-over-year. Contrast that with the international airfare PPI data, which fell 1.2% month-over-month (NSA) and are still up 17.5% year-over-year. This data changes our nowcasts quite noticeably, and we maintain our view that there are downside risks on the day of the PCE release relative to what we embed in our nowcasts, thanks to rising deposit rates.
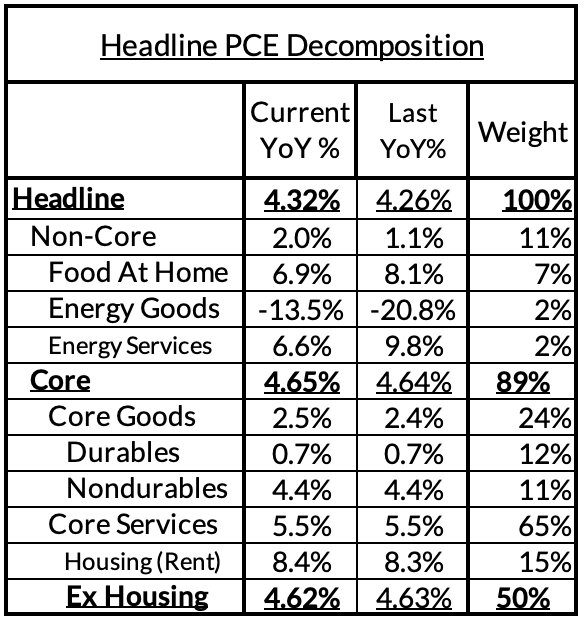
Headline PCE is on track to rise, from 4.26%* year-over-year in March to 4.32% in April. (0.26% monthly increase, revised down from yesterday's 0.30% nowcast). *PPI revisions push up year-over-year readings from 4.16% to 4.26% for March.
Core PCE is now on track to stay flat, from 4.64%* year-over-year in March to 4.65% in April (0.33% monthly increase, revised down from yesterday's 0.38% monthly increase). Our cautionary notes about the importance of PPI bore fruit. *PPI revisions will push up year-over-year readings from 4.60% to 4.64% for March.
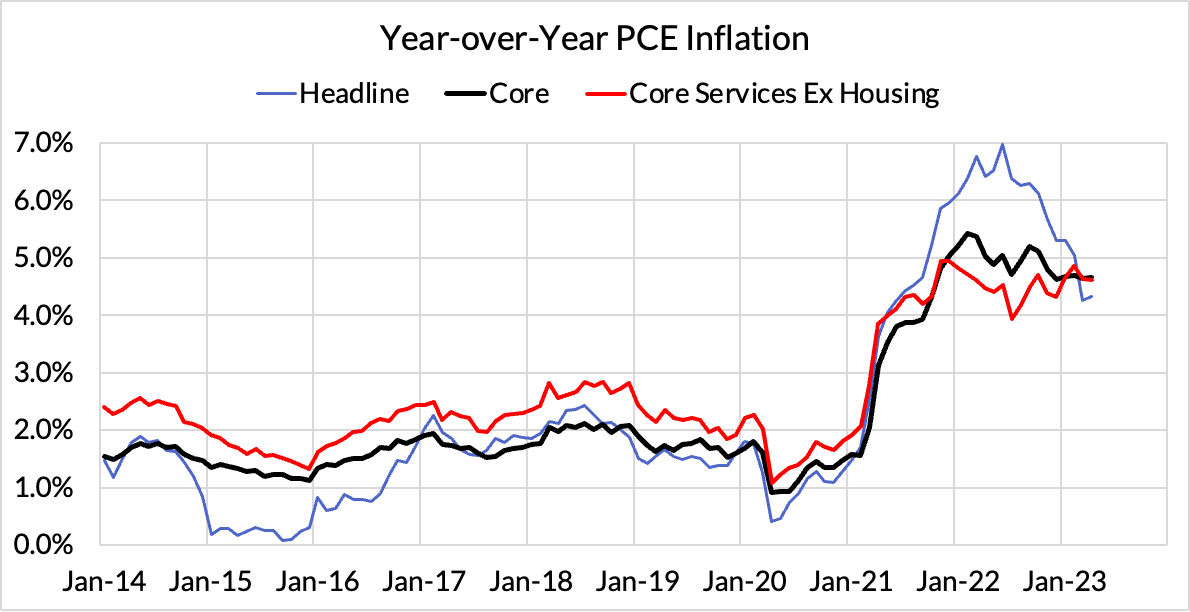
Core Services Ex Housing PCE (CSXHP) is now on track to stay flat, from 4.63%* year-over-year in March to 4.62% in April. (0.33% monthly increase, revised down from yesterday's 0.42% nowcast). *PPI revisions push up March year-over-year readings from 4.52%. We would still caution that the combination of revised consumption weights and the 'dark spaces' of PCE can still lead to decent shifts with where are nowcast is tracking. When core PCE is running at 2%, CSXHP typically runs at 2.68%. The current overshoot is effectively 194 basis points (195 basis points as of March).
This estimate combines all airfare PCE components and all PPI and Import Price source data