September Core-Cast Post-PCE: Soft ECI Tea Leaves, Core PCE Still Poised To Underperform Fed Projections

Core-Cast is our nowcasting model to track the Fed's preferred inflation gauges before and through their release date. The heatmaps below give a comprehensive view of how inflation components and themes are performing relative to what transpires when inflation is running at 2%.
Most of the Personal Consumption Expenditures (PCE) inflation gauges are sourced from Consumer Price Index (CPI) data, but Producer Price Index (PPI) input data is of increasing relevance, import price index (IPI) data can prove occasionally relevant. There are also some high-leverage components that only come out on the day of the PCE release. Reach out to us if you would like to become a Premium Donor to support and access all of our research content.
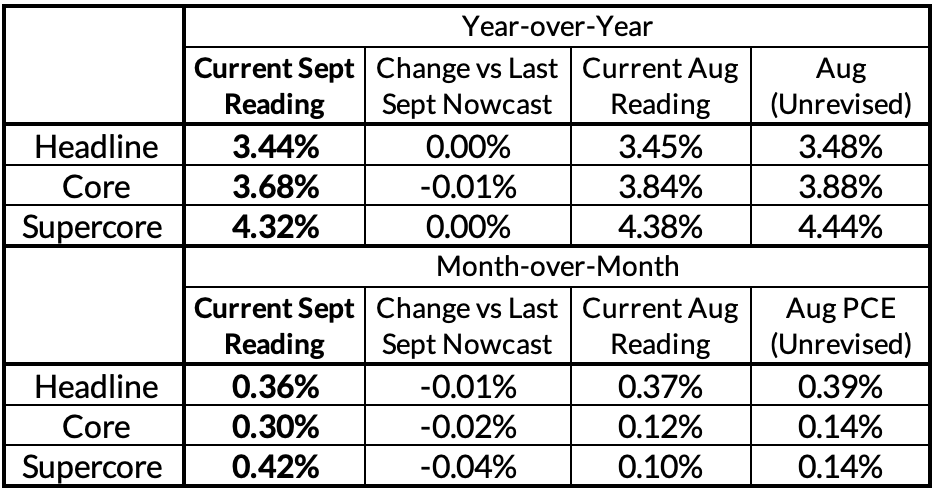
There was very little in the final PCE readings that we did not already know yesterday, or even after the CPI and PPI data was released. We did see that some of the "dark spaces" of PCE showed a different allocation of price changes across the months of Q3 than what we nowcasted. But those minor forecasting errors add up to a whopping 1 basis point downward revision to Core PCE year-over-year relative to yesterday and right in line with what we nowcasted previously.
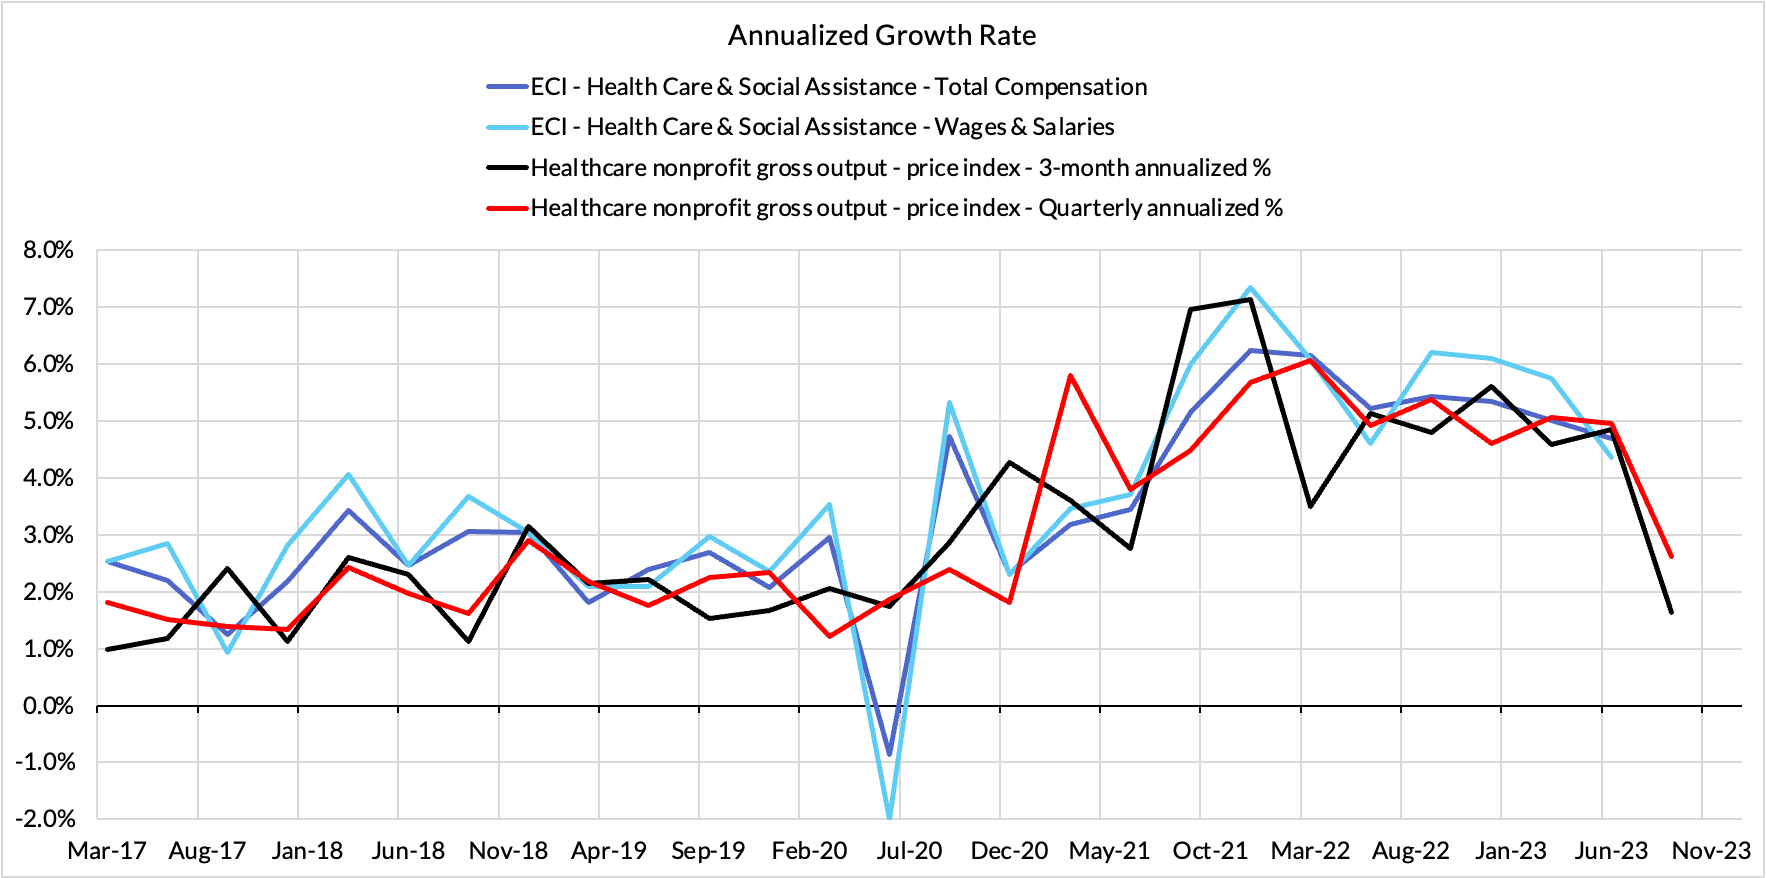
The most interesting fact from the past two days of data isn't really within Core or Supercore PCE: there's decent reason to believe that the Q3 Employment Cost Index release that comes out next Wednesday will show further signs of deceleration. That's because a particular subset of PCE deflators are based on input cost indices that use Employment Cost Index source data. The healthcare components of ECI directly feed into the price indices for healthcare nonprofits (though there are also other inputs). The price index data received yesterday and today reveals considerable deceleration in Q3 relative to Q1 and Q2. While this dynamic could be offset by other industry-level ECI dynamics, the risks to the Employment Cost Index release appear to be moving further to the downside.
This could be of elevated significance because the Fed's assessment of a "hot labor market" will have to come in for further revision. Given that the Fed's effects on inflation primarily run through the labor market, the case for delivering a final hike in Q4 should diminish if ECI is growing at less than a 4% annualized growth rate.
We have maintained since the July FOMC meeting our baseline view that the Fed would be done hiking, but we would be reluctant to fully write off a Q4 hike in the event of (1) a strong Q3 ECI reading, (2) strong implied-PCE inflation readings for October and November, and (3) signs of financial conditions meaningfully easing. Each of these conditions are individually necessary (though not sufficient) for delivering a Q4 hike. In the event that even one of these conditions fails to materialize, the Fed should and likely will back away from the final projected hike, leaving the terminal Fed Funds Rate at 5.33%.
As for the Fed's inflation projections, we would flag two diverging dynamics:
As it stands now, we see core PCE finishing Q4 at 3.5% year-over-year but there are risks on both sides.
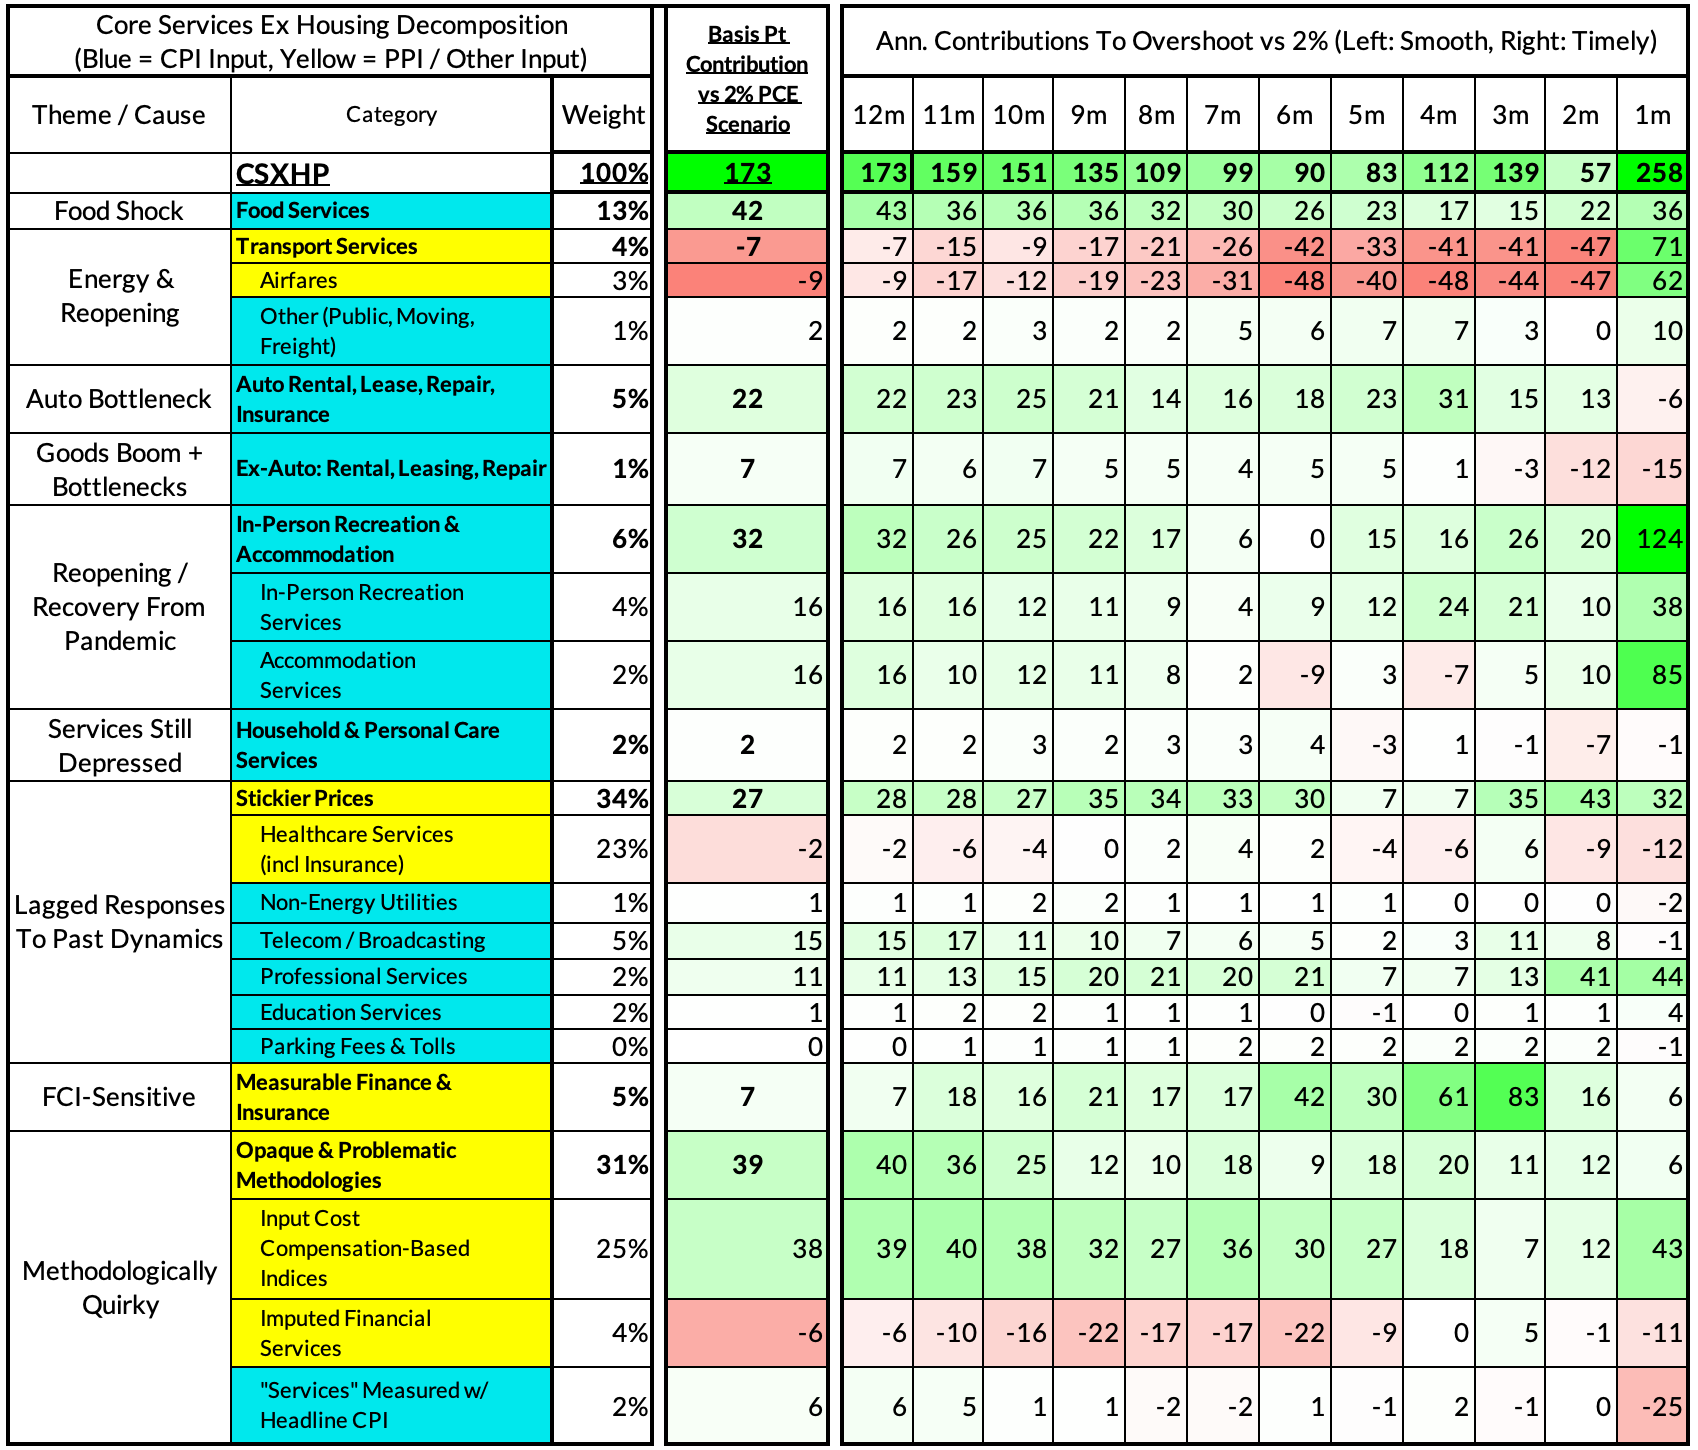
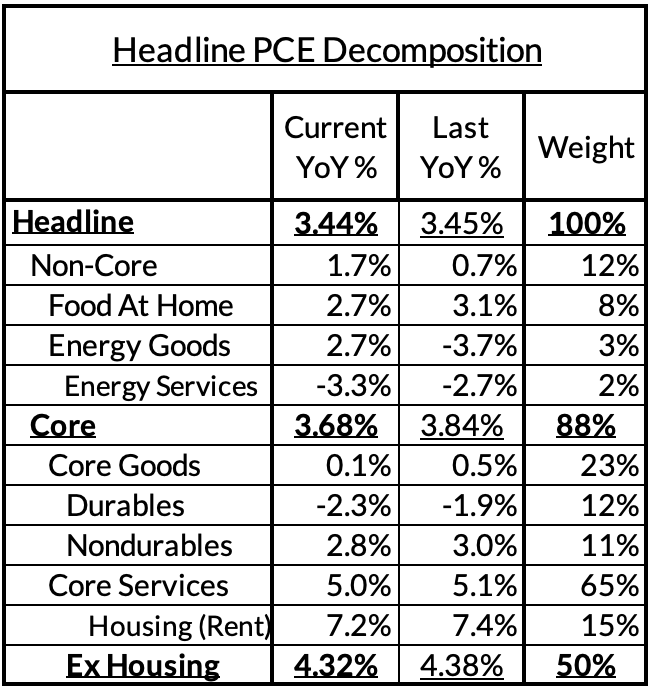
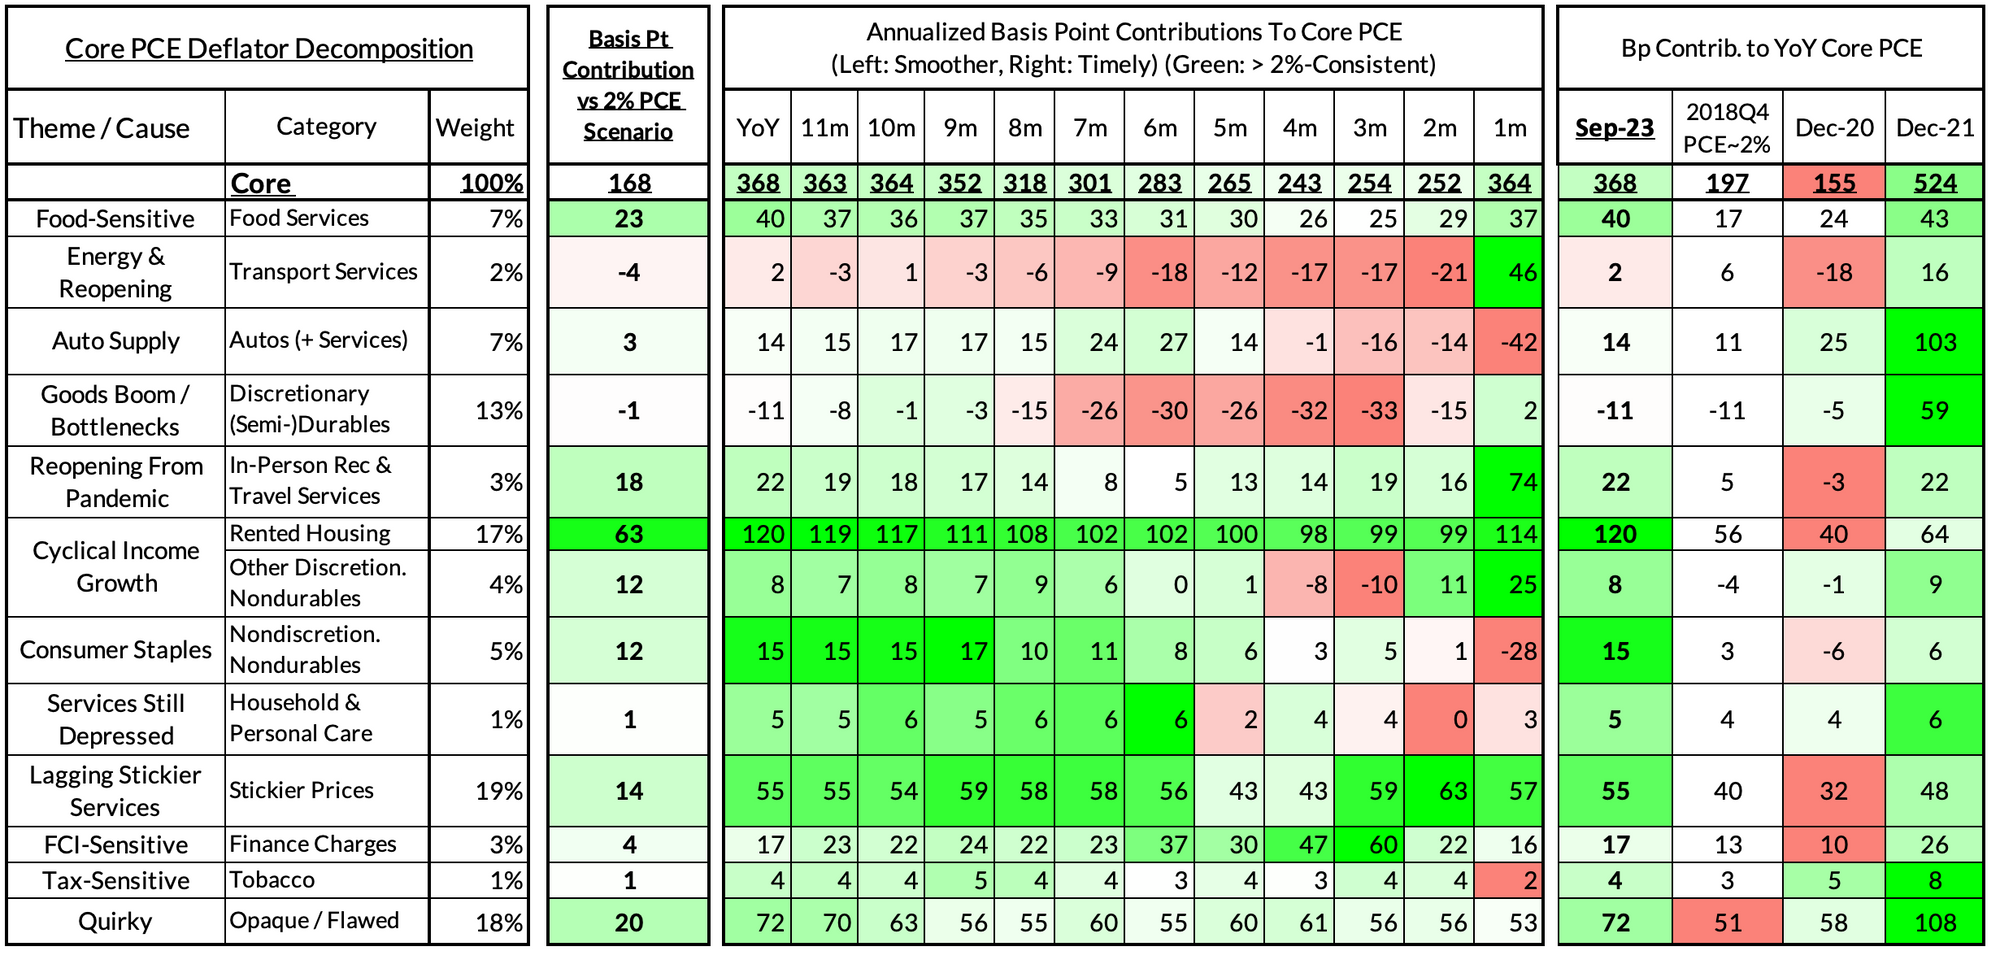
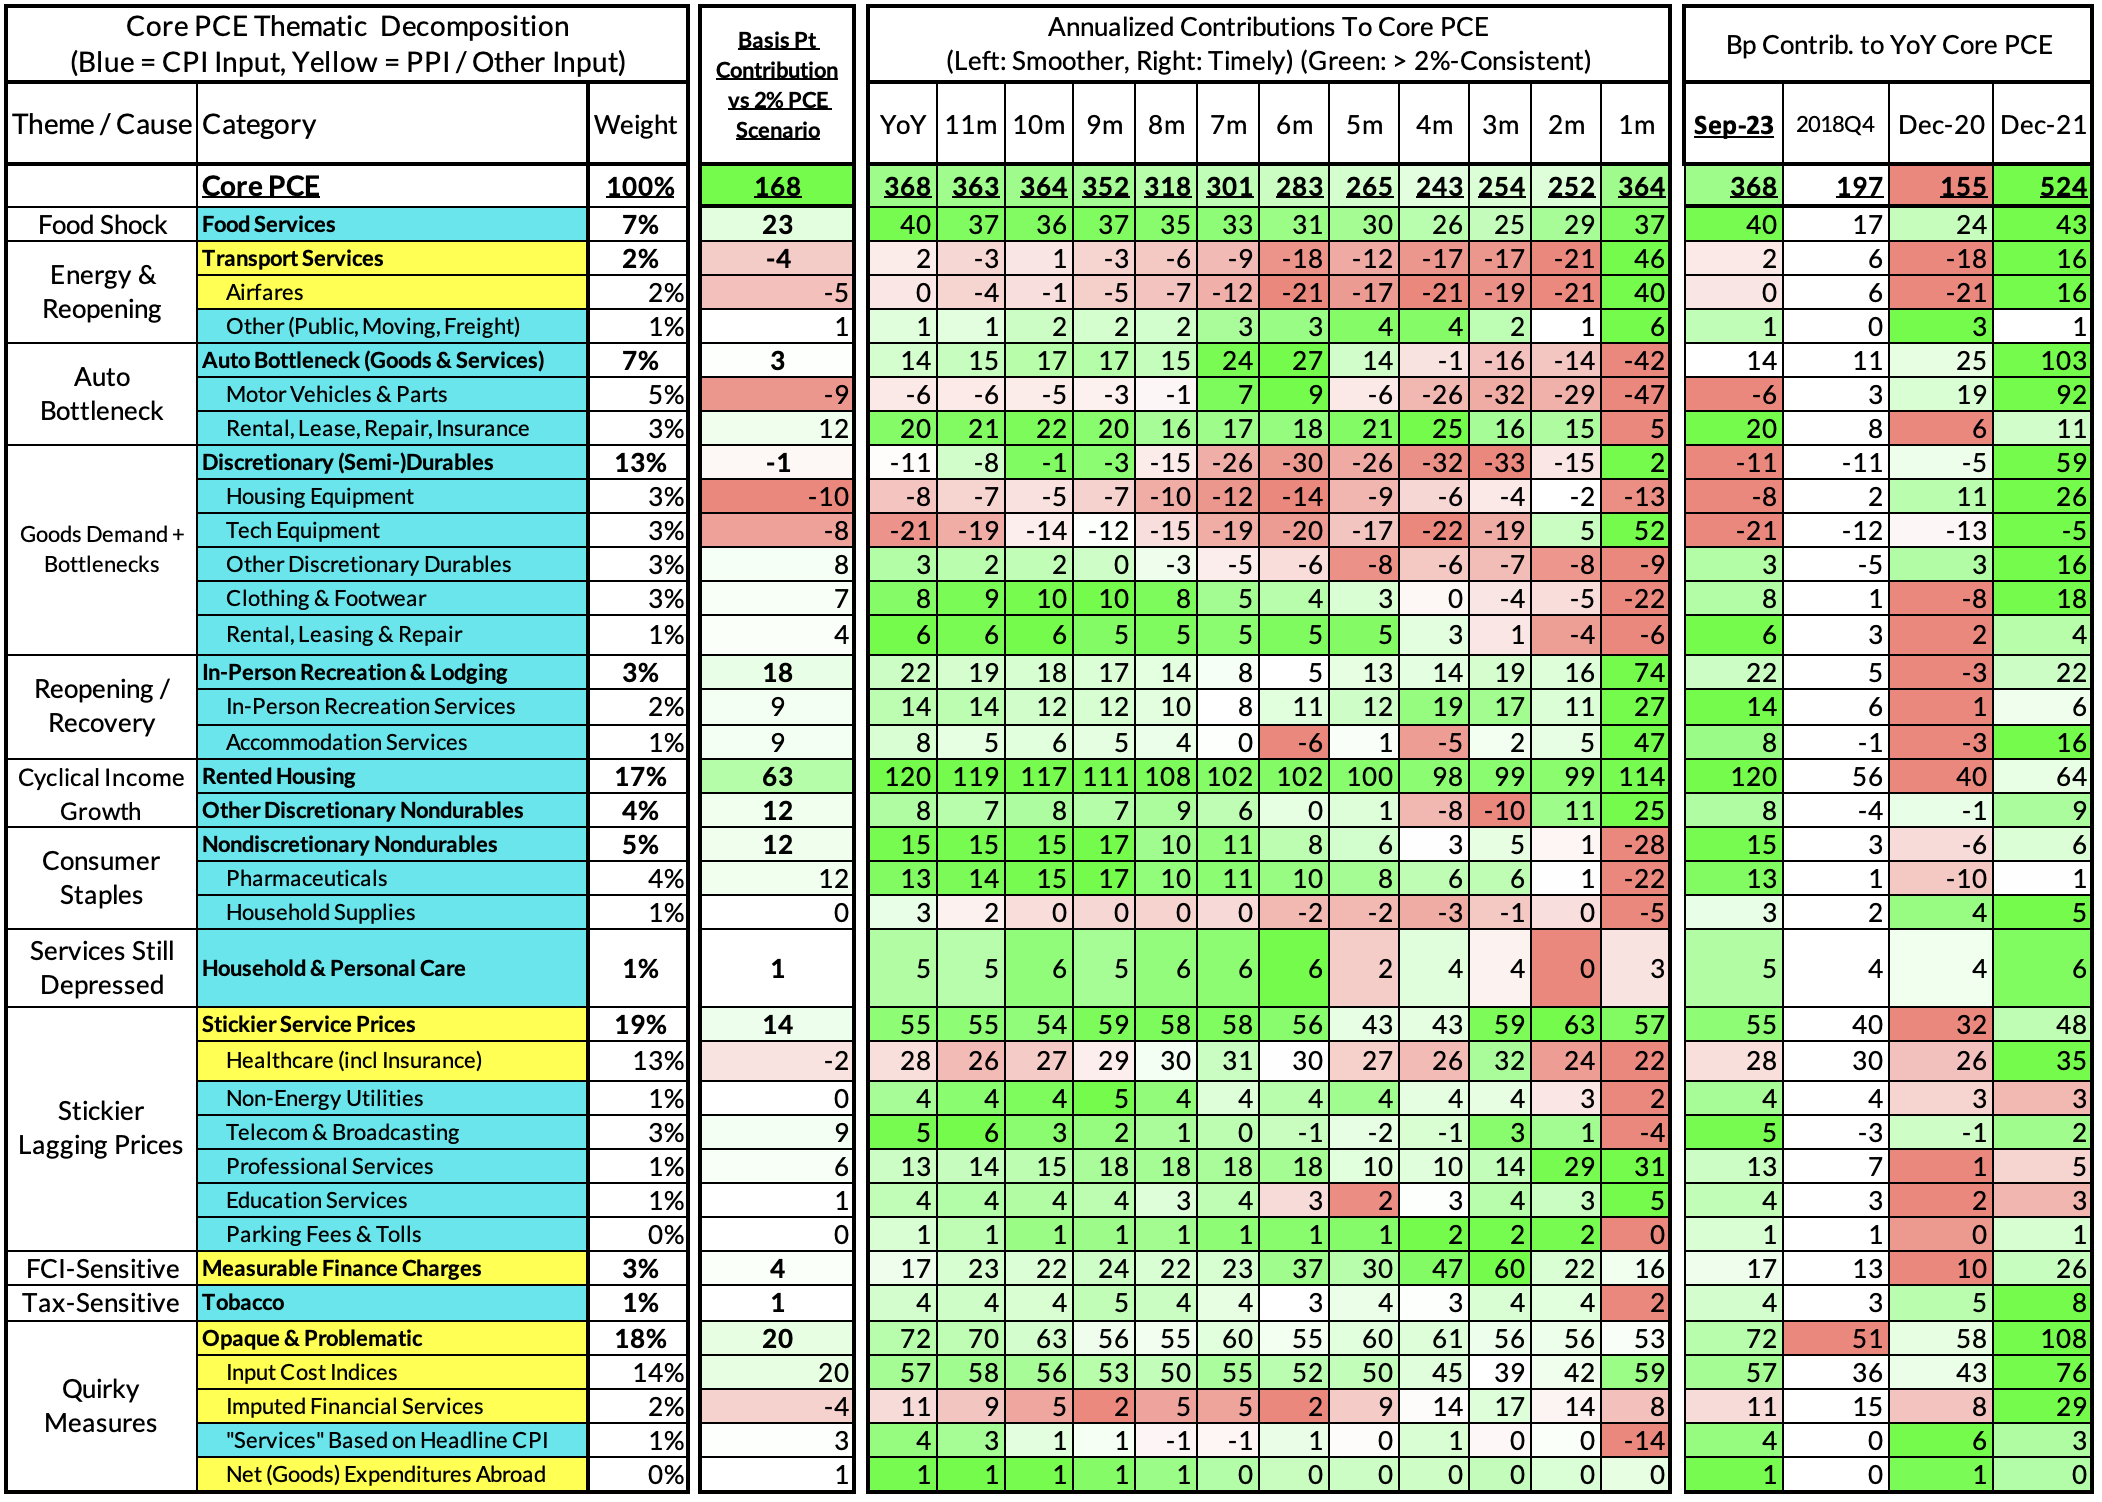
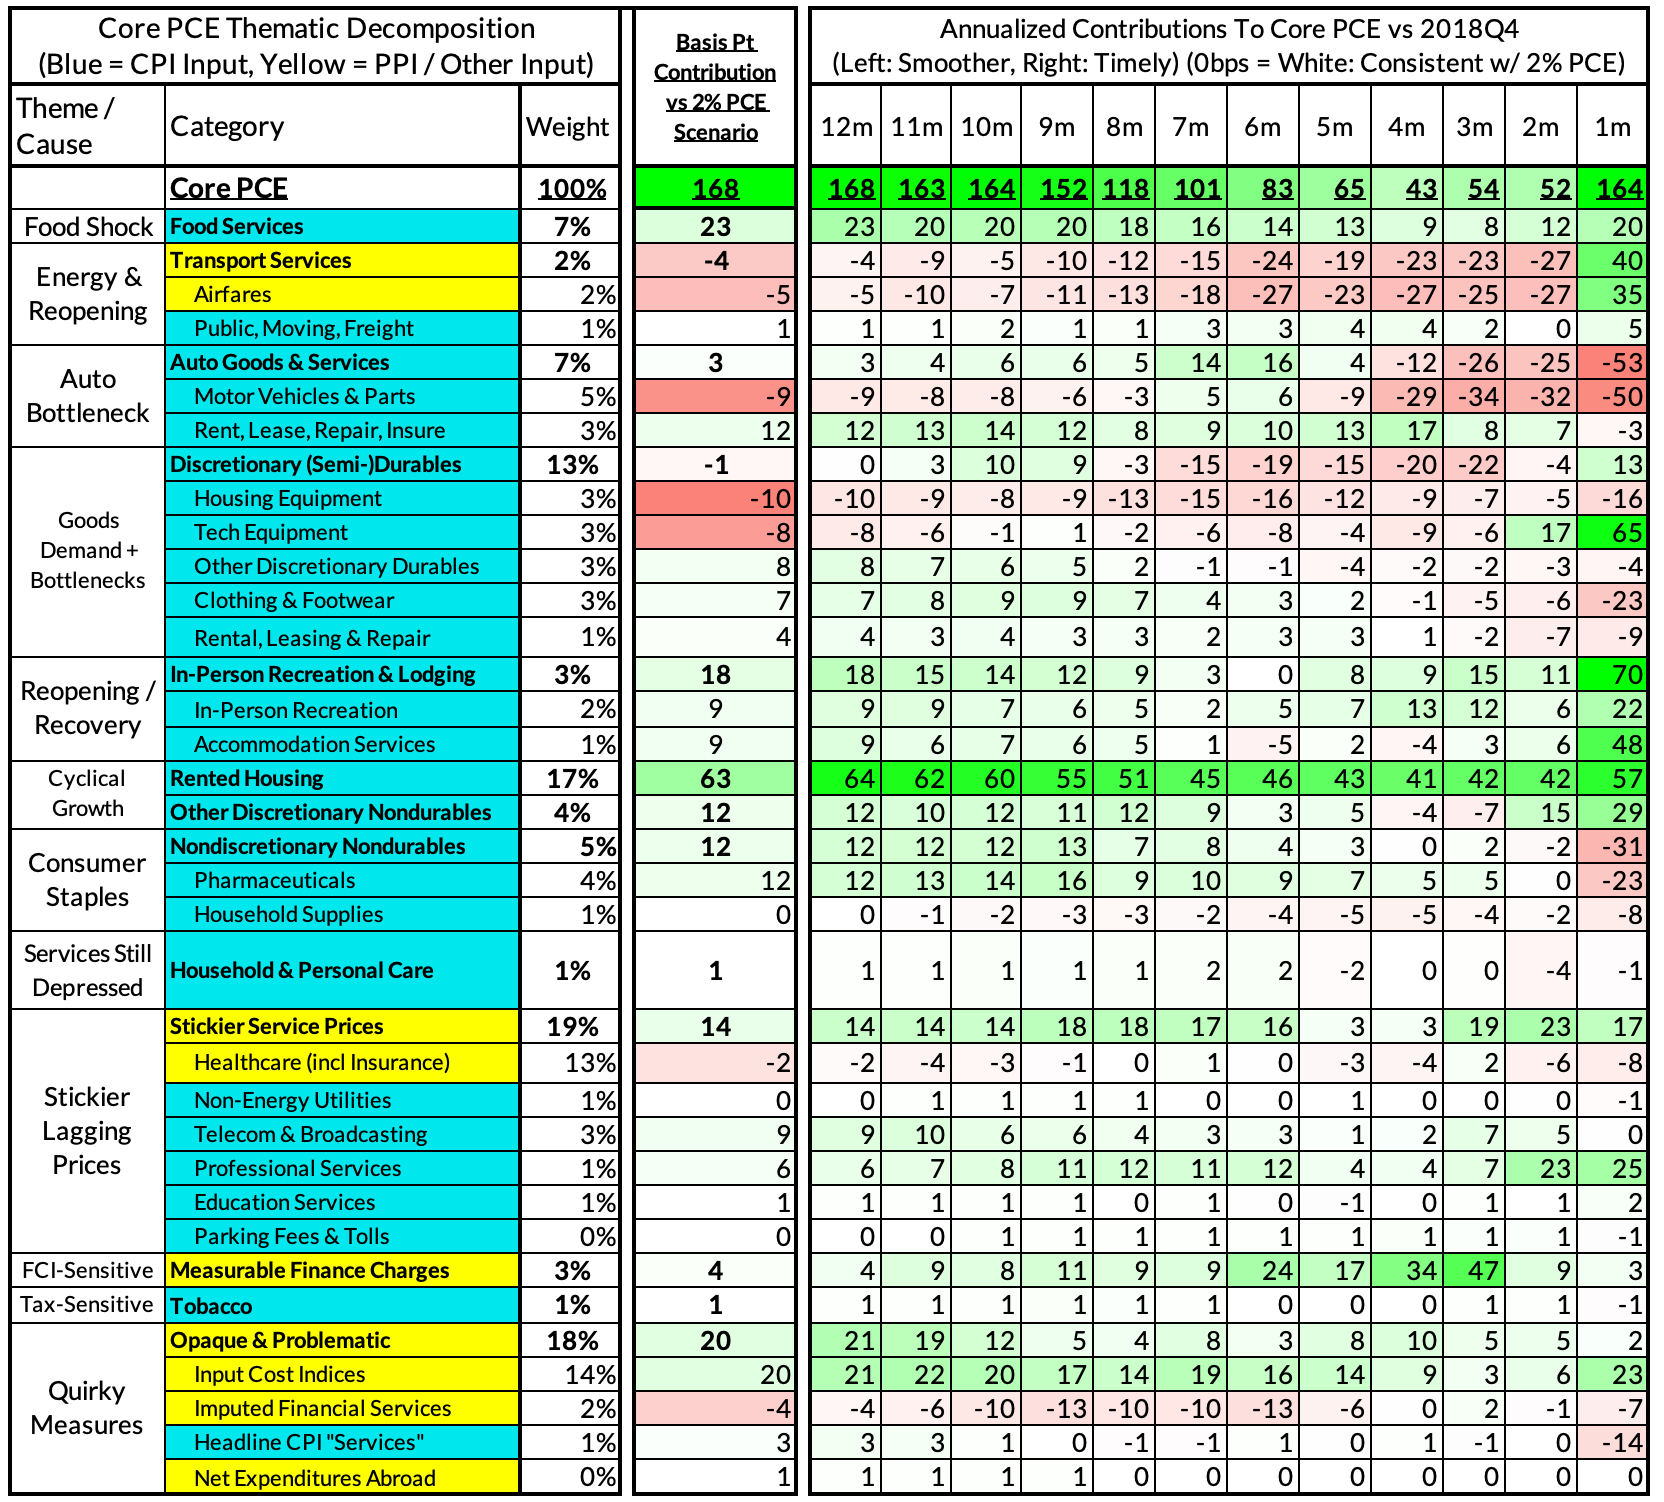
Right now Core PCE (PCE less food products and energy) is running at a 3.68% year-over-year pace as of September, 168 basis points above the Fed's 2% inflation target for PCE. That overshoot is disproportionately driven by catch-up rent CPI inflation in response to the surge in household formation (a byproduct of rapidly recovering job growth), which caused market rents to surge in 2021. Rent is contributing 63 basis points to the 168 basis point core PCE overshoot.
There are other contributors to the overshoot:

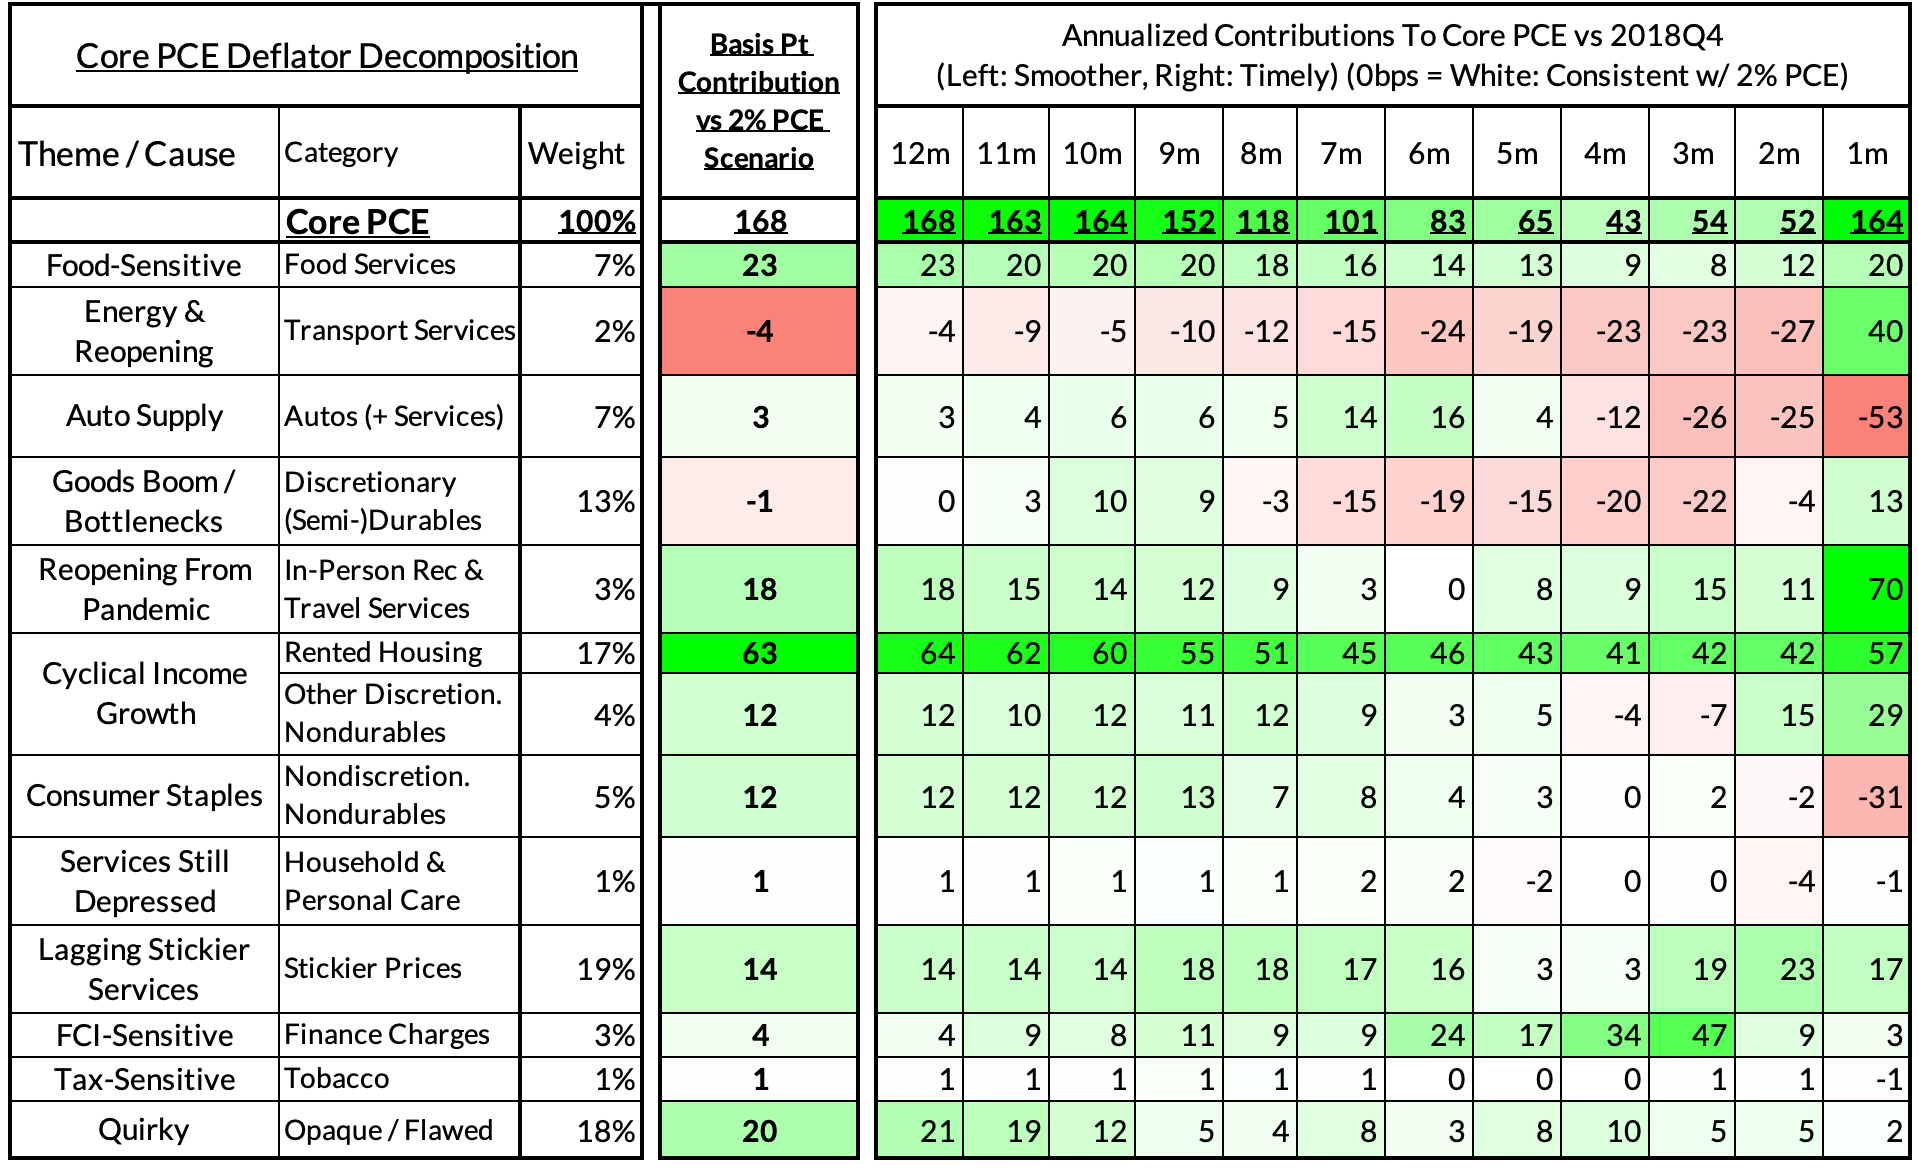
The final two heat maps below gives you a sense of the overshoot on shorter annualized run-rates. September monthly annualized core PCE yielded a 164 basis point overshoot vs 2% target inflation (3.64% annualized).
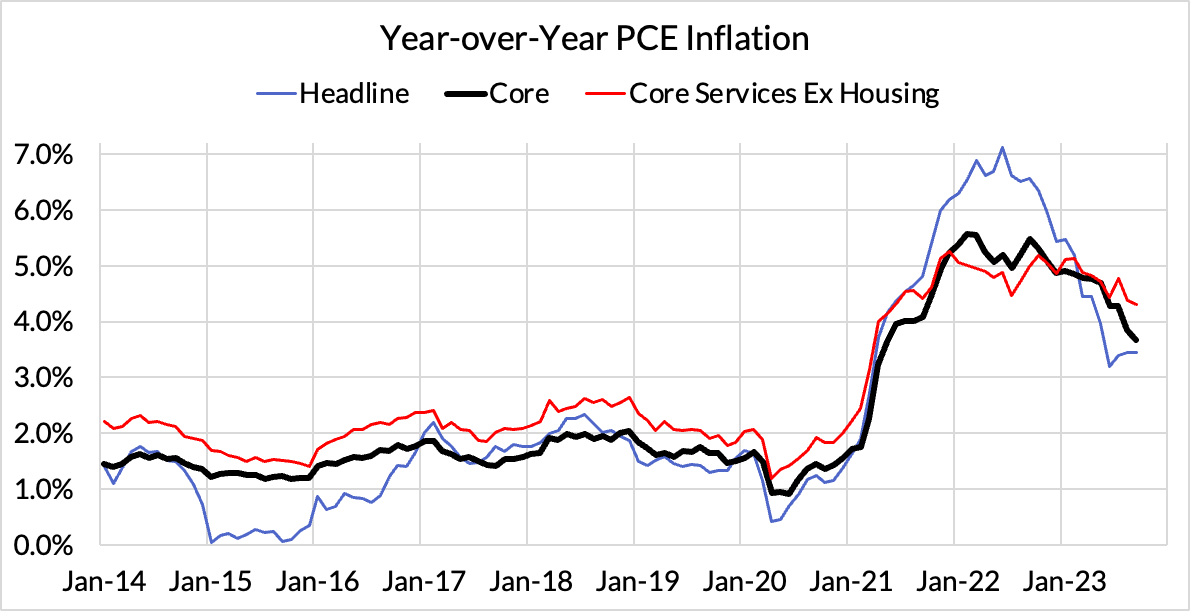
The September growth rate in "Core Services Ex Housing" ('supercore') PCE ran at 4.32% year-over-year, a 173 basis point overshoot versus the 2.56% run rate that coincided with ~2% headline and core PCE.
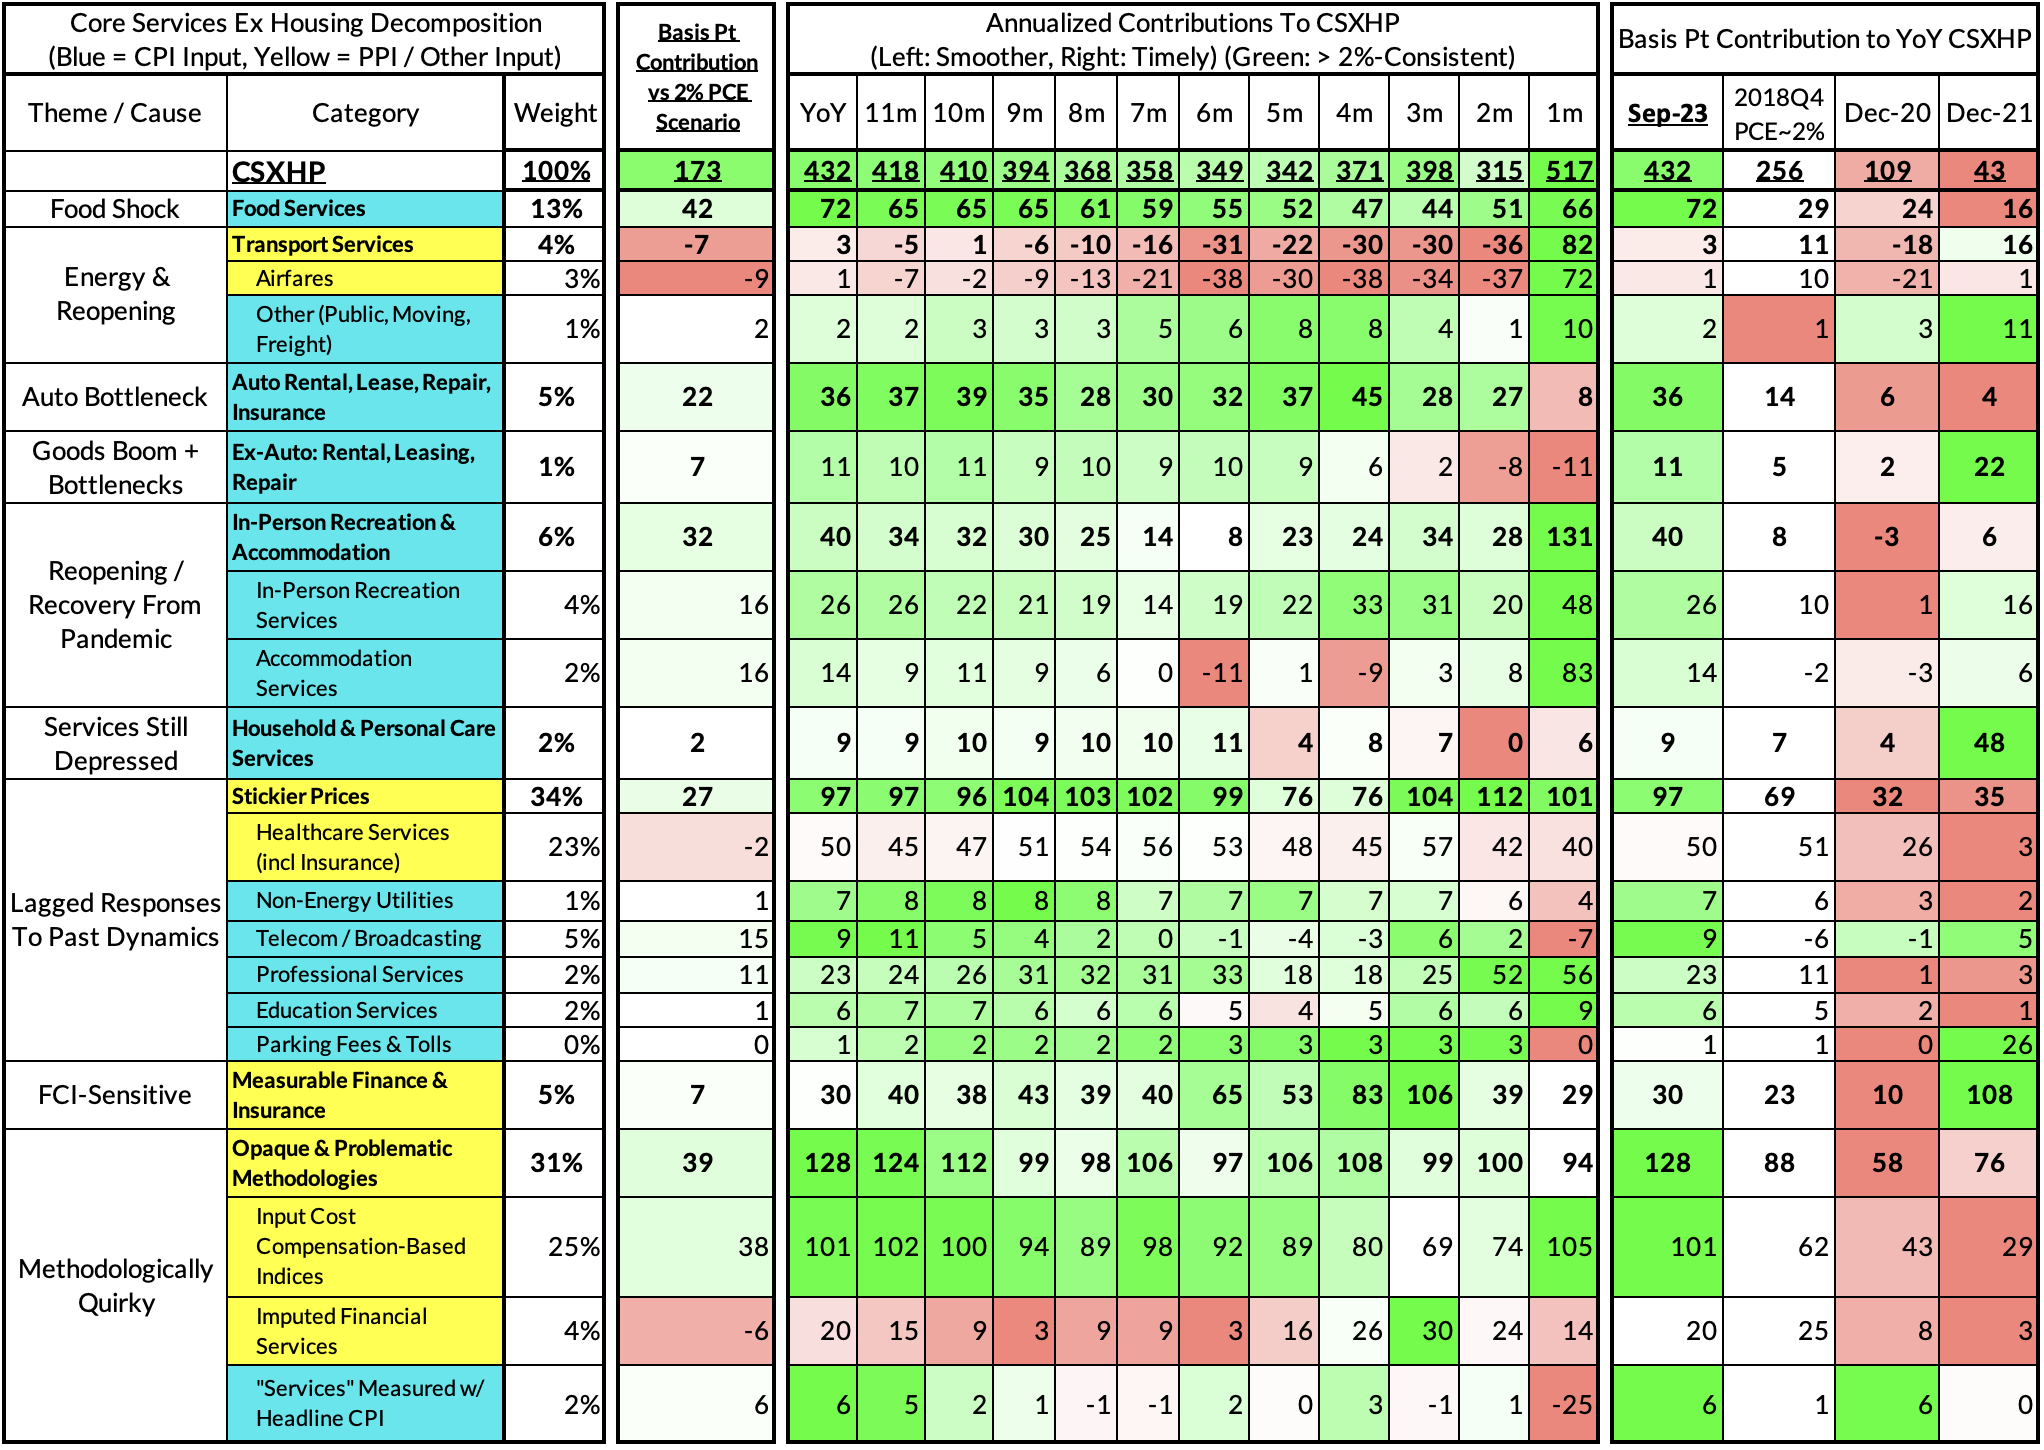
September monthly supercore ran at a 5.17% annualized rate, a 258 basis point overshoot of what would be consistent with 2% headline and core PCE.