This is the first edition of our Supply Chain Monitor. We plan to update this monitor on a monthly basis for our Premium Donors. If you’re interested in gaining access to our Premium Donor distribution, please feel free to reach out to us here for more information.
At Employ America, we have argued that shortages of physical productive capacity played a major role in the inflation seen during and after the recovery from the pandemic recession. In order to analyze the impacts of shortages and their resolution, we have been tracking reported shortages and comparing them to indices of industrial production and prices faced by producers. How the path of investment and production evolves after a period of reported shortages is likely to be highly suggestive for the path of a number of other important economic dynamics, most especially the labor market and increasingly relevant energy transition dynamics.
In today’s report, we see a few key takeaways:
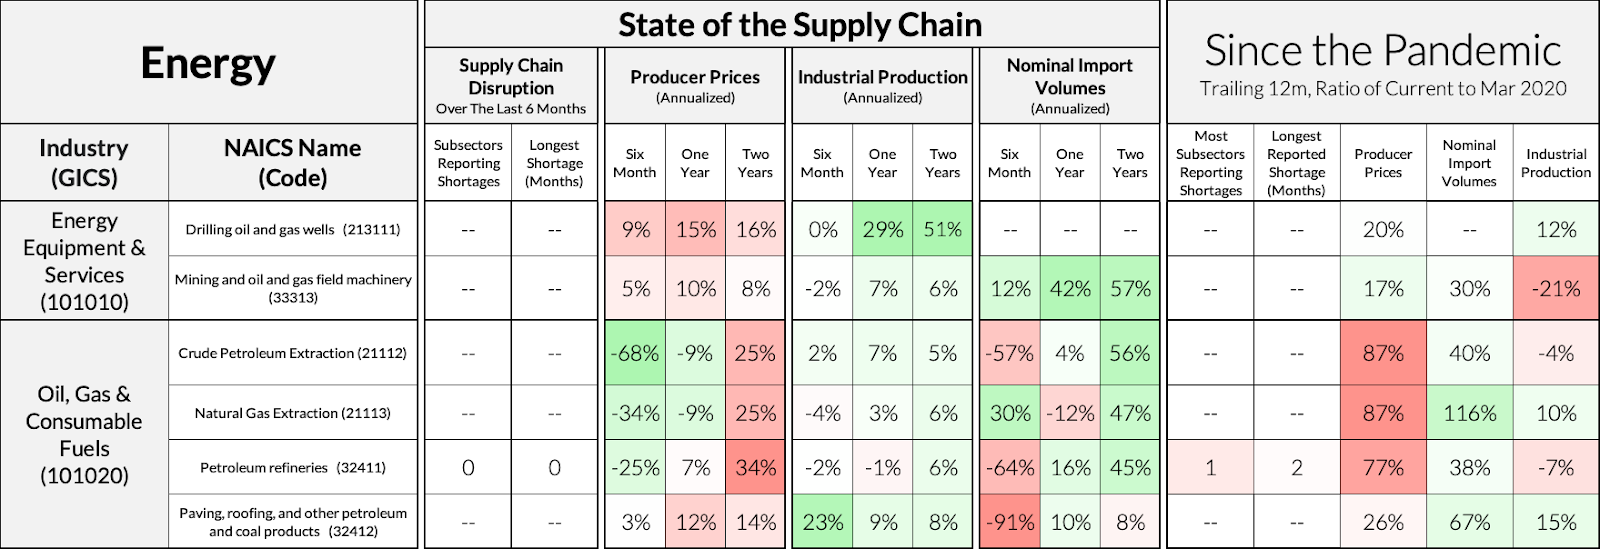
- The supply chain issues that marred the ramp-up in US Oil Production following the onset of the Ukraine war seem to be fading, which aligns with falling oil prices and the need for the Strategic Petroleum Reserve to support the market. Producer prices have fallen substantially, and production is above pandemic levels, but is threatening to begin falling.
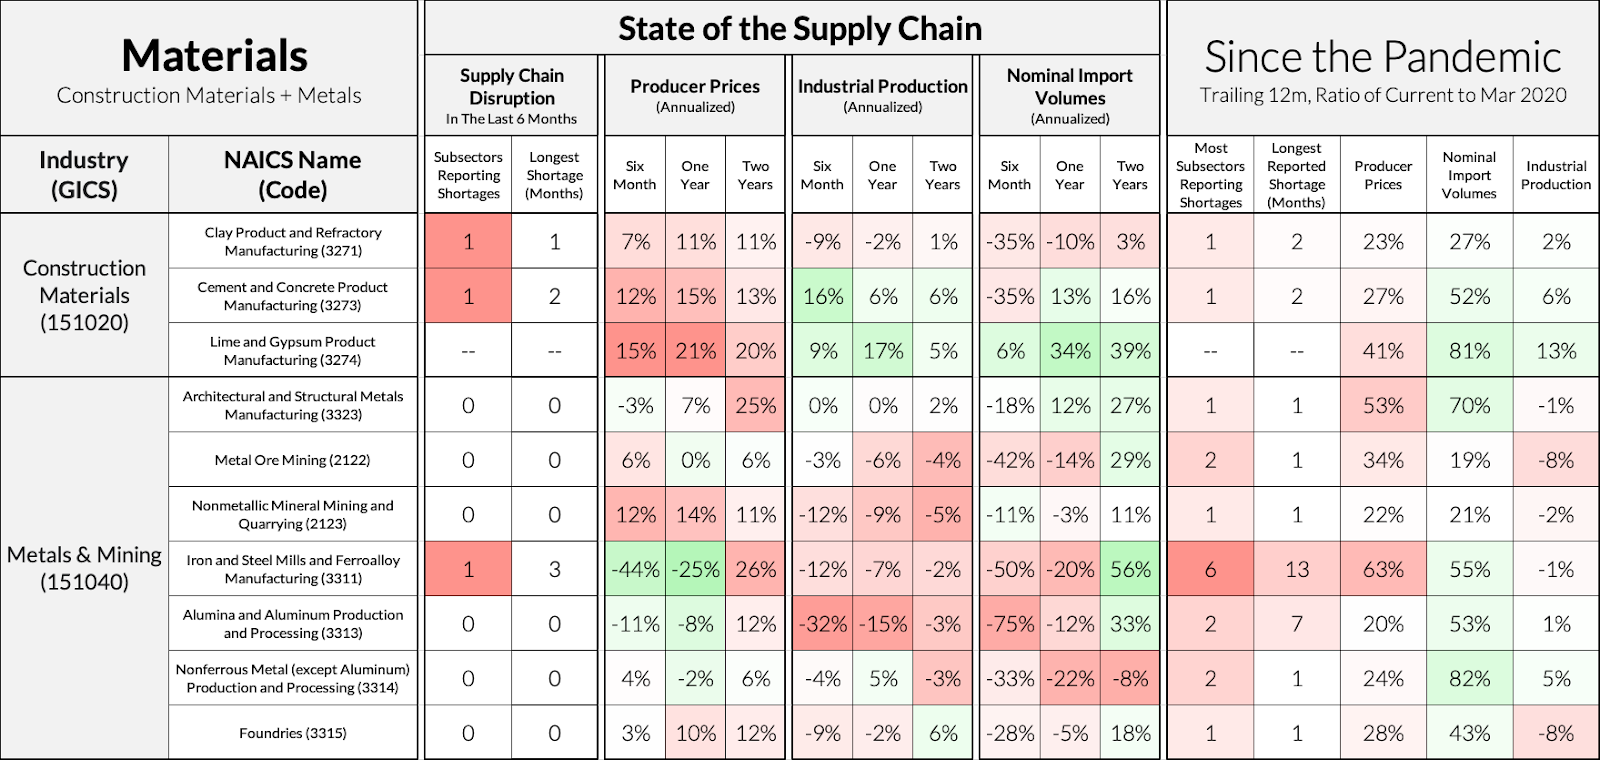
- Producer prices for Construction Materials are rising alongside industrial production and imports, suggesting demand remains strong and suppliers are beginning to adapt both domestically and abroad while US homebuilders continue working through order backlogs. We see further confirmation of this dynamic in the strength in imports and productions of Construction Machinery.
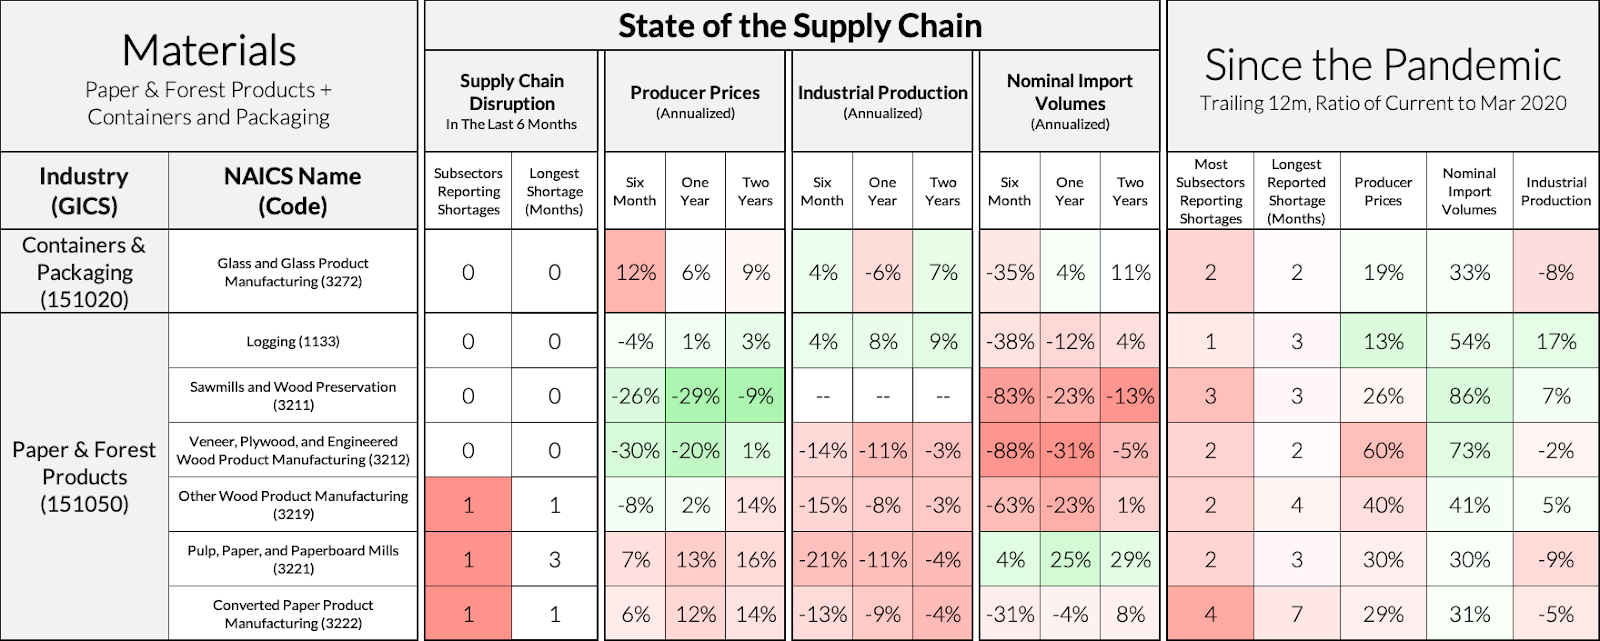
- Despite this, we see some signs of recessionary dynamics within Paper and Forest Products: falling producer prices coupled with falling imports and domestic production. Evidence of this dynamic can also be seen in Lumber prices falling to near pre-pandemic levels. This may help offset some of the cost pressure in construction created by the dynamics in construction materials above.
- Industrial production across the Capital Goods sector – most especially various kinds of Machinery – has remained strong alongside rising imports and steady producer prices, suggesting tighter monetary policy may have yet to bite into firms’ capacity expansion plans. Unlike many other sectors, domestic producer prices have not increased dramatically compared to pre-pandemic levels, suggesting that the Fed increasing firms’ cost of capital may be more manageable on the investment front than some expect.
- Shortages in Basic Chemical Manufacturing are still coinciding with depressed industrial production in both basic chemicals and downstream sectors like Fertilizer or Plastics, both of which have seen increasing imports in response to reported shortages.
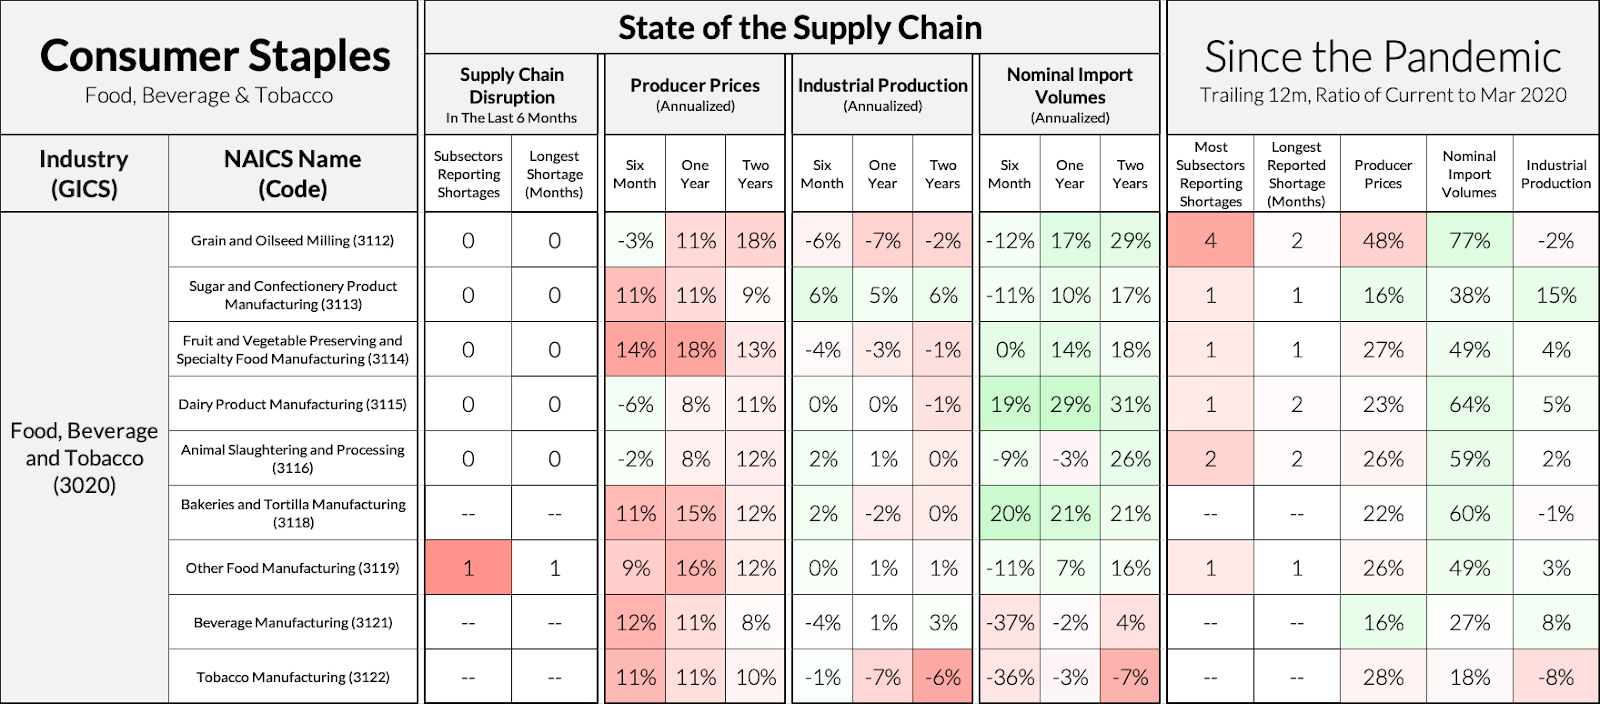
- Producer prices for Food and Beverage are continuing to rise as the war in Ukraine continues. As we explained recently, these dynamics can quickly feed into rising inflation in Food Services.
How To Use The Monitors
Hello and welcome to the new and improved Supply Chain Monitor. This month’s monitors are better looking, richer in data, and more straightforwardly organized than last months.
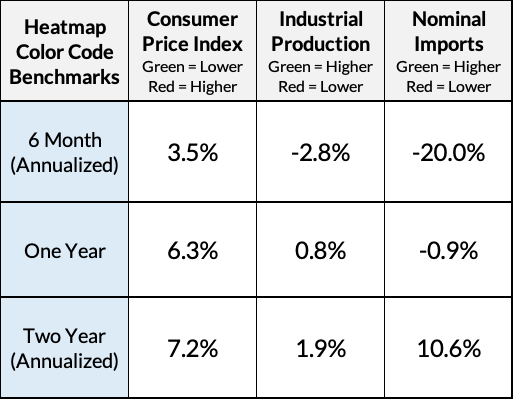
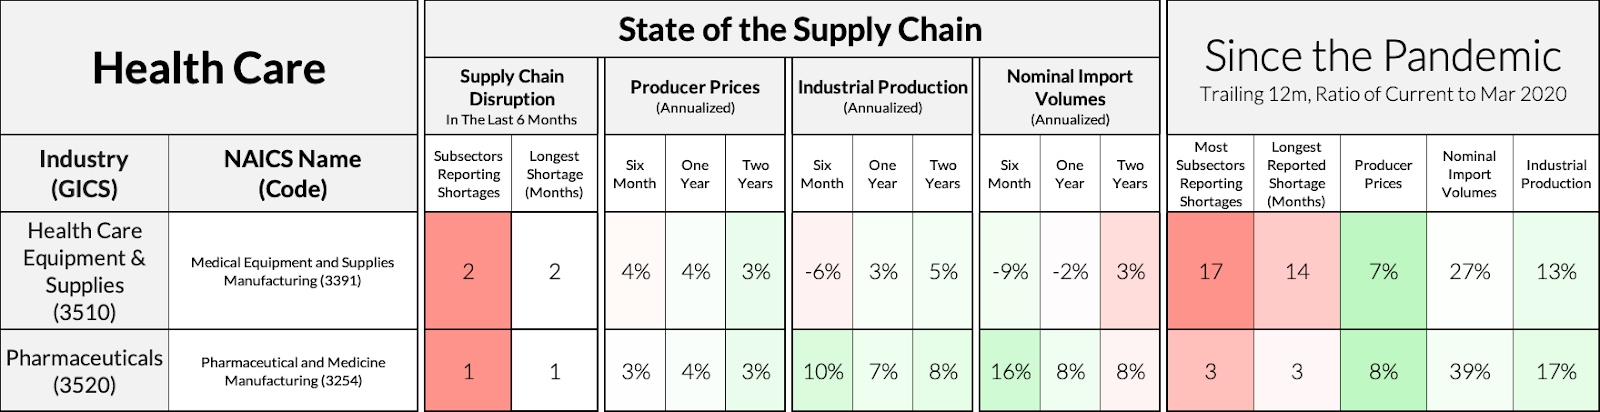
Sectors are organized around GICS categories, to better reflect the interlinkages between industries, while the underlying data remains structured around NAICS categories. This introduces some slippage, but for a top-level macroeconomic dashboard, the explanatory benefits justify the slippage. Data is color-coded based on its relation to benchmarks: rather than establish absolute levels that represent improvement or disimprovement in a given sector, we can orient ourselves around relative annualized rates of change. If overall production is falling, but some particular sector is holding steady, it is relatively stronger than the aggregate, which may be meaningful.
The monitors are broken up into two main sections, the current state of the supply chain in the center, and the changes between present and pre-pandemic on the right. The state of the supply chain presents six month, one year and two year annualized changes in the three month moving average of three kinds of data: producer prices, industrial production and import volumes. This is designed to allow users to explore how industrial dynamics play out, to find whether a given shortage is a problem of domestic or foreign capacity, and to get a sense of the momentum of each indicator for each sector.
At the top, we provide a legend for the benchmarks used to color-code the data.
The Monitors