Labor Market Recap March 2024: America Stays Employed
This is overall a good jobs report. Job growth is solid, and there are no obvious signs of weakness.

This is overall a good jobs report. Job growth is solid, and there are no obvious signs of weakness.
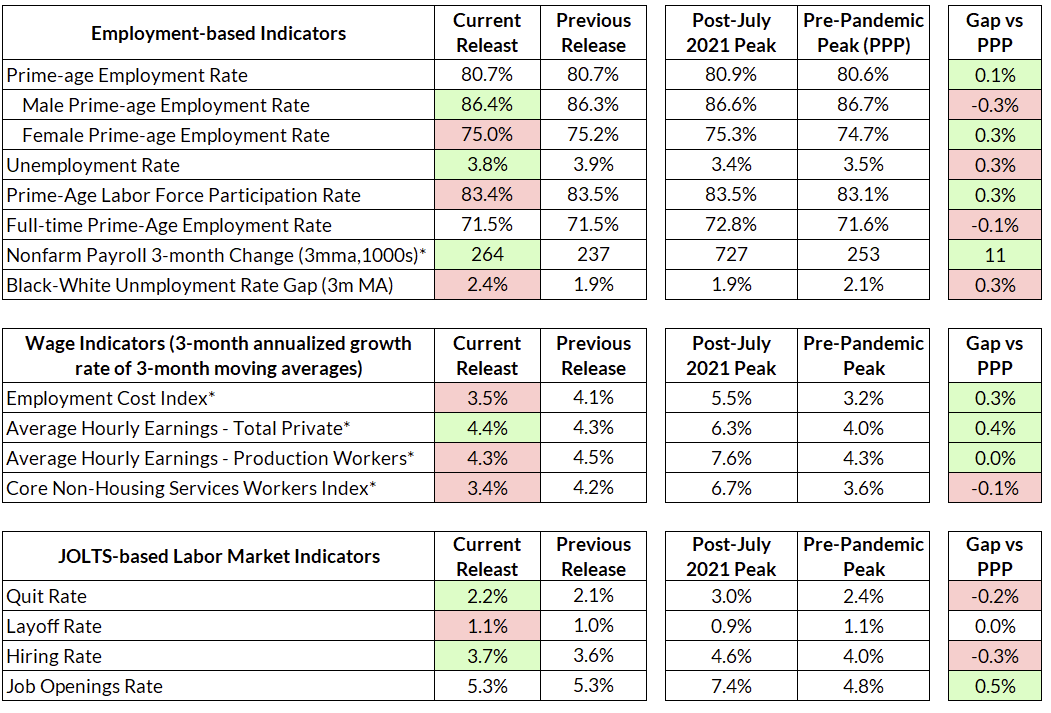
The economy added 303,000 jobs in February, with minor revisions to January and February. The headline unemployment rate fell by 0.1% to 3.8%, as both the all-ages employment and labor force participation rates rose by 0.2%. Prime-age employment rates were steady at 80.7%. After the seasonal wiggles earlier this year, average hourly earnings grew at an annualized rate of 4.2%, just above its average growth rate of 4.1% over the past twelve months. The JOLTS measures were largely unchanged in February, with slight increases in quits, hires and layoffs.
A few notable details:
This is overall a good jobs report. Job growth is solid, and there are no obvious signs of weakness. Wage growth continues to cool on a yearly basis, especially in the sectors the Fed is most concerned about.
A Goldilocks Labor Market
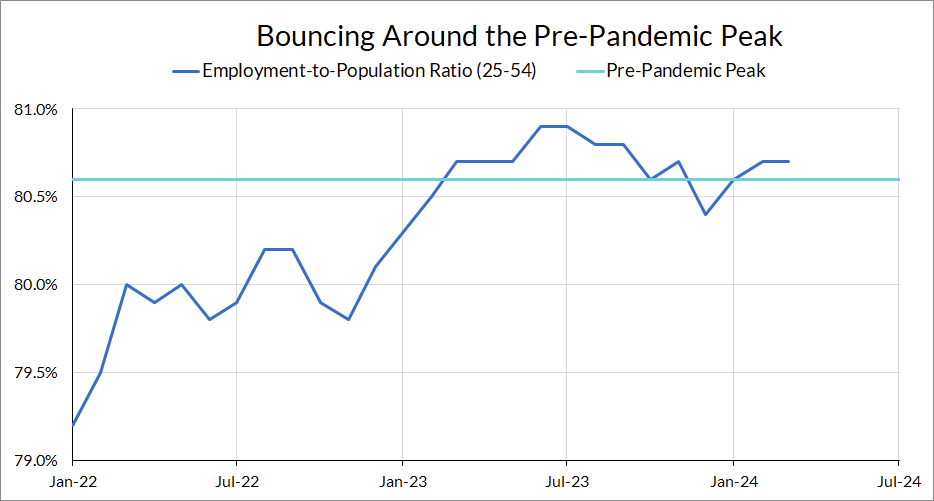
In the back half of 2023, there was a noticeable slide in the strength of the labor market in the household survey. After the past few months, with a rebound in the prime-age employment rate, that slide appears to have at least partially reversed. The prime-age employment rate is now just above its pre-pandemic peak.
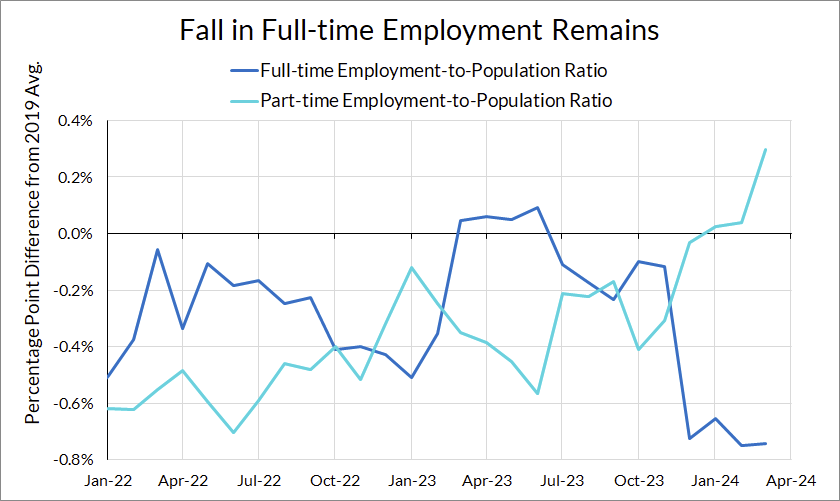
It should be noted, though, that the rebound in unemployment appears to be driven entirely by an increase in part-time employment. The full-time employment rate, which peaked in mid-2023, has fallen by around 0.8 percentage points since then. Meanwhile, part-time employment is up nearly a full percentage point from then.
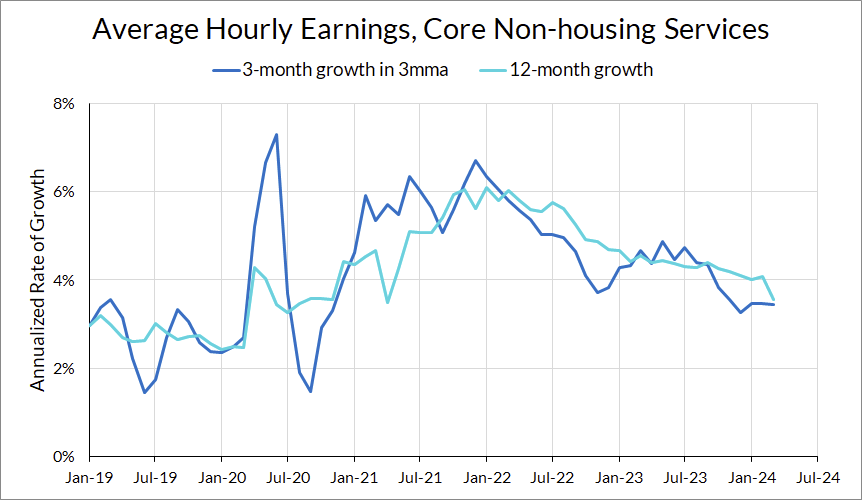
Turning to wages, short-term growth in average hourly earnings have been running in the ballpark of 4%. This is above where the Fed currently considered a sustainable rate of wage growth, but the long-run trend is downwards, even while employment levels remain strong.
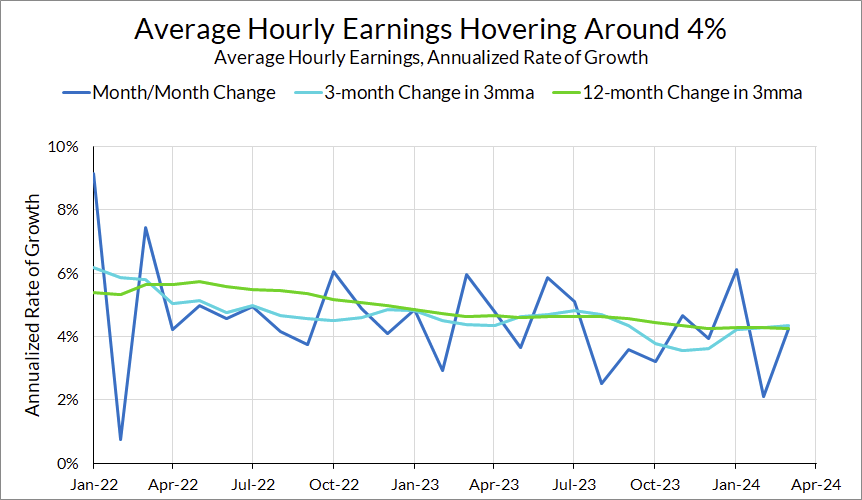
Turning specifically to average hourly earnings in the core non-housing services sector—where wage-price pass-through is believed to be the strongest—growth on both a short- and long-term basis is now running at around 3.5%.
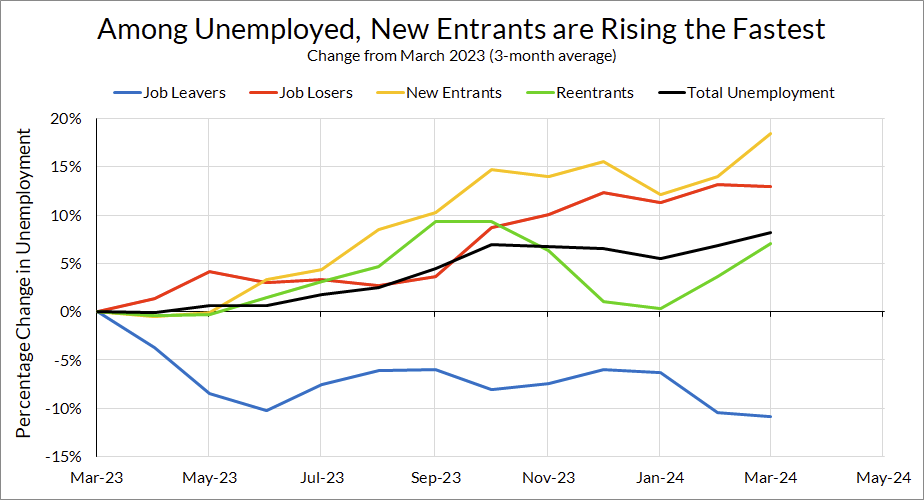
Last month, I flagged the increase in unemployed job losers as a cause for concern. This month, the number of unemployed job losers fell slightly. However, it is worth noting that the group of unemployed growing the fastest is new entrants to the labor market. Over the past year, the composition of unemployed workers has shifted away from job leavers and towards entrants. This matches what we know from the JOLTS data, which have shown gradually lowering quit rates over the past year.
State-level Increases in Unemployment are Less Alarming than They Seem
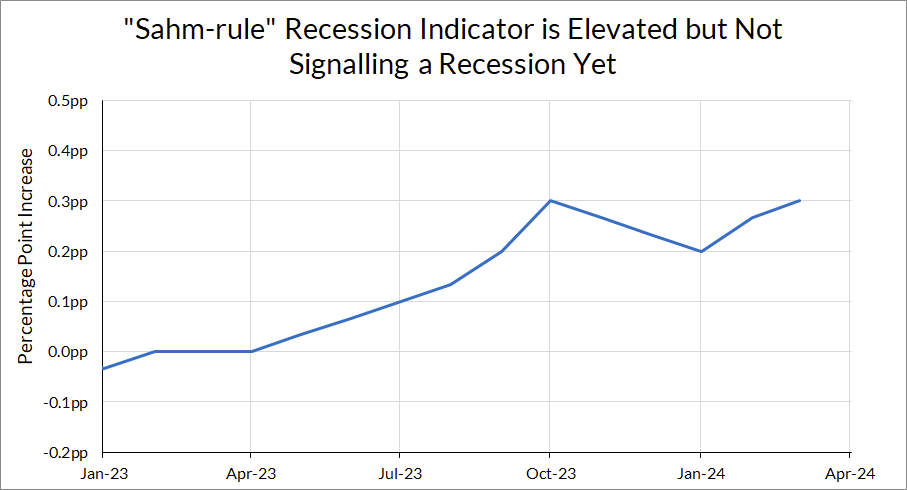
An often-cited real-time recession indicator is the “Sahm rule.” The Sahm rule is determined by taking the difference in the 3-month average of the national unemployment rate from its lowest level over the past twelve months (for brevity’s sake I’ll call this change the “Sahm statistic”). The Sahm rule is triggered when the Sahm statistic reaches 0.5 percentage points.
Claudia Sahm proposed her eponymous rule as a trigger for when the government should send out stimulus payments. Historically, the performance of the Sahm rule is excellent as an early warning sign that the economy is in a recession. Despite the recent rise in the unemployment rate, the Sahm rule has yet to be triggered. In March 2024, the Sahm statistic came in at around 0.3 percentage points.
Recently, some macroeconomic observers have tried to apply this statistic to state-level unemployment rates. At the outset, there is reason to be cautious about taking this approach. The Sahm rule was designed using national-level data, and not validated using state-level data. The underlying data used to estimate state-level unemployment rates, the Local Area Unemployment Statistics (LAUS), is also not the same as the data used to estimate the national unemployment rate.
Nevertheless, at first glance the state-level unemployment data looks worrying. As of February 2024 (the latest LAUS data), twenty states, accounting for 40% of the labor force, have Sahm statistics measuring 0.5pp or higher. As Parker Ross points out, this measure is above the typical level seen at the beginning of recessions.
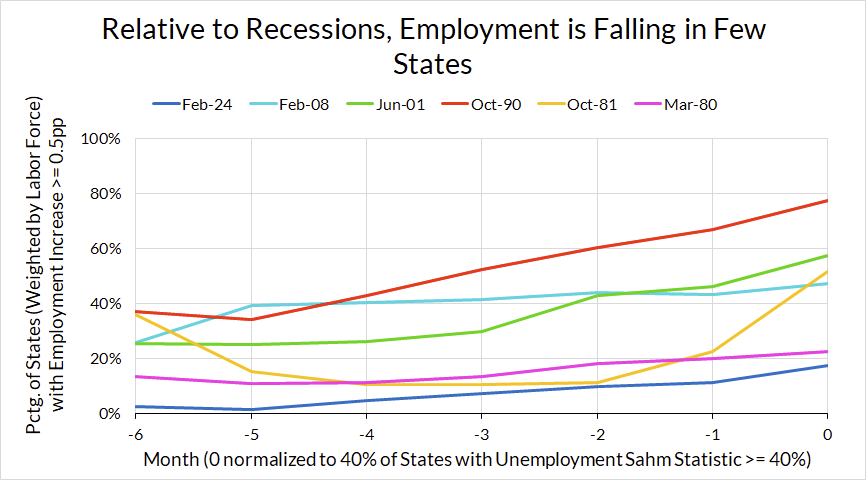
In the graph below, I plot the fraction of states with Sahm statistics above 0.5 (for the remainder of this piece, all fractions of states are weighted by labor force). In addition, I also plot an analogous statistic, but calculated using the state-level employment-to-population ratio instead (call this the “employment Sahm statistic”). The purpose of this is not to say that an employment analog of the Sahm rule is necessarily superior, at either the state or national level, but rather to provide an additional view of how the labor market is evolving at the state level.
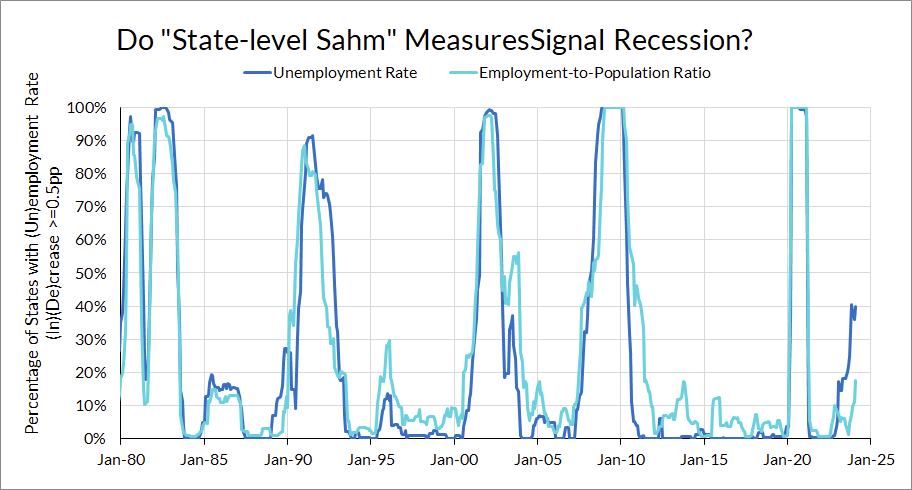
Historically speaking, the employment statistic moves very closely with the unemployment statistic. That is, when a large number of states are seeing unemployment rise, a large number of states are also seeing falls in the employment-to-population ratio. That makes sense in the context of recessions; when the labor market deteriorates, people lose (or fail to find) jobs, leading to both a fall in unemployment and a rise in employment.
However, the two statistics have diverged in recent months. While 40% of states have seen unemployment rise by more than 0.5pp, only 20% of states have seen employment rates fall by more than 0.5pp.
To visualize today’s change in state-level employment rates in historical context, I plot the share of states where the employment rate analog of the Sahm statistic exceeds 0.5pp during the lead up to previous recessions, and February 2024. For comparative purposes, I define the onset of the recession as the month where the share of states where the unemployment Sahm statistic reaches 40% (which was the case in February 2024).
Finally, at the state level, changes in unemployment and employment are not behaving the same as during the beginning of past recessions. Below, I plot the employment and unemployment Sahm statistics at the state level for the 1990 recession and February 2024.
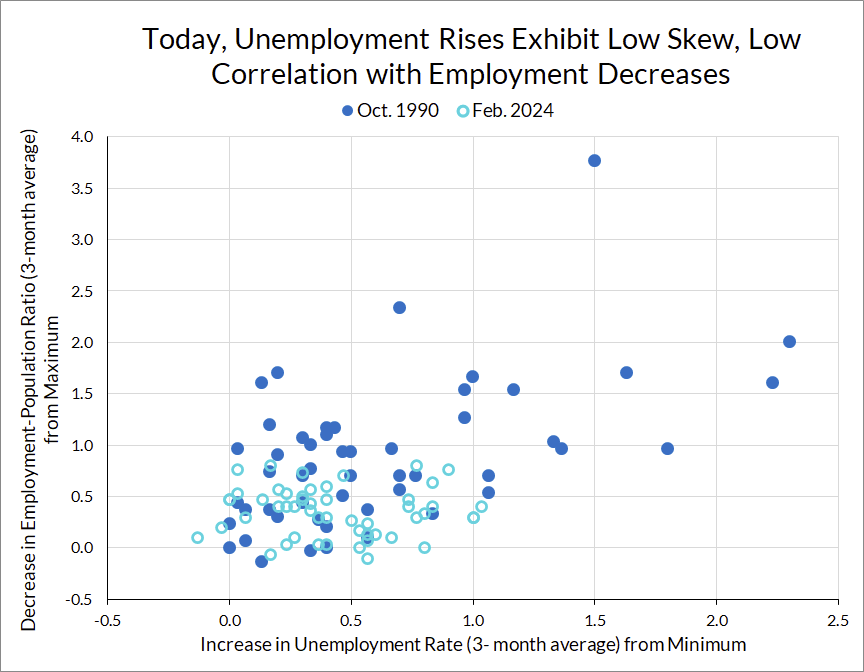
Two patterns stand out. The first is that there is far less dispersion in the state-level unemployment Sahm statistics right now than at the onset of the early-90s recession. The largest increase in unemployment at the state-level is just above 1%. During actual recessions, by the time 40% of states breached a Sahm statistic of 0.5pp some states had far higher increases in unemployment. One possible explanation for this is that recessions are not caused by factors that broadly affect all states at the same time and to the same extent; the causes of recessions are more acutely felt in some states than others, and then cascade in a diminishing fashion from state to state.
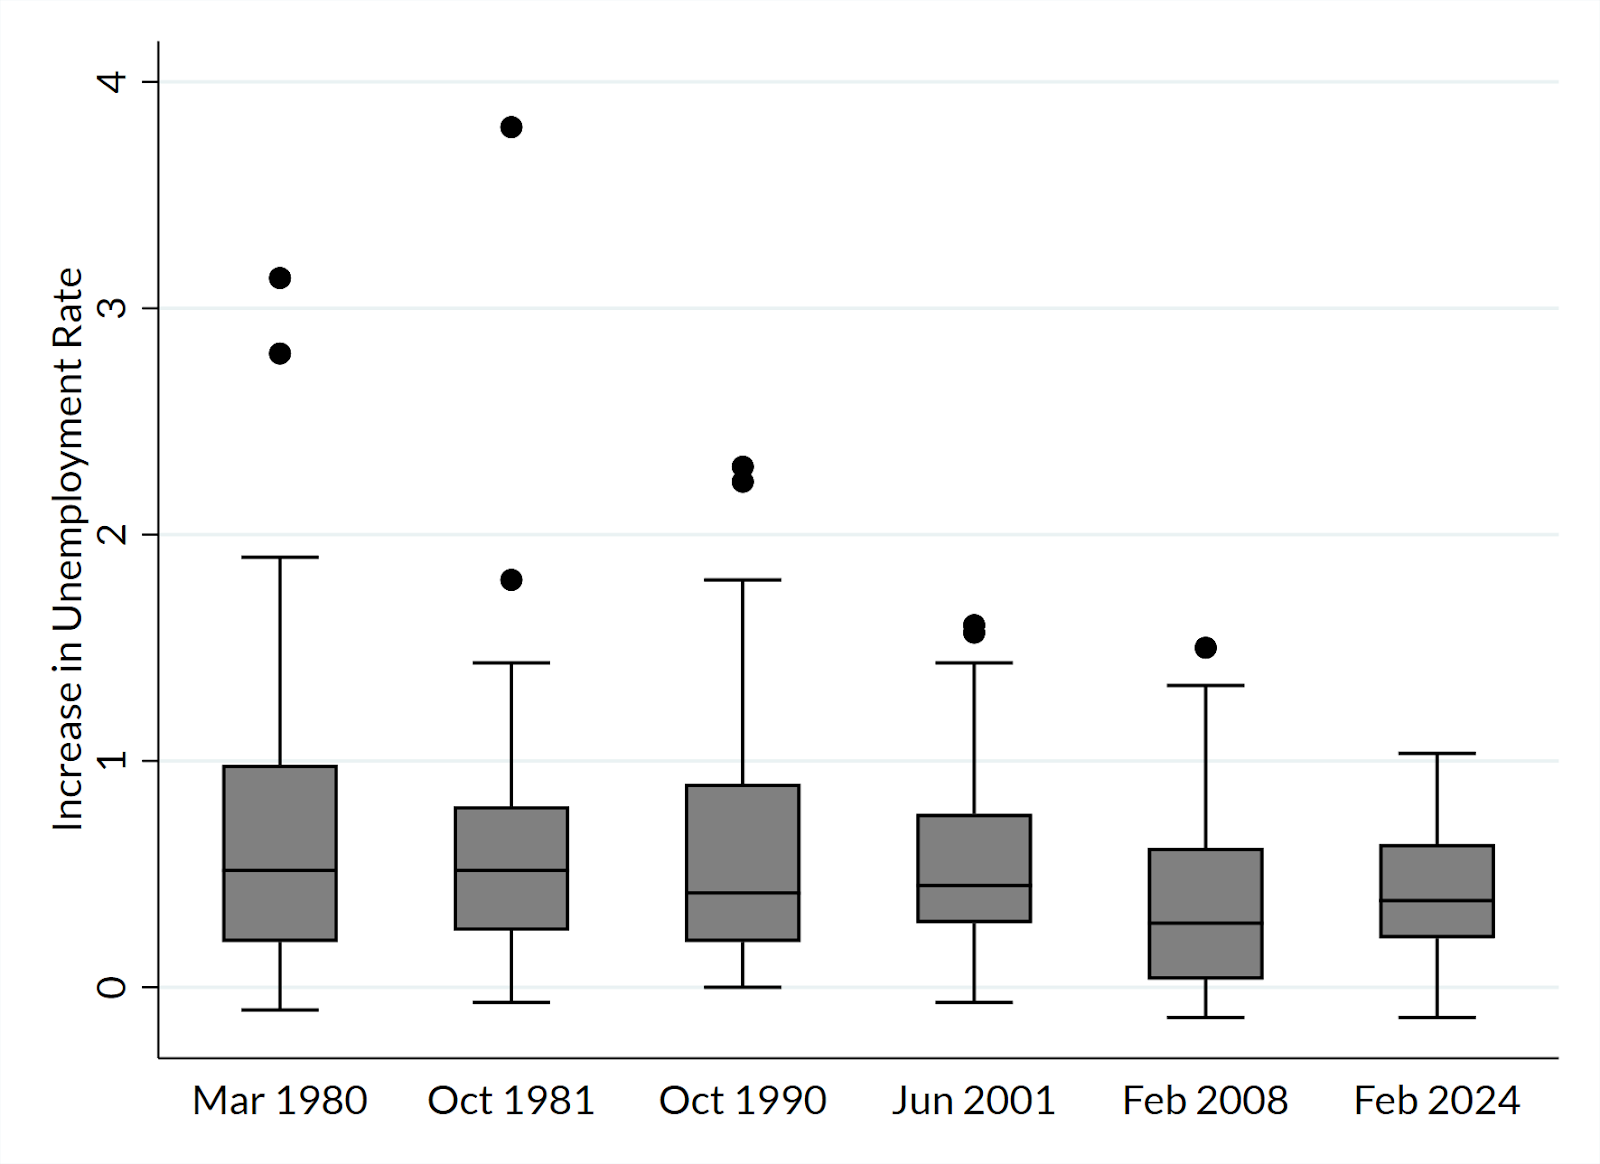
By contrast, the current increase in unemployment at the state level is fairly concentrated between 0 and 1 percentage point. This suggests that there isn’t some acute shock to the economy, which we would see show up in some states first.
The second is that currently, state-level changes in employment and unemployment are basically uncorrelated. Meanwhile, at the onset of the 1990 recession, state-level changes in employment and unemployment were correlated; states where unemployment was rising the most tended to also be the states where employment was falling the fastest. This also generally the case during the onset of previous recessions.
Month | Correlation Between State-level Sahm Statistics and Employment Analog (Weighted by Labor Force) |
Feb. 2024 | 0.10 |
Apr. 2020 | 0.83 |
Feb. 2008 | 0.27 |
Jun. 2001 | 0.55 |
Oct. 1990 | 0.57 |
Oct. 1981 | 0.58 |
Mar. 1980 | 0.84 |
The lack of correlation between the change in employment and unemployment suggests that the rise in unemployment in particular states is not necessarily reflective of a weak labor market in those states. Rather, it suggests that some of those states are seeing unemployment rate increases due to an increase in the labor force.
One possible explanation that Claudia Sahm has proposed is that immigration is leading to faster growth in the labor force, leading to a temporary increase in the unemployment rate as these workers find jobs. That’s a plausible explanation, but we won’t know for sure until we get better estimates of immigration. Whatever the case, a more complete view of state level unemployment trends shows that the recent rise in state-level unemployment is very different from similar rises during the beginning of previous recessions. While some measures of state-level unemployment rate trends may look alarming, it’s more likely that these trends reflect differences in state-level trends in population growth and/or labor force participation.
Fed Outlook
The continued strength of the labor market is going to reduce perceptions of the labor market risks at the Fed, and push back the scope and timing of cuts. There’s nothing raising any serious flags in this month’s labor market data, and if inflation continues to be bumpy the Fed will continue to feel more comfortable holding rates higher for longer.