Headline Numbers
- Nominal GDP grew 5.8% year-over-year and at a 4.8% quarter-over-quarter annualized rate in the fourth quarter of 2024. Inflation-adjusted GDP grew 3.1% year-over-year and at a 3.2% quarter-over-quarter annualized rate.
- GDP growth this quarter was supported by consumption and government spending, while investment played a more muted role.
- Nominal investment grew 3.7% year-over-year as of 2023Q4, but only grew at a 4.9% quarter-over-quarter annualized rate in the fourth quarter of 2024, down from the Q3 reading of 11.1%. Inflation-adjusted investment grew 1.8% year-over-year and at a 0.5% quarter-over-quarter annualized rate, down from 2.3% in Q3.
Topline Interpretation
- Fourth quarter GDP reports for 2023 came in stronger than anticipated, setting up the runway for continued growth in measured productivity. Where many predicted a 2023 recession, the data instead saw the year end on steady growth buoyed by strong consumption.
- Nominal growth remains strong, which is critical for business and household balance sheets, as well as the overall business cycle. Nominal investment is still rising, as is nominal consumption. The first step to a recession is a reversal of one or both of these dynamics.
- Lower inflation readings in Q3 and Q4 mean continued nominal investment gains “count for more” in inflation-adjusted terms than they have in recent years. Producer Price Indices for many industries saw little growth in the final quarter of 2023, and that inflation moderation is reflected in steady growth in inflation-adjusted investment.
- Interest rates may be providing headwinds to investment in certain sectors, especially relative to a lower interest rate counterfactual. Monetary policy continues to suppress residential investment, although that investment may have found a bottom for this cycle.
- As the Fed looks to the scope and pace of interest rate normalization in 2024, it is important that they bear in mind the investment implications of higher interest rates. Slower investment weakens the supply side and curtails productivity growth.
Cycle Indicators
Nominal Investment
Looking at nominal investment levels is the easiest way to understand the business cycle – investment is the most volatile contributor to overall GDP. Nominal volumes are key for understanding how much cash is actually changing hands in the economy, and what that means for firm balance sheets up and down the supply chain.
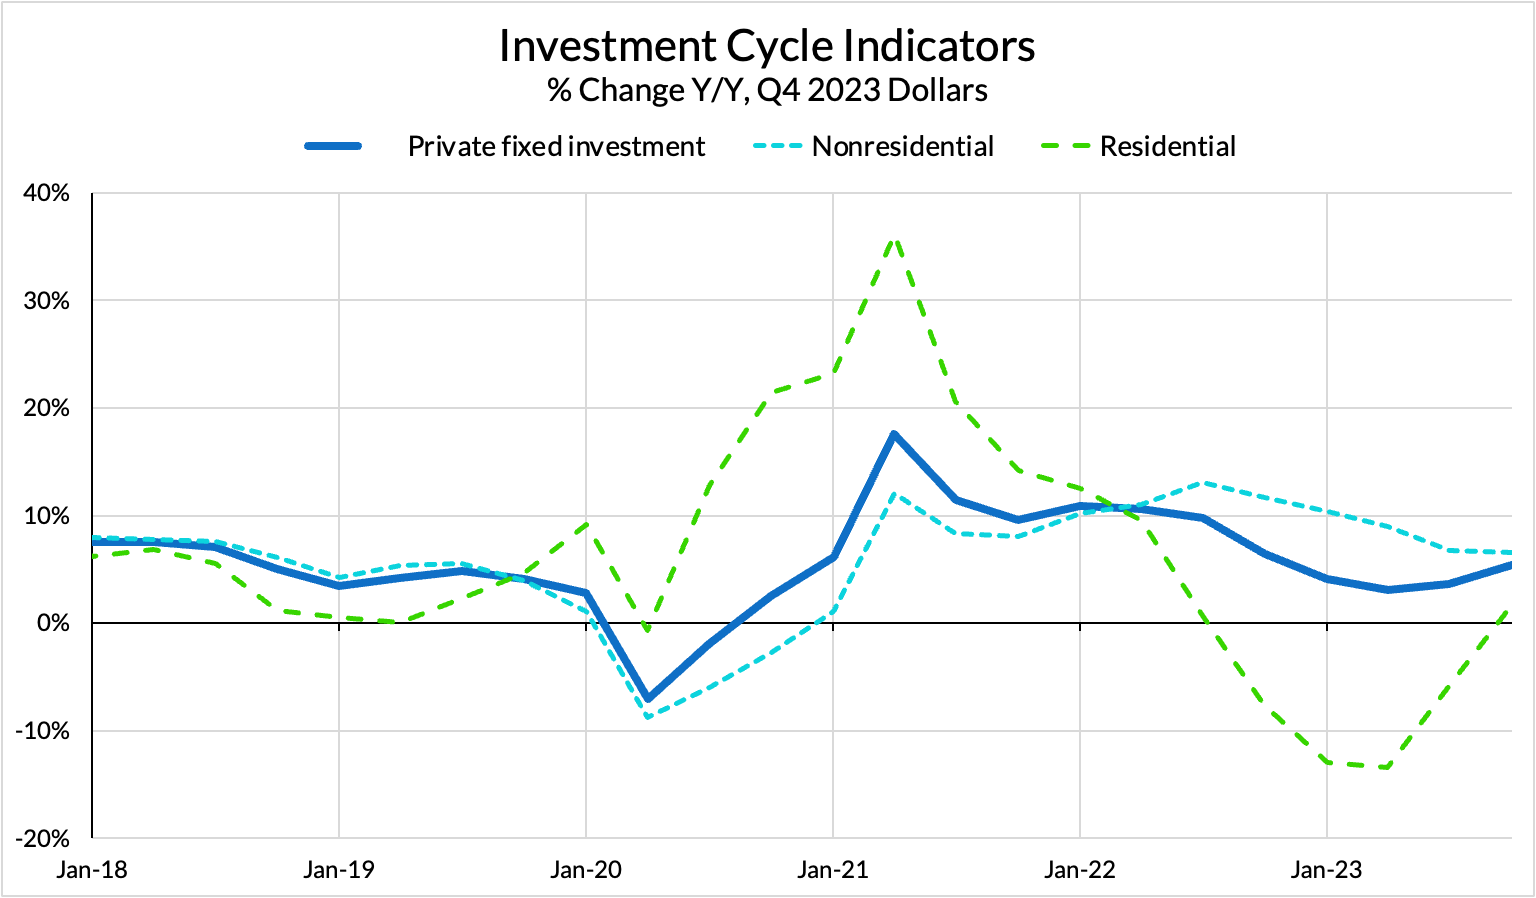
Nominal investment continues to grow, with Residential investment posting its first quarter of year-over-year growth since mid-2022.
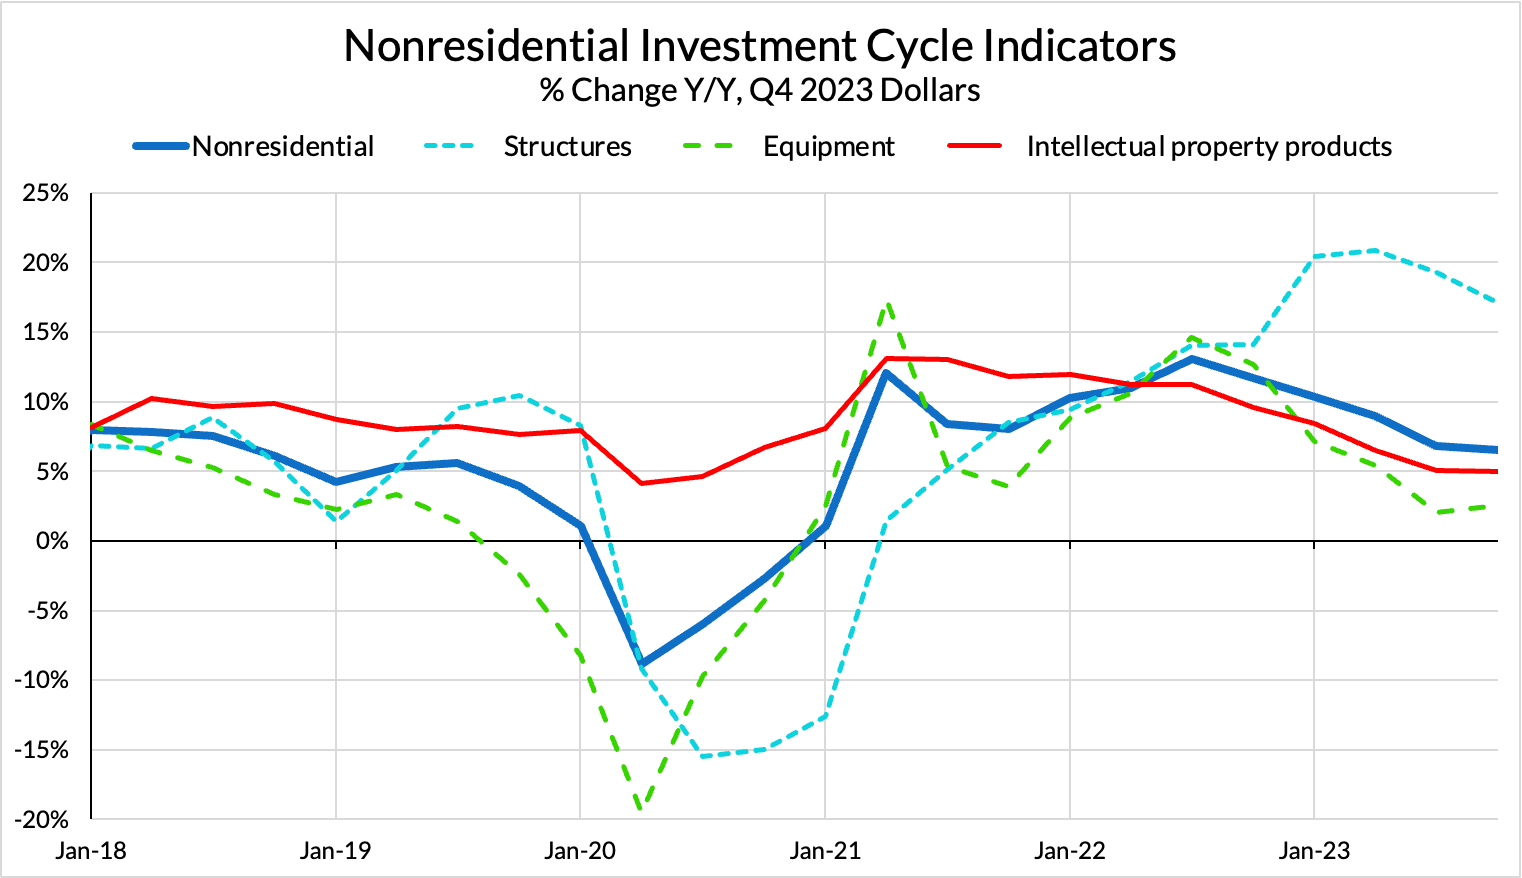
Growth in nonresidential investment slowed in the fourth quarter, with structures still the fastest-growing subcategory. The slowdown in equipment investment may also be finding a bottom.
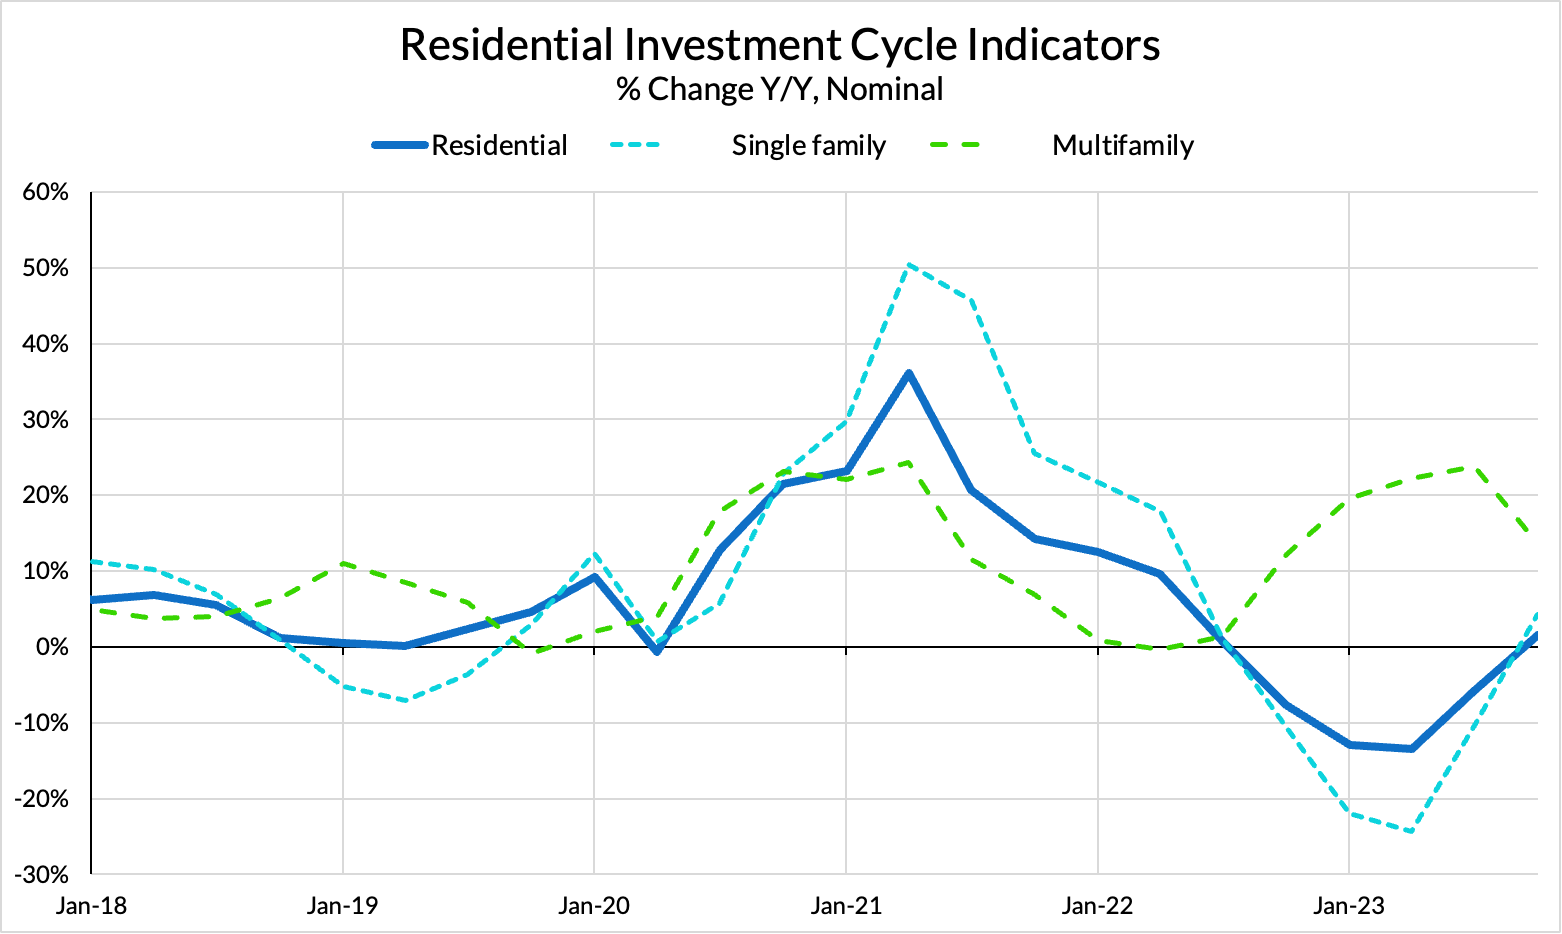
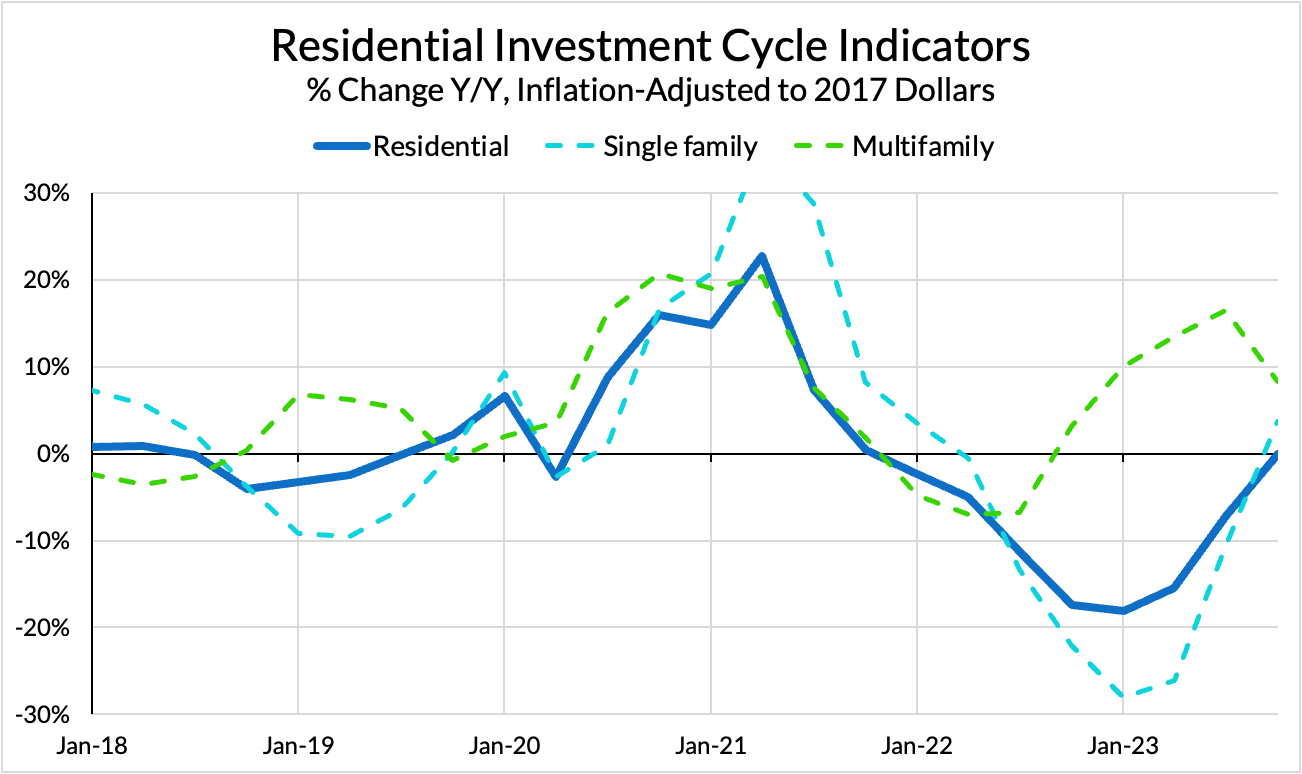
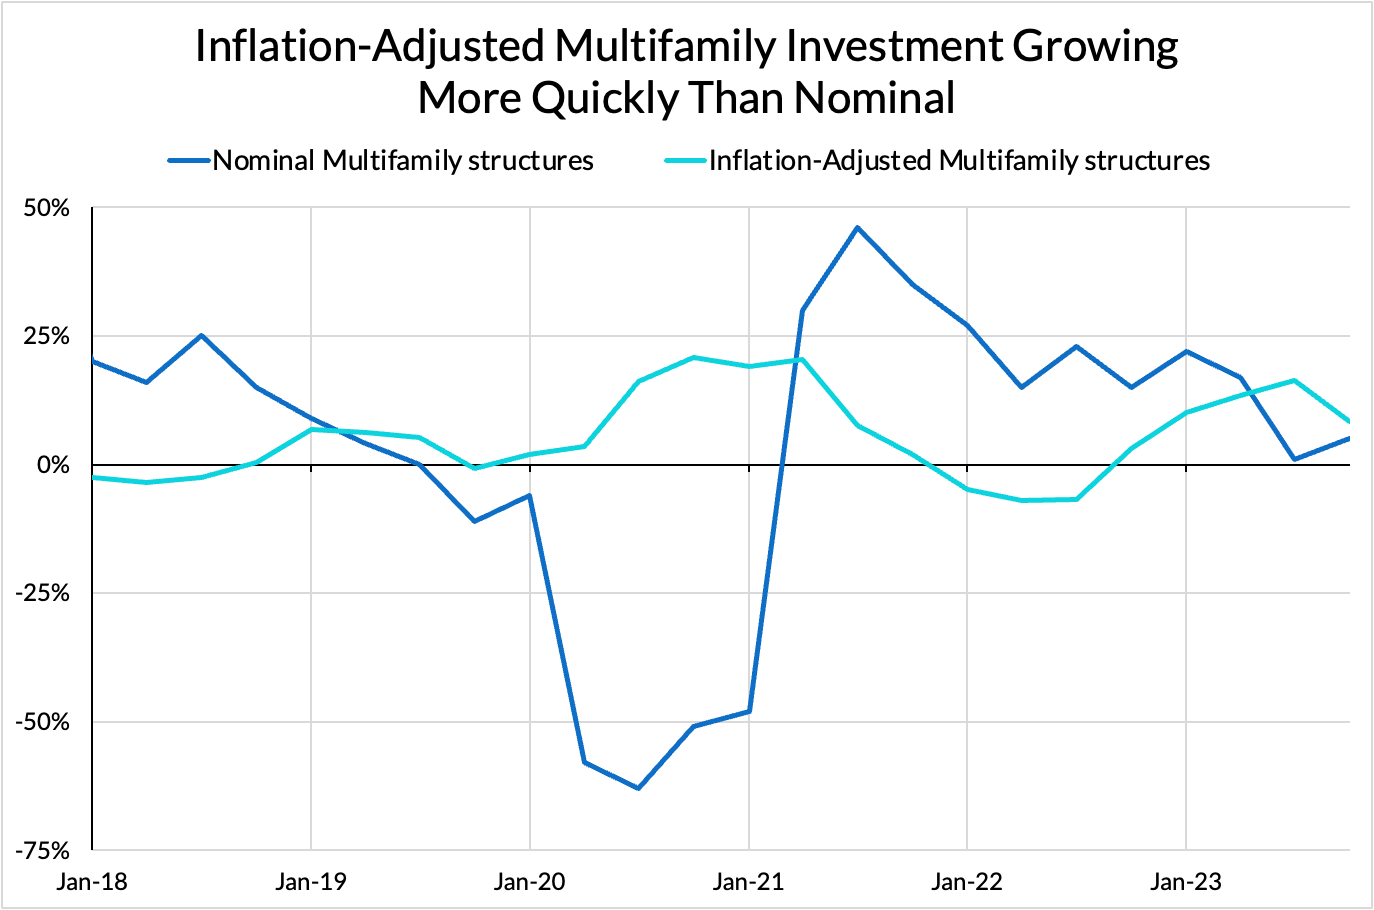
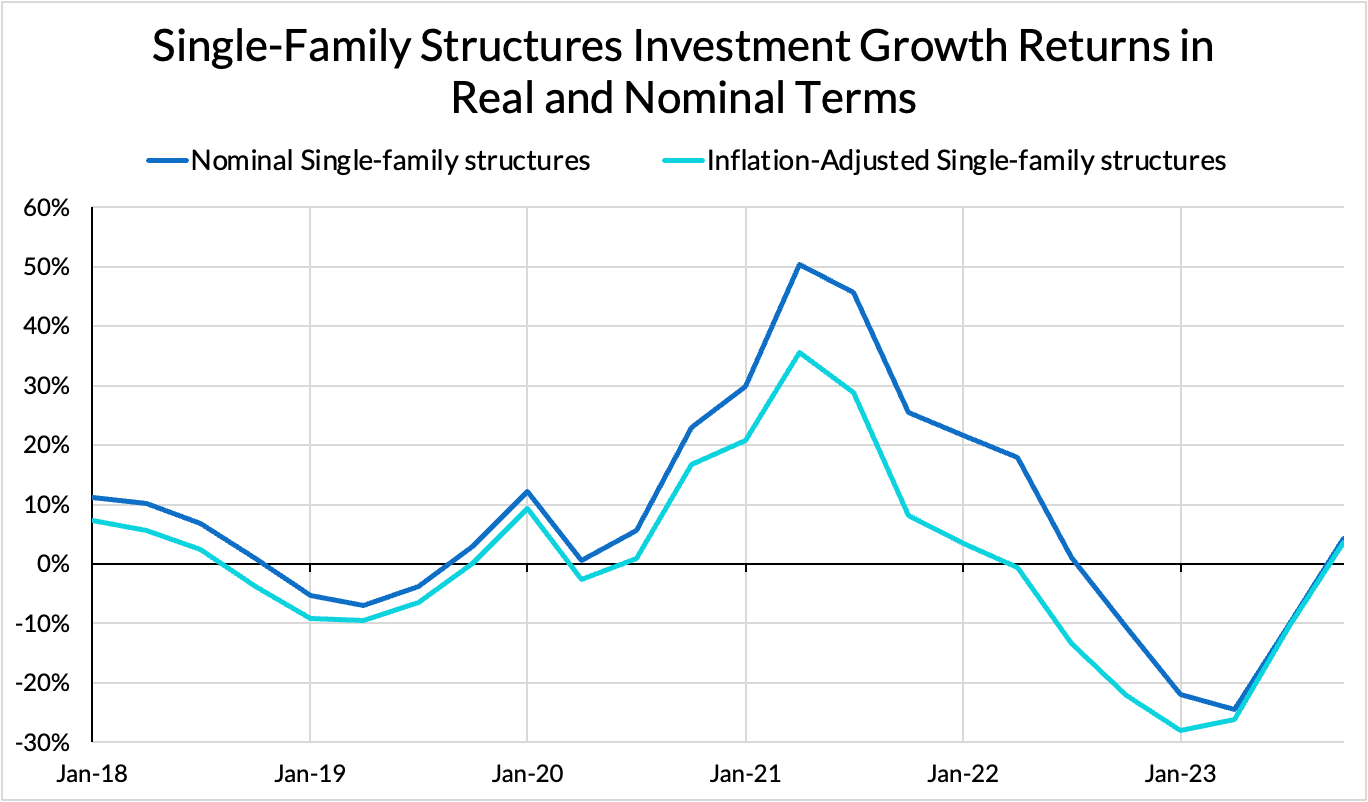
In Q4, growth of investment into single family houses has finally turned positive, flipping the overall residential investment aggregate positive as well. Multifamily investment growth looks to be decelerating as higher interest rates begin to impact more project pipelines.
Inflation-Adjusted Investment
As inflation has come down and nominal investment volumes have held steady, we have seen a substantial acceleration in measures of inflation-adjusted investment. This is good news, and reaffirms the possibilities put forward by my colleague Skanda Amarnath in multiple pieces on reasons to anticipate further productivity growth. We absolutely saw evidence of that measured productivity growth in this most recent report.
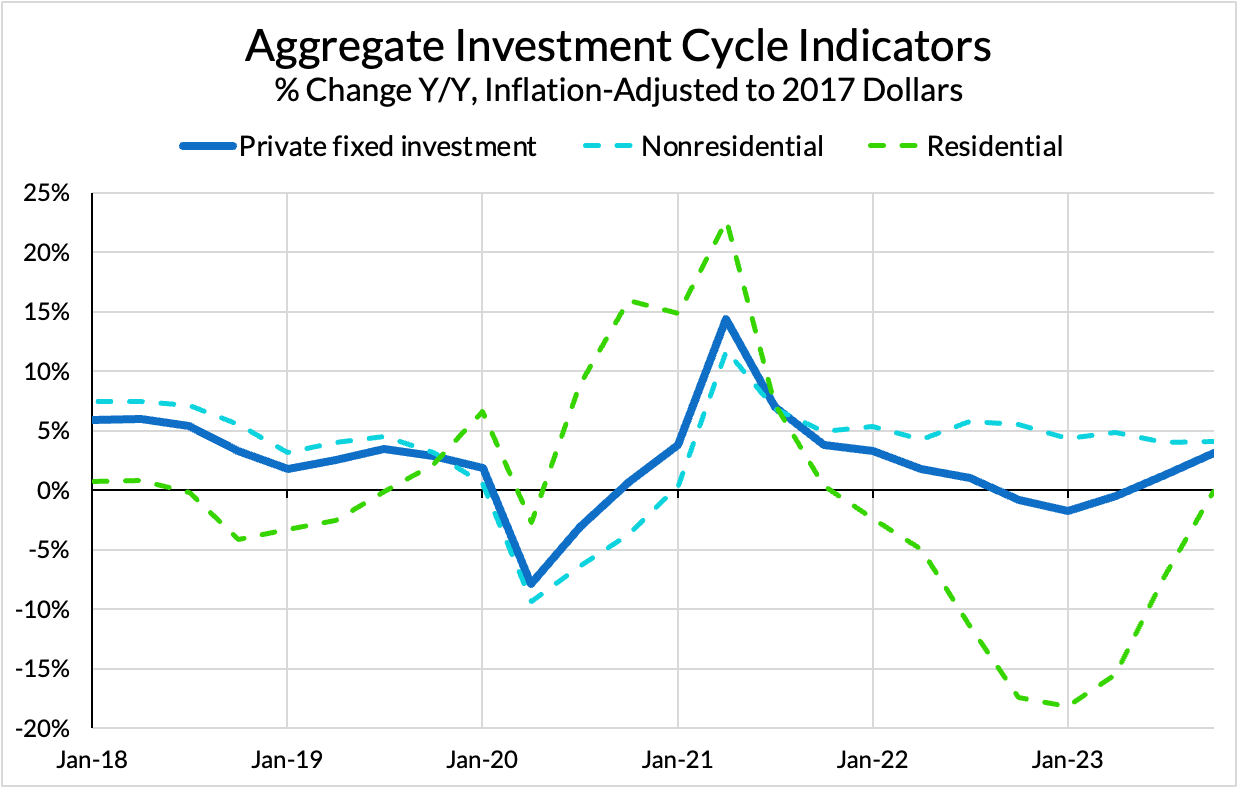
Viewed in inflation-adjusted terms, growth in nonresidential investment looks much more level than it does when viewed in nominal terms. Residential investment does not look much better in inflation-adjusted terms than it does in nominal, however.
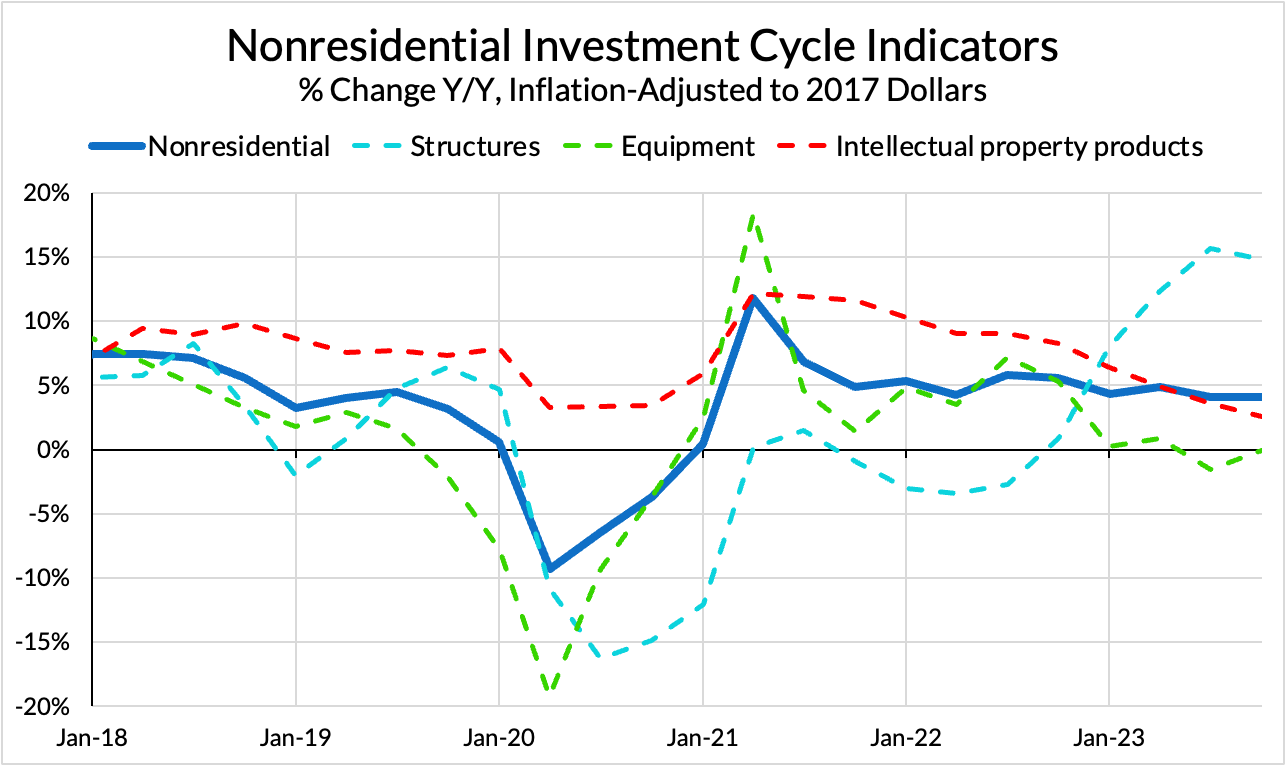
Nonresidential investment growth continues to see the strongest performance in the Structures category, after adjusting for measured inflation. Intellectual property products do seem to have noticeably weaker growth in inflation-adjusted terms than in nominal terms.
Strained supply chains have been a substantial drag on residential investment in recent years, increasing the prices for key inputs. As these problems resolve and financial conditions loosen, we can expect to see some return to investment growth here, albeit starting from a markedly lower level than in 2022.
Heatmaps
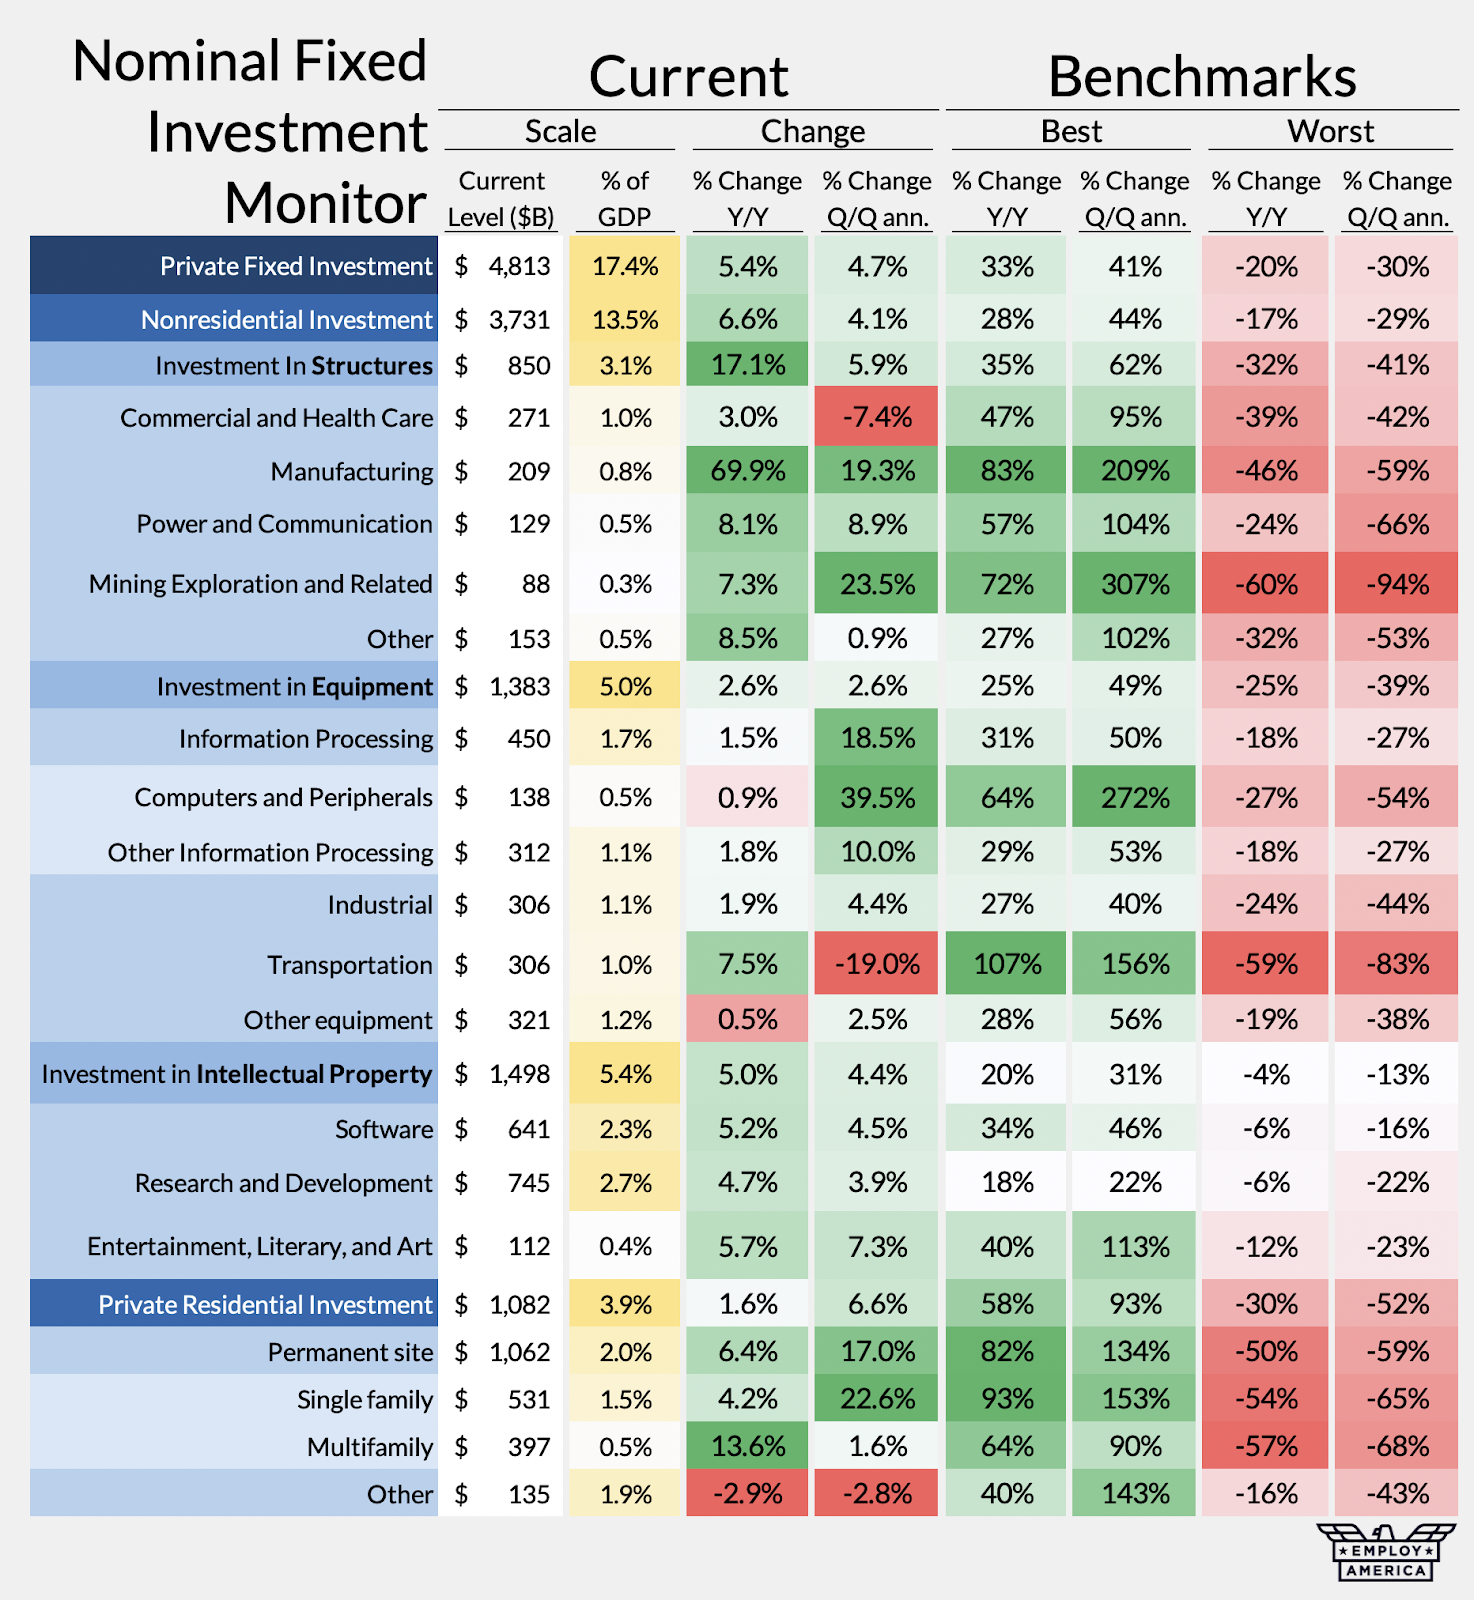
We can see a few things in the table above. The biggest growth in equipment investment was in Information Processing, specifically Computers and Peripherals. This is a welcome sign, given that we should expect to see more CHIPS Act-related investment coming down the pike. The continued strength in Manufacturing Structures is likely to be with us for some time as well, as industrial policy programs work to encourage further investment.
The big dark spot – Transportation – is tied to the UAW strike, about which we will talk more below. The other dark spot is in Commercial and Health Care, which may speak to softness in the commercial construction landscape. On the whole, we see growth slowing in a number of categories, and growth accelerating in categories that had recently experienced slowdowns.
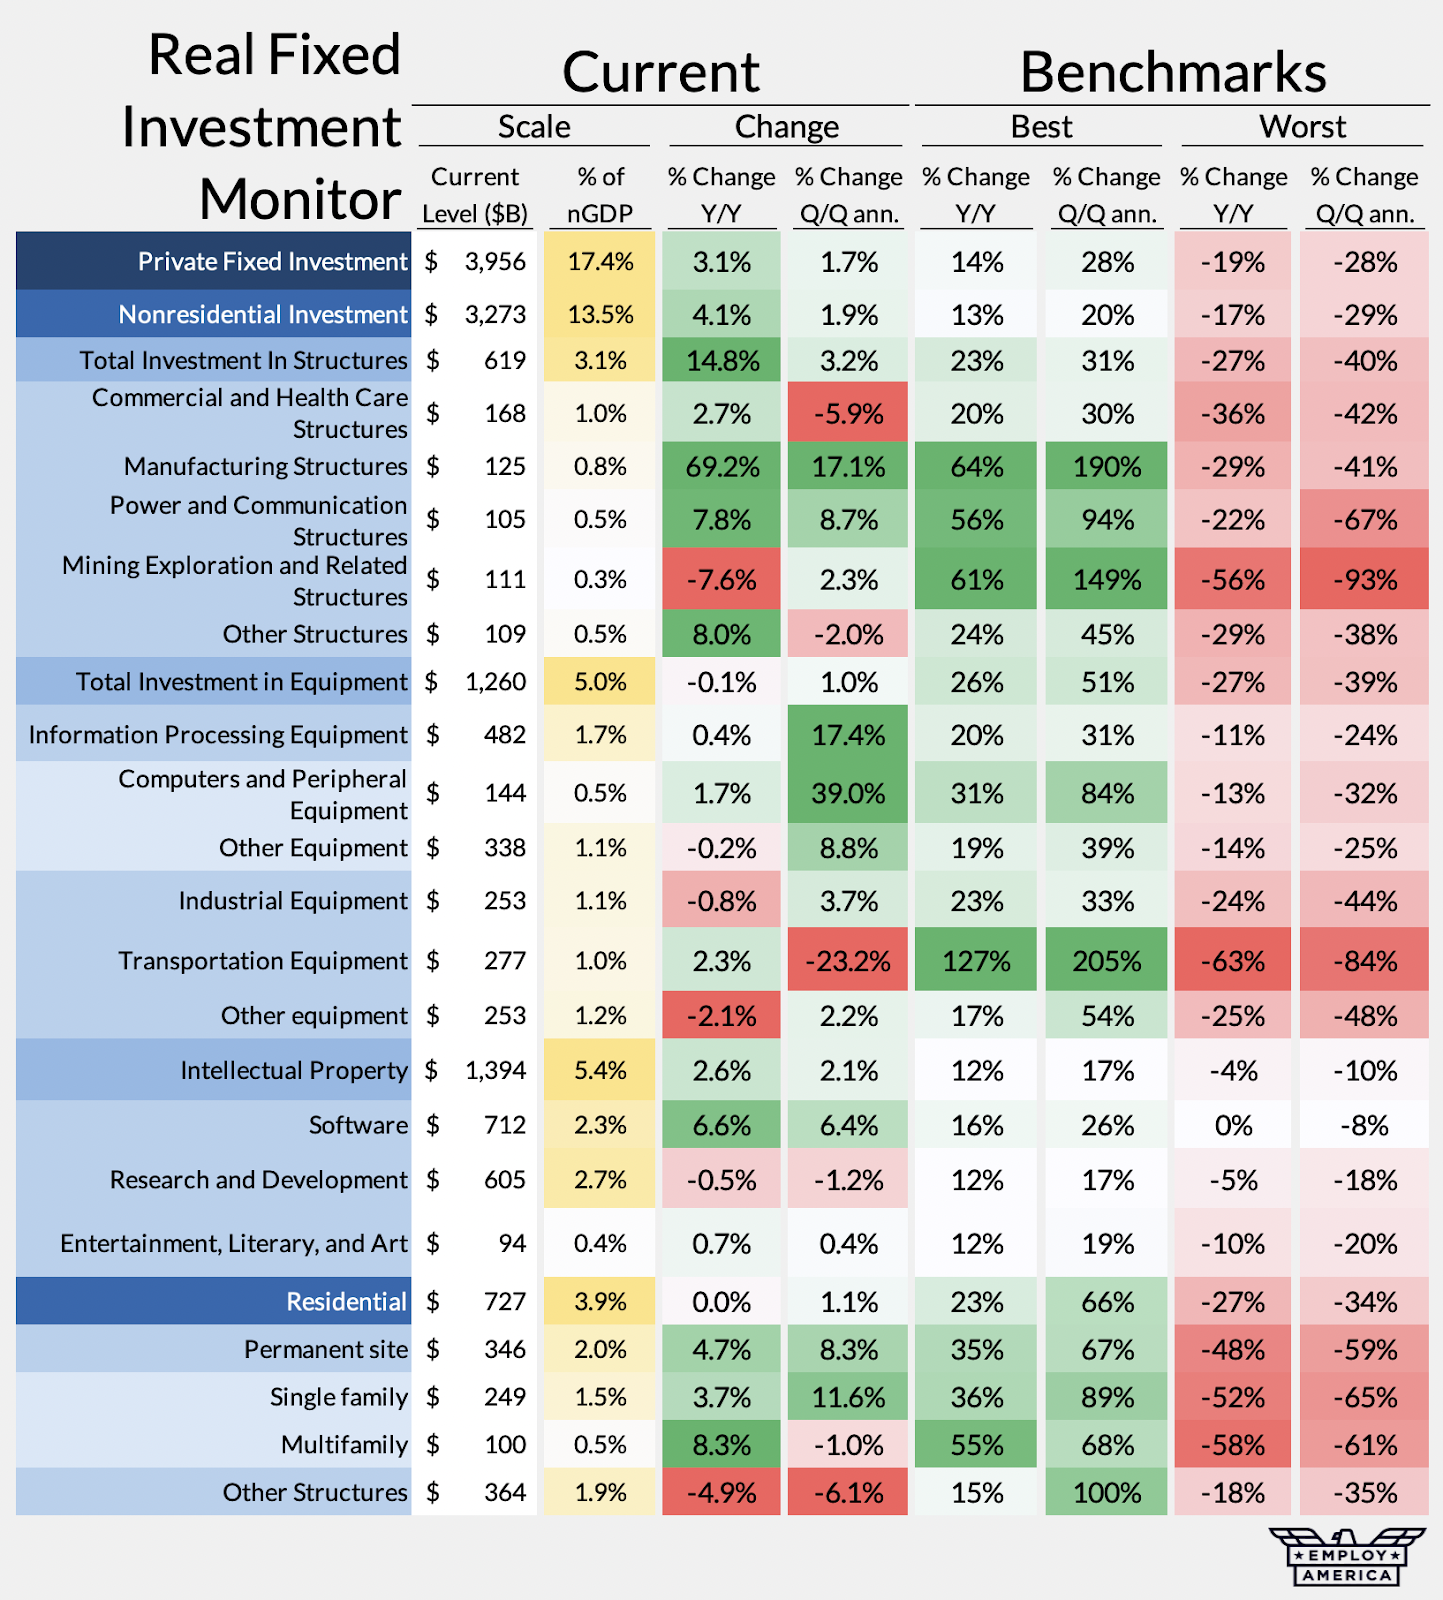
The inflation-adjusted picture looks broadly similar, but with more weakness in Mining Exploration and Related Structures given movements in the relevant price indices. The Residential Investment turnaround also looks a little weaker after adjusting for input cost increases.
Stories In The Investment Picture
Monetary Policy and Housing Supply
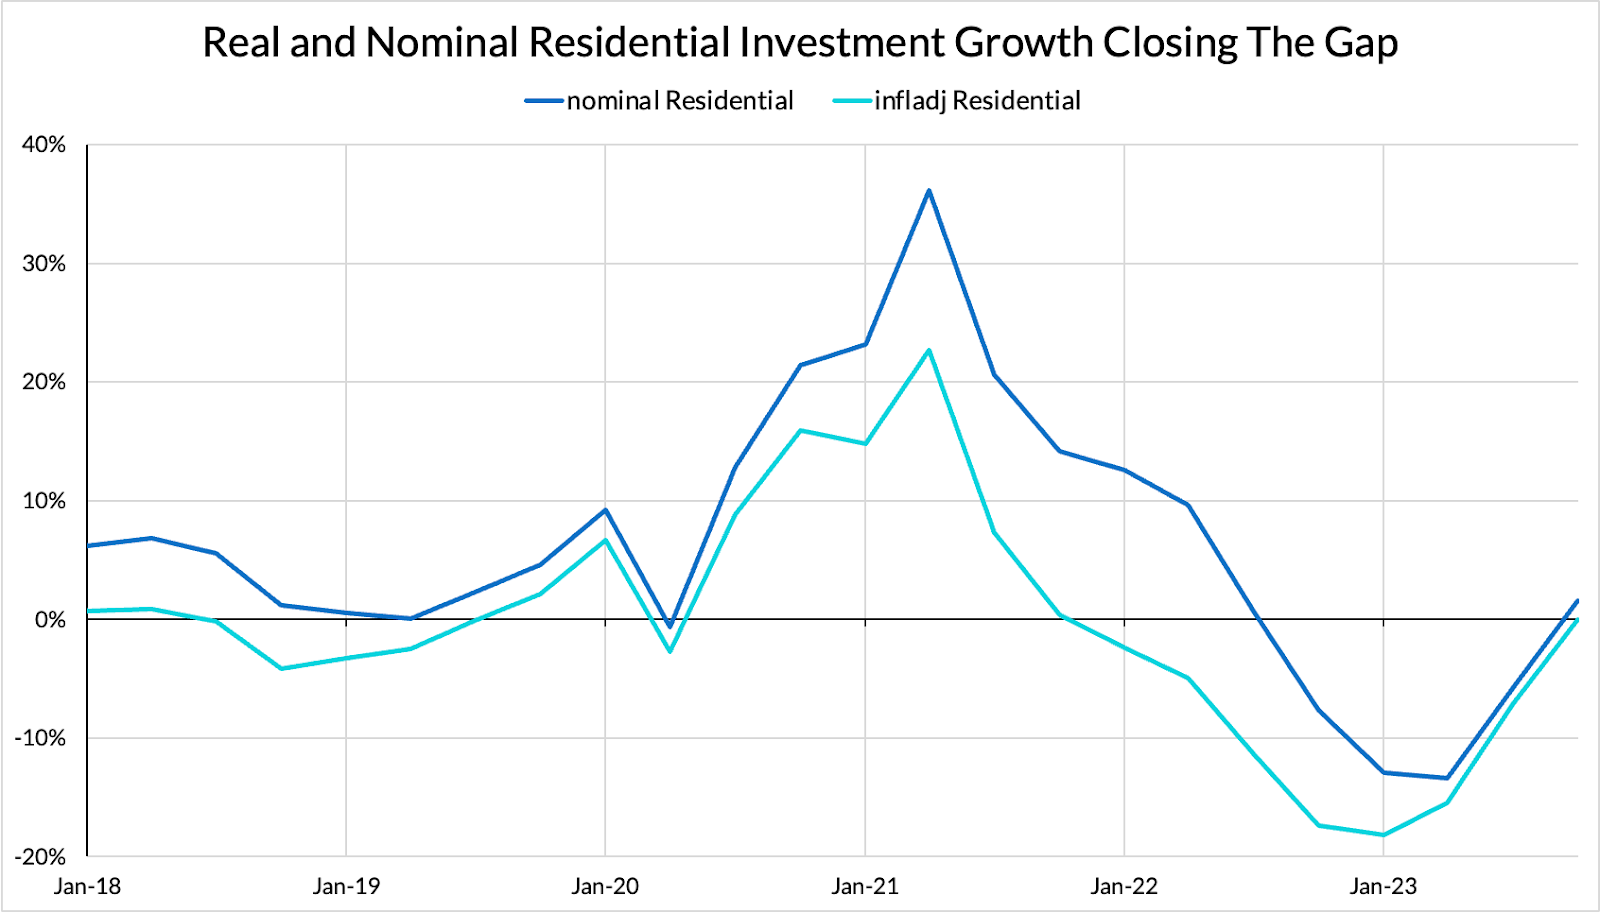
Residential investment is still substantially off its highs, following around eighteen months of contraction, but is now slowly coming up. As we saw in the cycle indicators above, residential has been the main drag on investment since the Fed began to really hike rates in earnest. This looks to be pretty solidly an effect of monetary policy choices. The downturn in nominal spending tracks the timeline of rate hikes, and will likely begin to grow again as financial conditions ease and interest rates normalize.
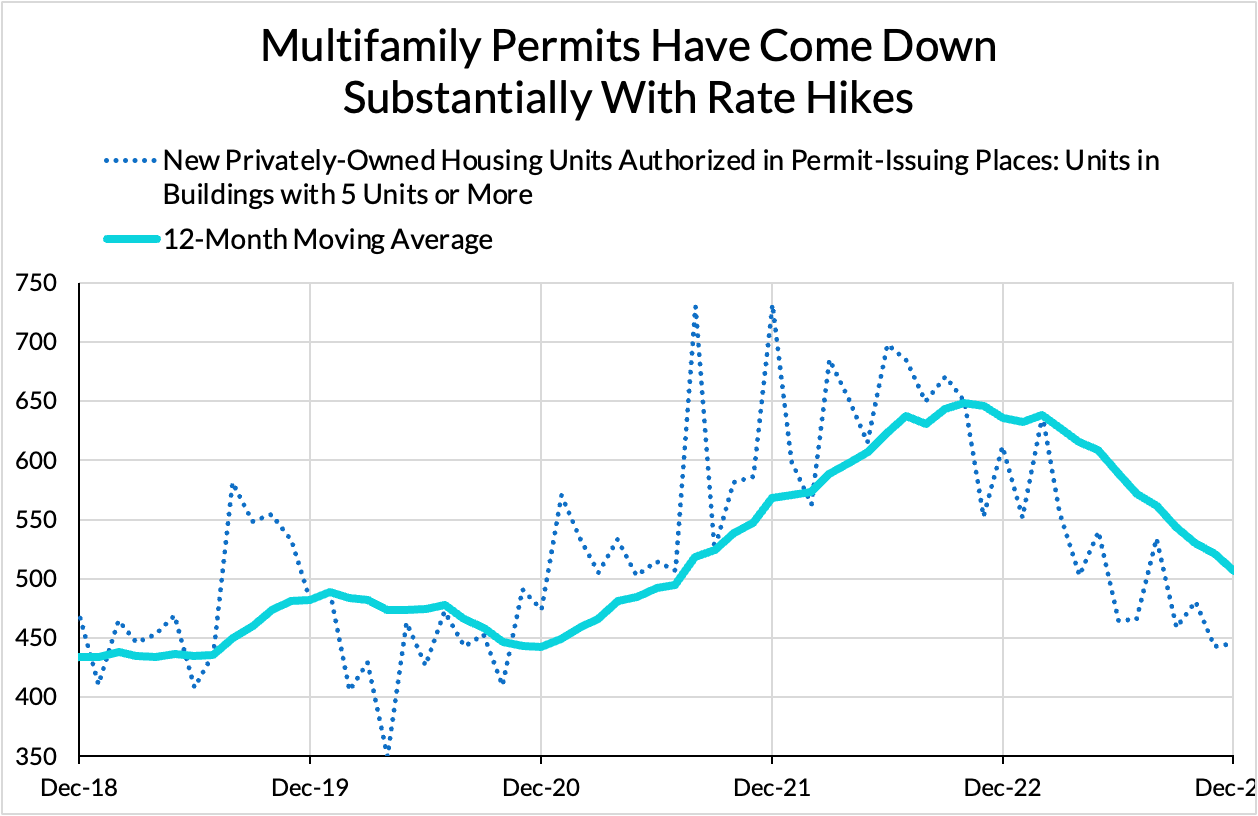
In the long run, these kinds of slowdowns in residential investment are bad for the inflation picture. Stable measured housing inflation depends on a steady supply of housing coming online, as demographics change and structures depreciate. High interest rates have slowed the pace of multifamily permit issuance, risking a drought of supply a few years down the line.
When wages rise, but housing supply can’t keep pace, rents can bid up quickly. Since the housing inflation data ultimately tracks back to the rental housing market, using monetary policy to slow residential investment looks somewhat perverse from a long-term dual mandate position.
Slowing housing supply chains now might ease elevated costs due to residual supply chain pressures, but at the cost of housing inflation down the line. But there are other alternatives like we see from Montgomery County for governments at all levels to use alternative fiscal means to help protect local developments (especially those heavy on affordable housing) from the prevailing interest rate environment.
Transportation Equipment Slowdown
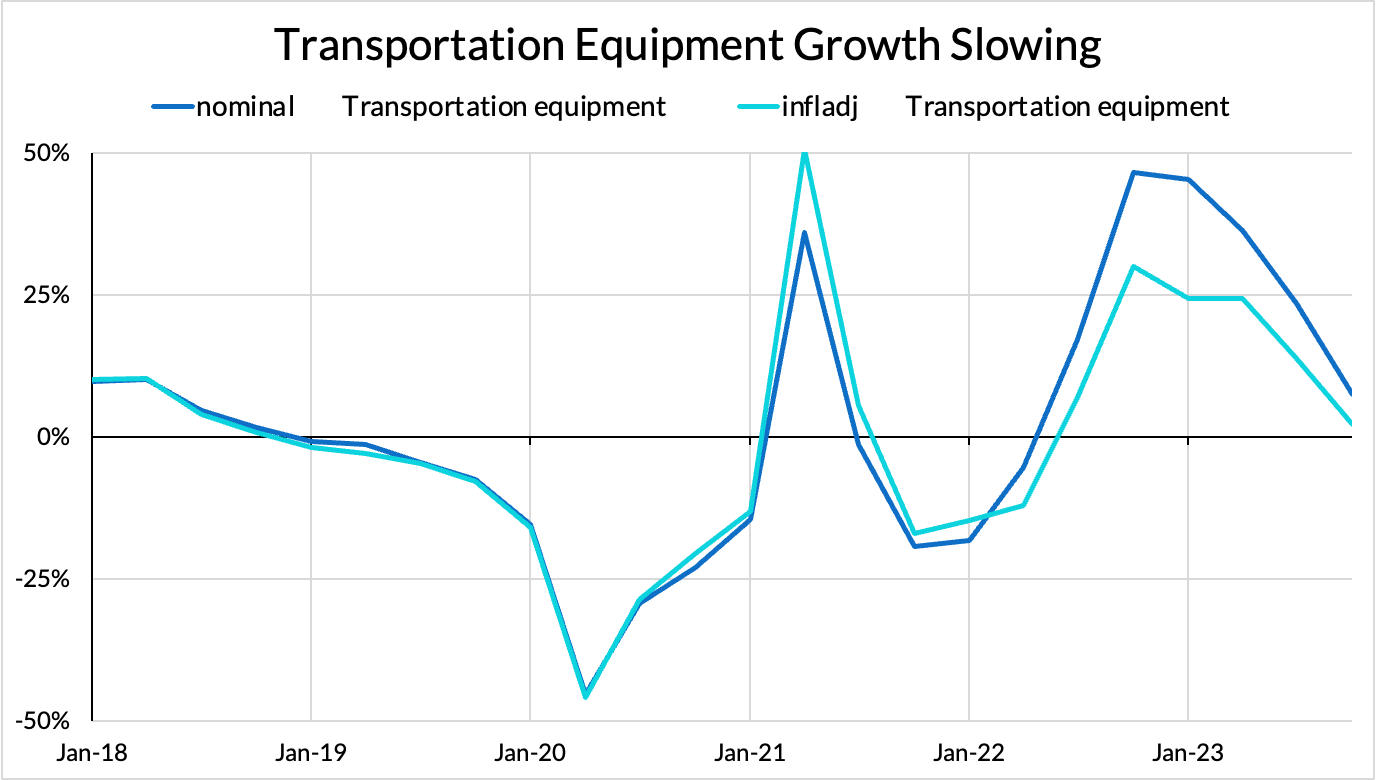
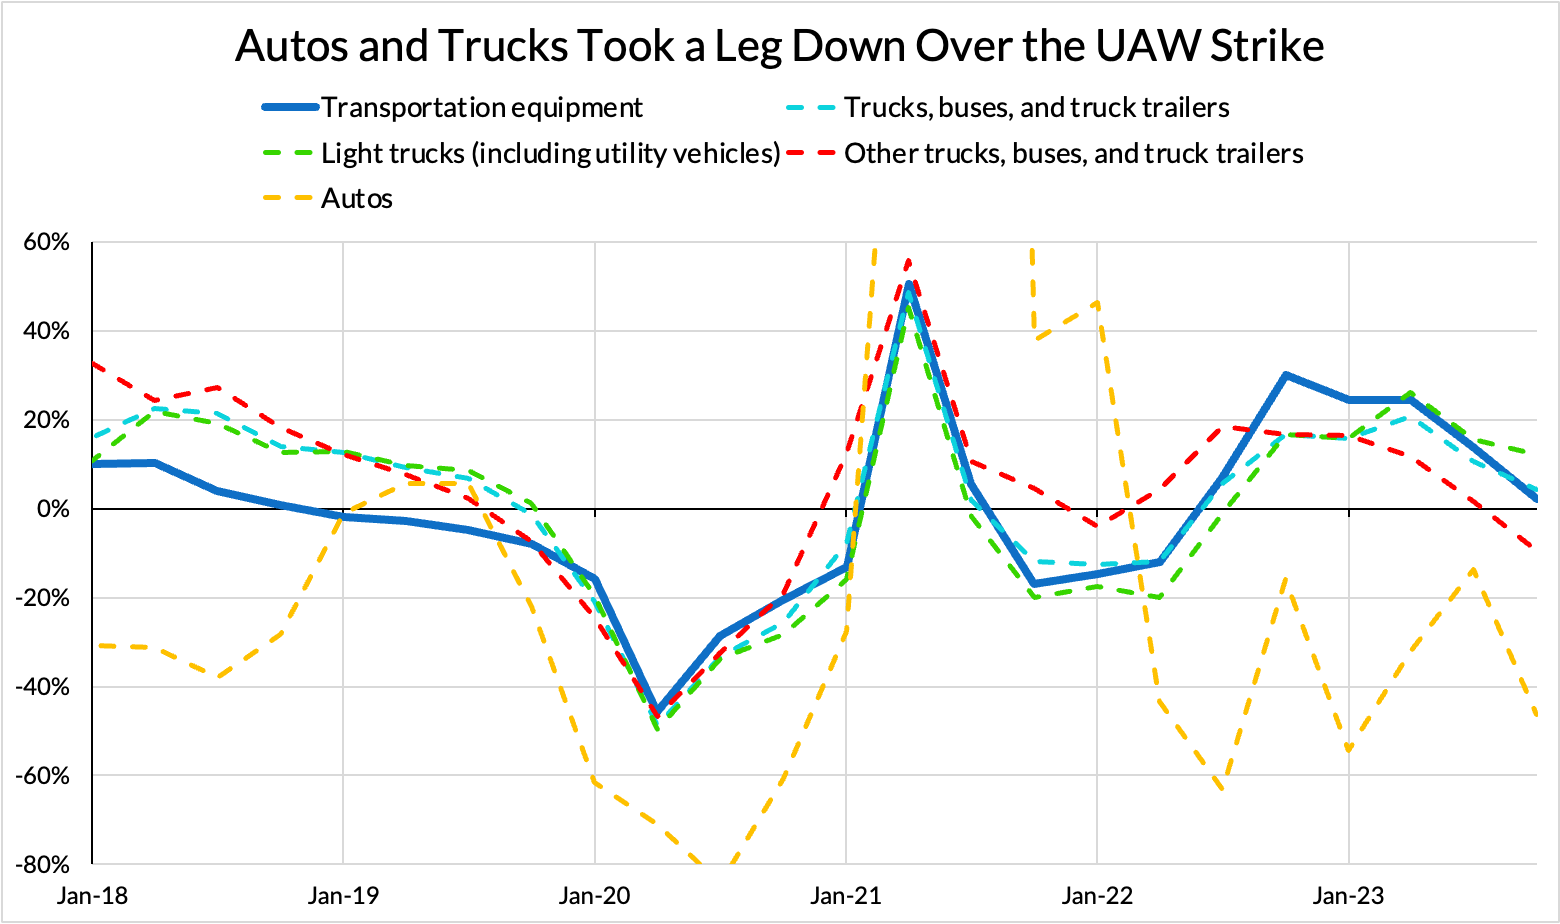
The slowdown in transportation investment is notable in this month’s data release. Some of this is about the UAW strike – which took place over the period this data release covers – as we can see from the performance in the autos section.
Some of this is about aerospace, and that may get worse given all the news around Boeing planes lately.
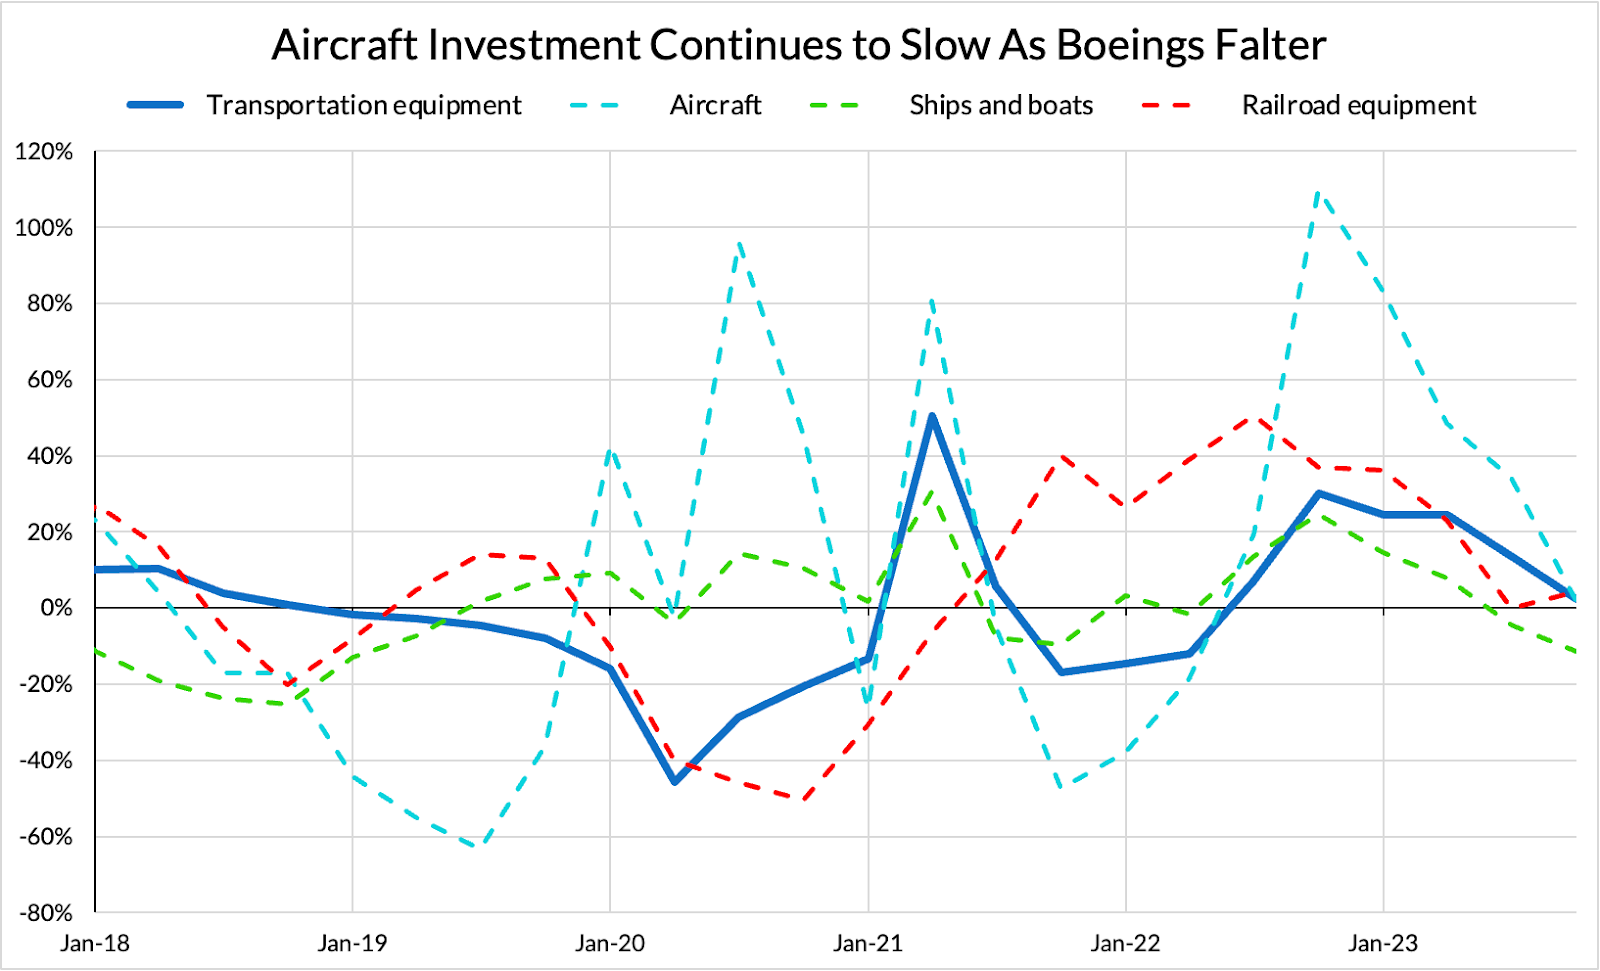
We can expect auto production to come back — it has not not fully returned to pre-strike levels in the industrial production data, but it is definitely on the way. Depending on how Boeing's current struggles shake out, it will be interesting to see how aggregate investment reacts to shifts in aerospace investment. Aerospace is a large sector, and has already been facing a complex recovery from pandemic-era supply chain challenges.
Grid Equipment Slipping, Power Structures Accelerating
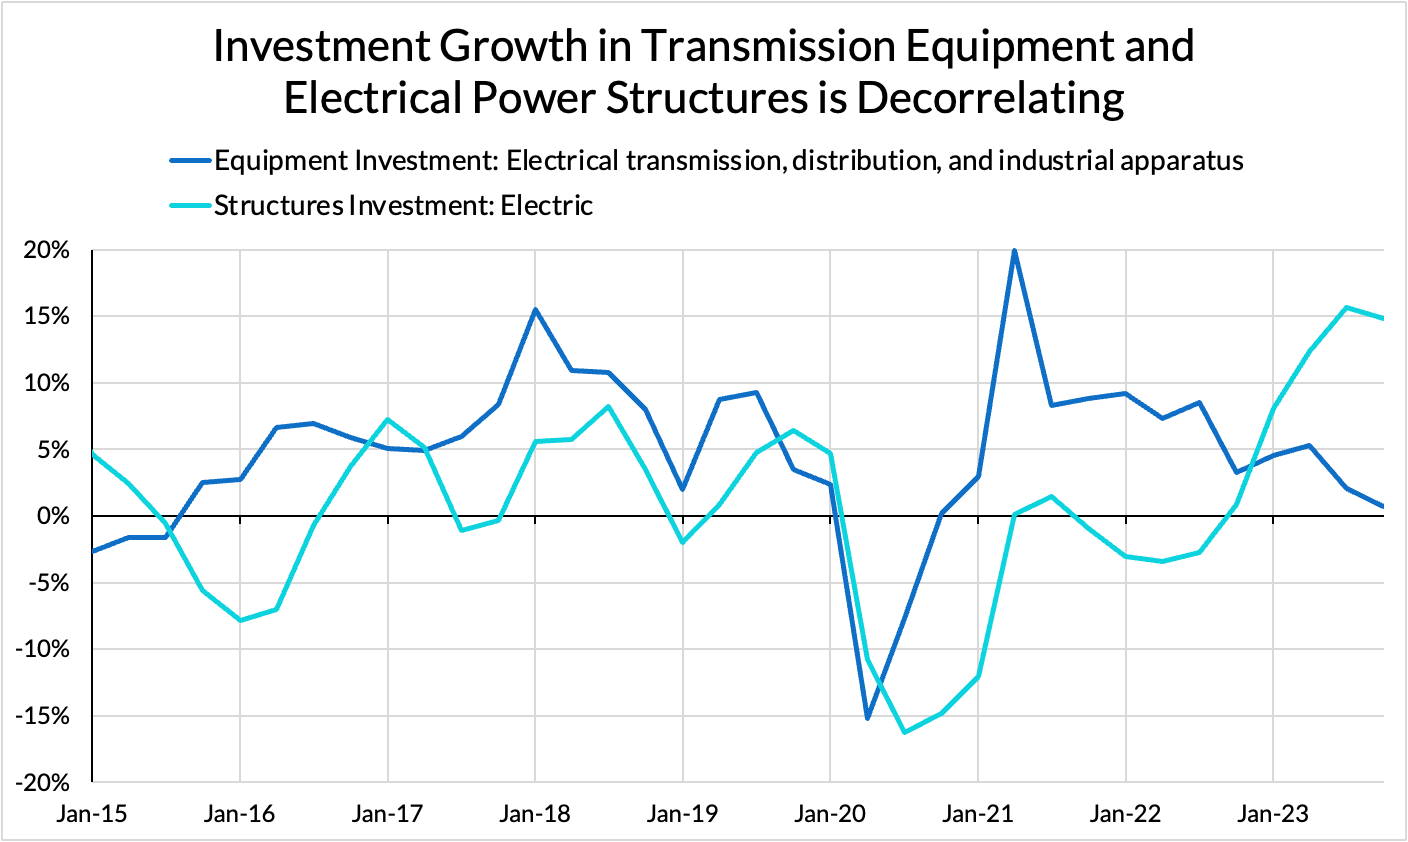
The chart above shows investment into the equipment necessary for standing up and interconnecting new parts of the electrical grid alongside investment growth for structures designed to produce electricity. Getting the grid up to spec nationally is a key plank in the renewable energy transition, yet the difficulties involved in accomplishing this are considerable, as the anemic investment data above shows. Imbalances in investment along these lines could quickly lead to implementation headaches, especially against a backdrop of volatile electricity prices and rising loads.
Part of the reason for slow transmission investment is likely the complicated structure of backlogs and permitting. This process is trying to go into overdrive, now that the government is financially encouraging greater investment into renewable energy, but it has already run into some snags.
It also may be that disruptions from the long-simmering transformer shortage have slowed the flow of investment here — lead times for the kinds of transformers necessary for substations and grid interconnects have blown out. As I had written in an October Supply Chain Monitor:
“The Department of Energy, among others, have noted the makings of a possible transformer shortage as well. Per ISM Services, transformers have been in shortage for over a year at this point. A transformer shortage threatens to limit the ability to expand the electrical grid in ways necessary to achieve the scale of decarbonization and electrification necessary for the climate transition. Lead times for new transformers are so blown out that “it could take 52 to 56 weeks to get new transformers instead of the typical 4-week turnaround from manufacturers” according to one electric cooperative CEO quoted in the article above. This shortage is due in part to limitations on the capacity to produce the grain-oriented electrical steel historically used to build these new transformers’ cores. In response, the Department of Energy is looking to encourage the implementation of transformers with cores made from amorphous steel for efficiency reasons, but the existing market and capacity for the production of that particular alloy is quite small. In fact, steel has been flipping into and out of reported shortage all year, while electrical transmission equipment has only been reported in shortage over the past two months. And yet, despite all this, Electrical Equipment is one of only two manufacturing industries reporting higher inventories in September. Hopefully those inventories start to make it to their customers.”
Without these critical parts, projects like new or expanded substations simply have to wait. Those transformers are in turn reliant on particular kinds of steel, of which the lead times involved in expanding capacity are already considerable and lengthening.
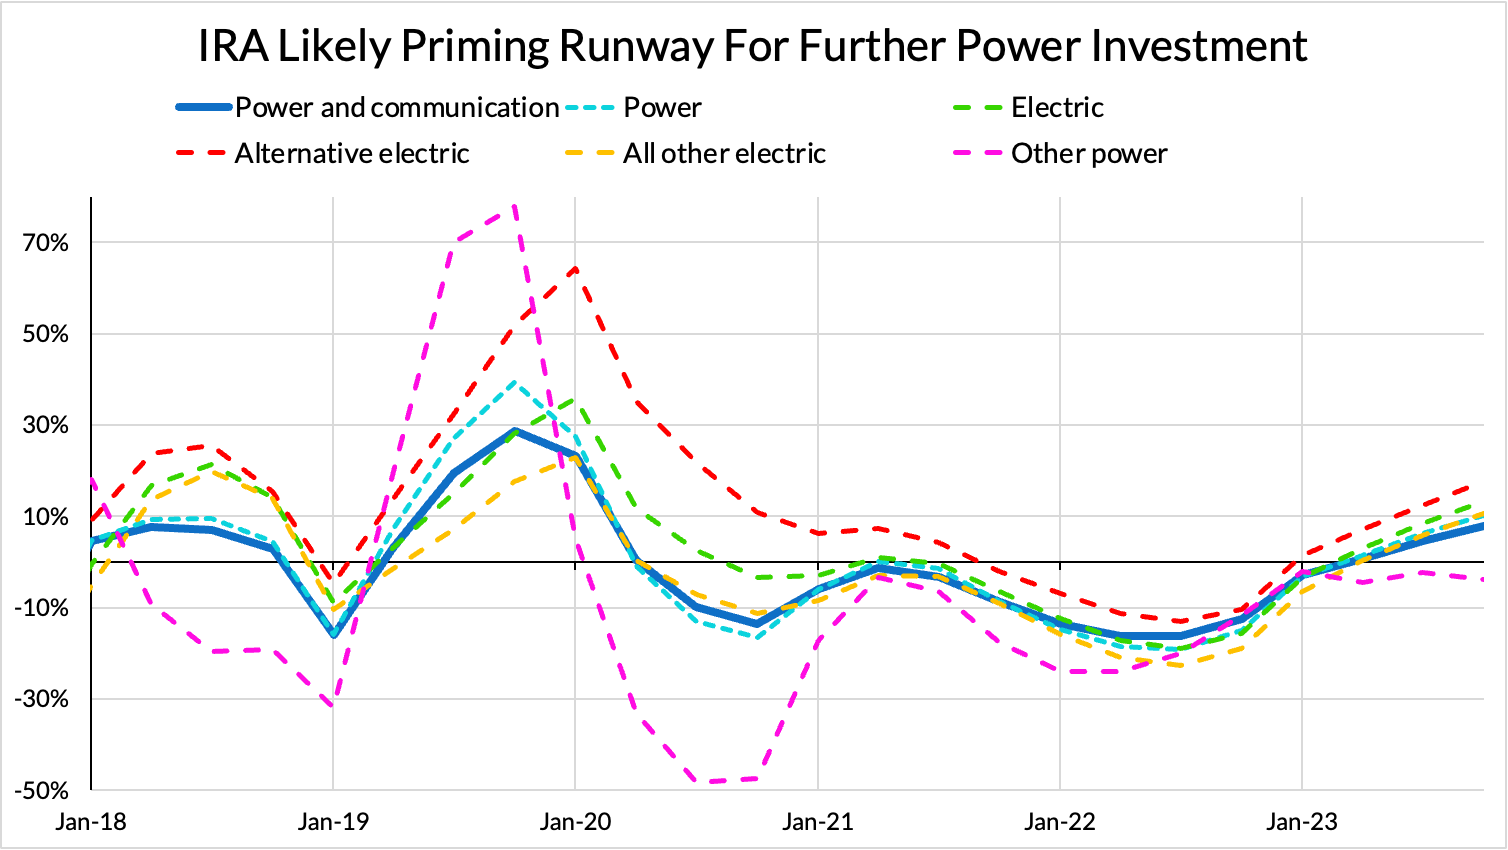
At the same time, we are seeing investment into power structures continue to grow. Those power structures will eventually have to plug into (likely new) grid equipment in order to deliver power to consumers. The interplay between the two will be interesting to watch as the IRA matures and more related projects come to fruition.