This monitor is a reflection of how we update our assessments of economic growth in real-time as we get meaningful updates from macroeconomic data releases. It provides a more timely and meaningful gauge of economic activity growth than what GDP and similar summary indicators provide. Please see here for more details about how to interpret this information. And reach out to us here if you would like to be subscribed to higher-frequency activity updates.
Summary: We are revising our core description of the US economy from "Growing, Slowing, Stabilizing" to "Nominal Deceleration Without Real Deceleration." Policymakers should be encouraged about the prospect for local supply-side improvement given these dynamics, including lower inflation and improved productivity growth.
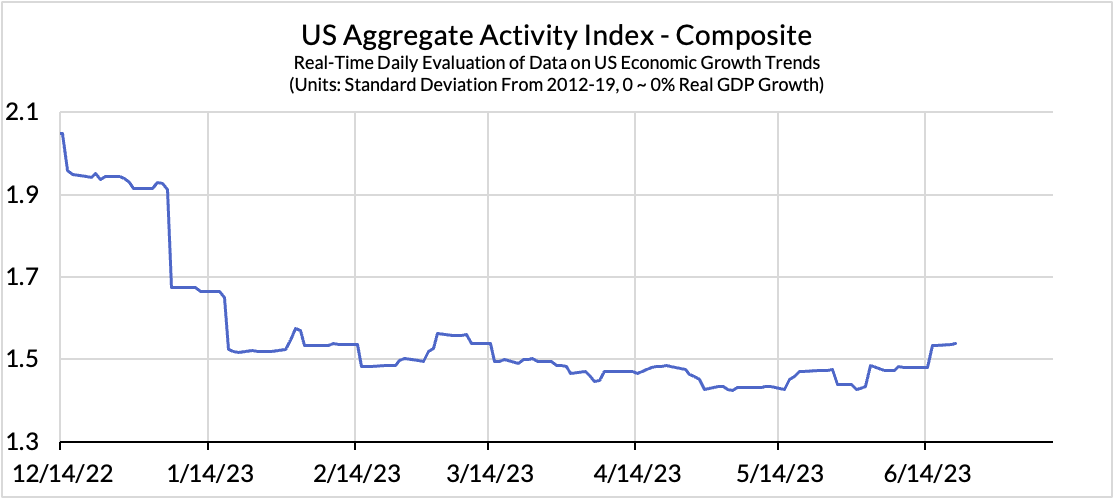
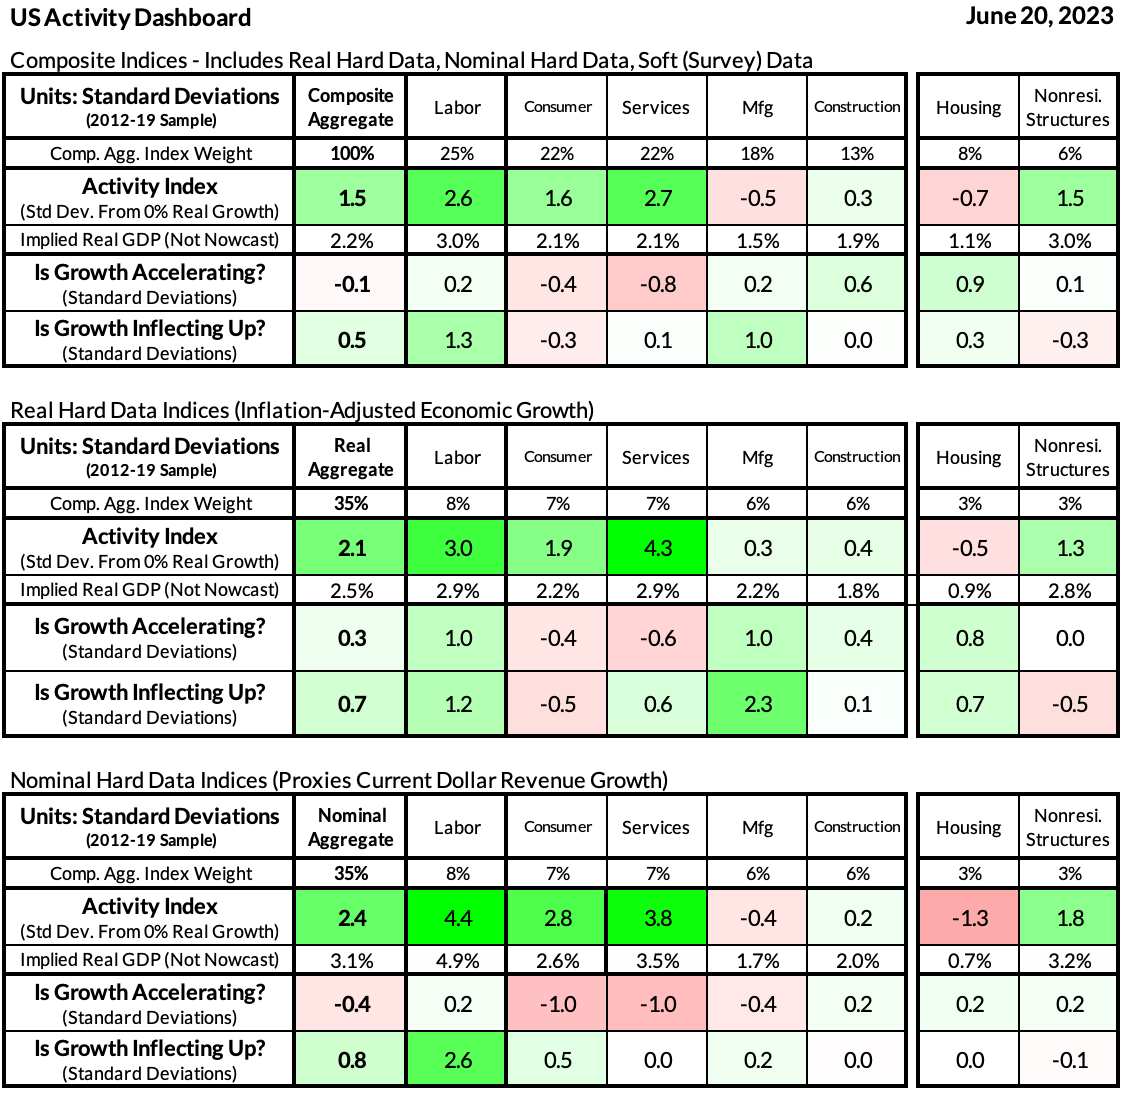
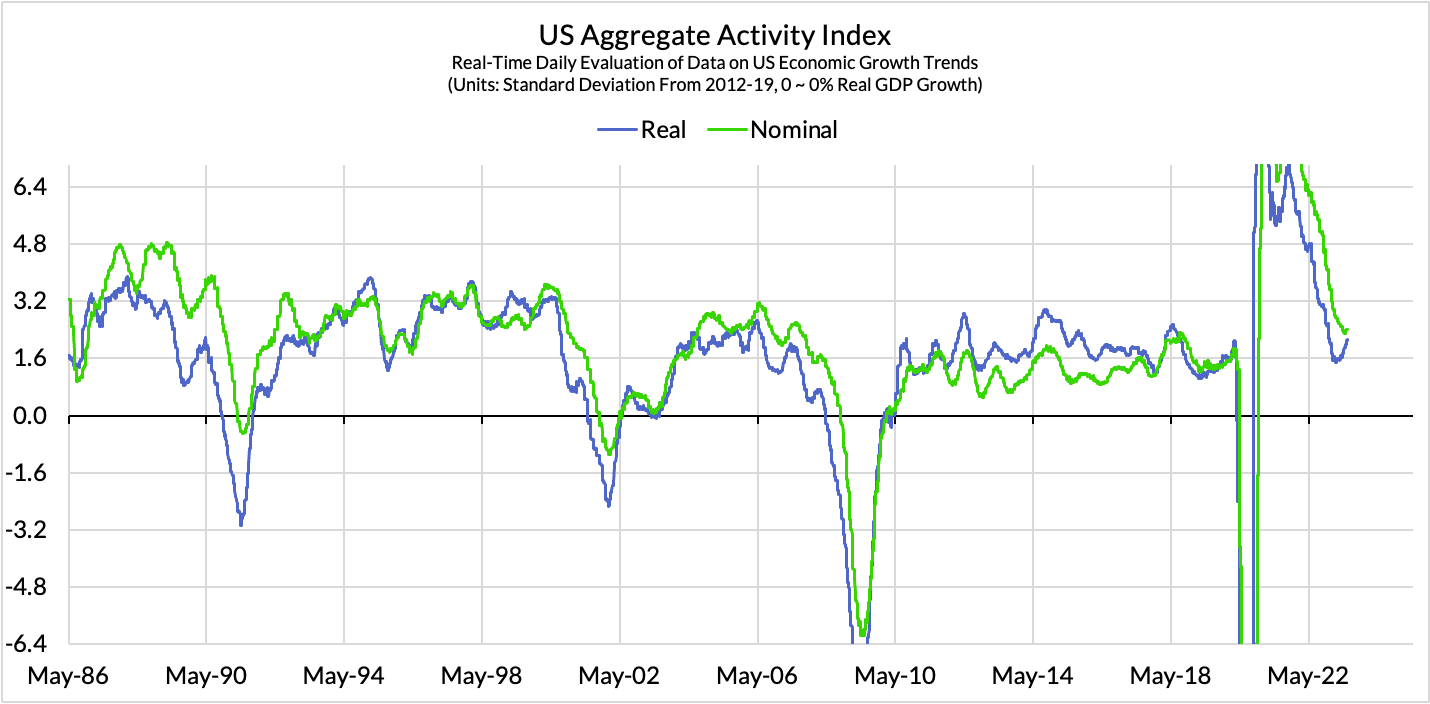
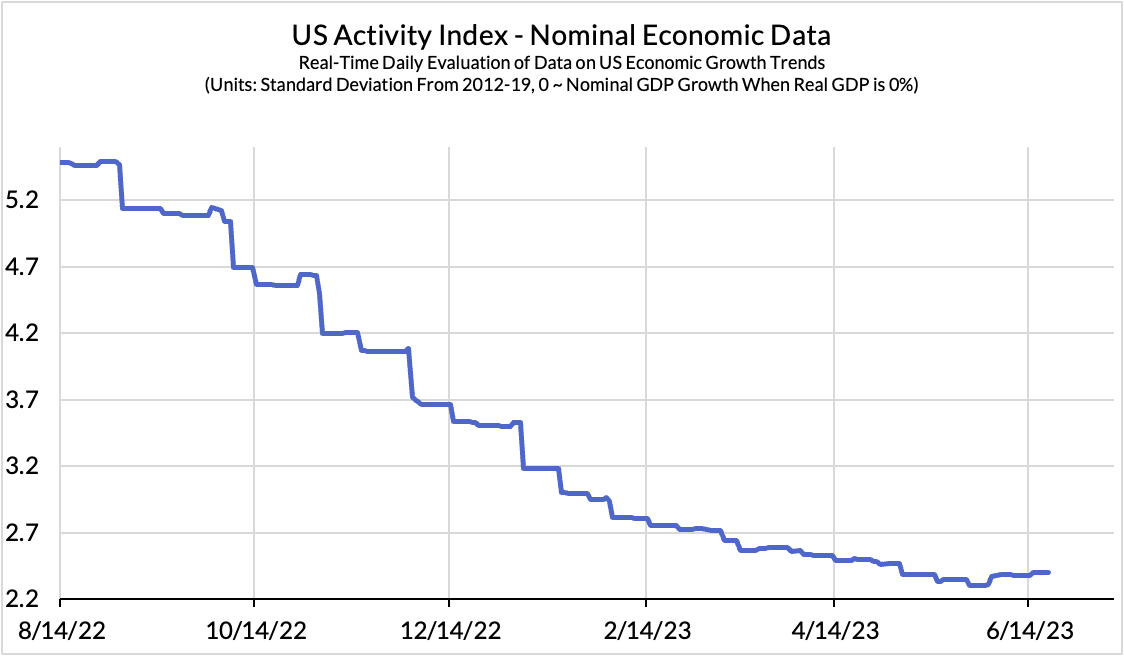
Our U.S. economic activity index, which proxies growth rates, had been declining since December 2021. That was consistent with economic deceleration. Given the breakneck pace of growth in 2021, a sizable slowdown was largely inevitable. See our time series charts and the first colored row of our heatmap tables.
From early February 2023 to early June 2023, our activity dashboards were signaling that the slowdown was stabilizing along a non-recessionary positive-growth trajectory. If the second colored row is negative but the third colored row is meaningfully positive, our heatmap table implies a "stabilizing slowdown"
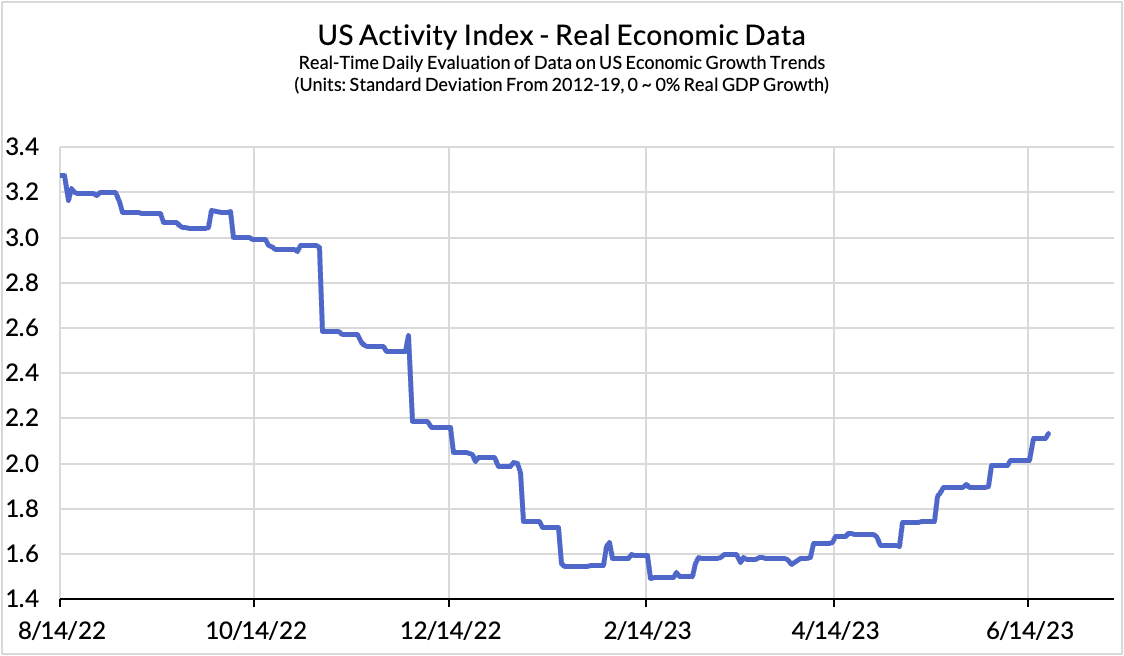
Most recently, we now see evidence that the aggregate slowdown has largely concluded, and the composition of economic dynamics should leave the Fed and other policymakers encouraged, not discouraged. The second colored row of heatmap tables indicates the pace of economic acceleration or deceleration, both by data type and by sector.
The pace of nominal spending is still decelerating, but the pace of real (inflation-adjusted) economic activity is proving more resilient. Such outcomes are consistent with falling inflation and higher productivity growth, all else equal. The second heatmap table is specifically hard inflation-adjusted data, while the third heatmap table is specifically hard nominal data.
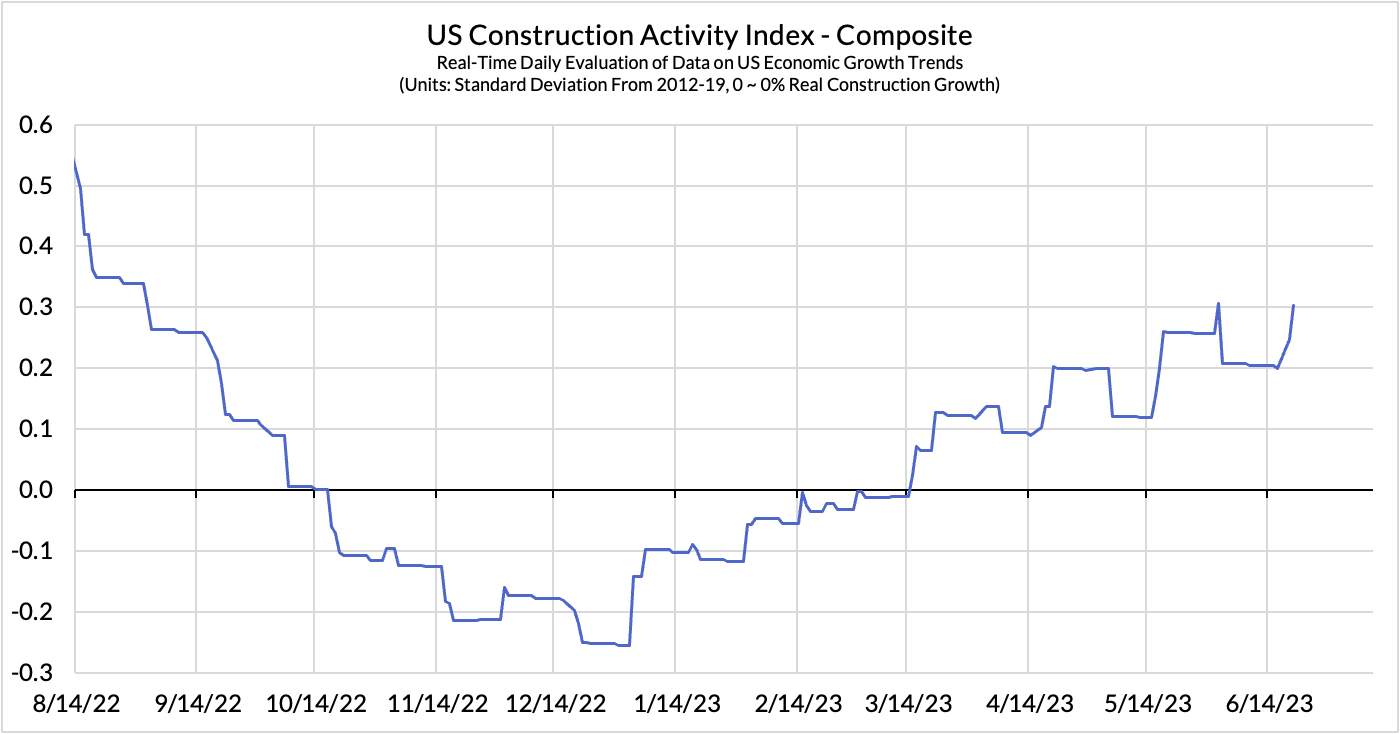
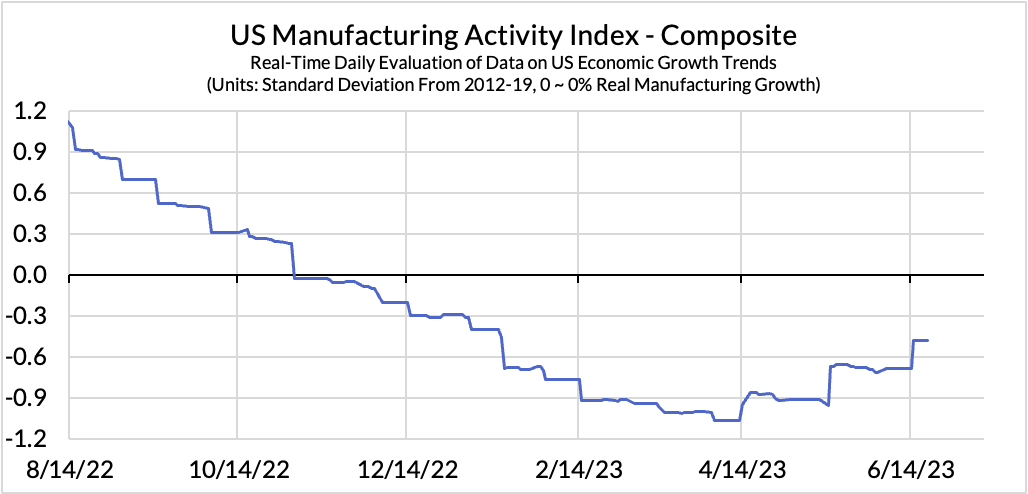
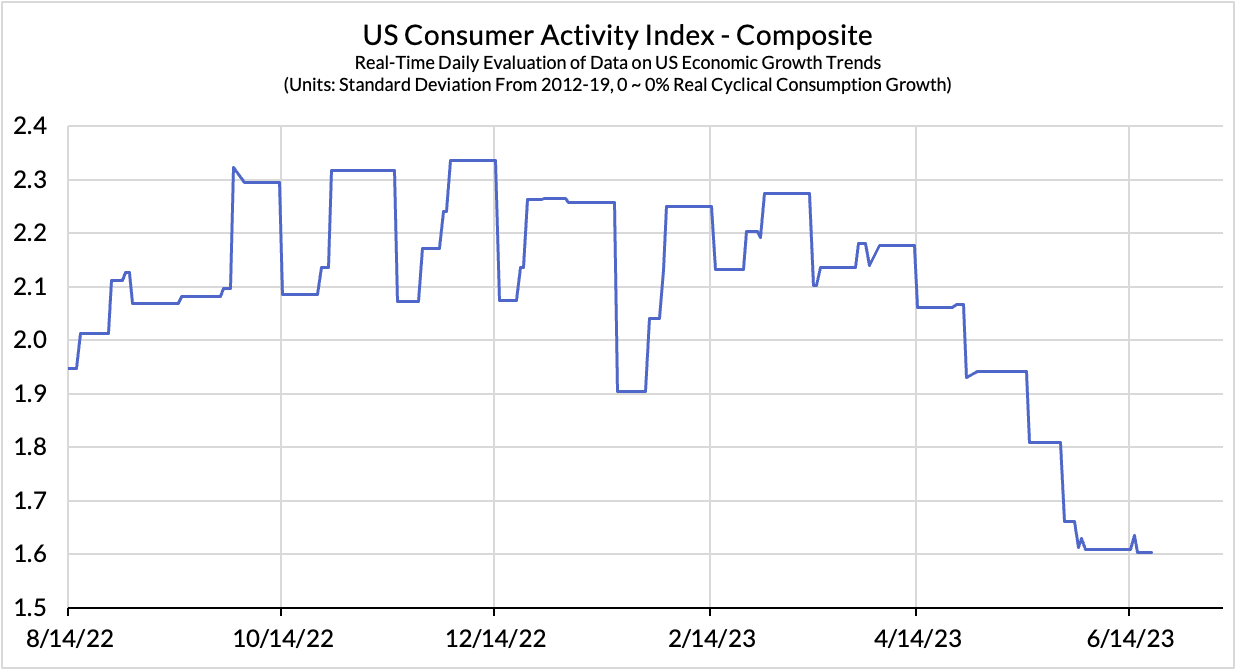
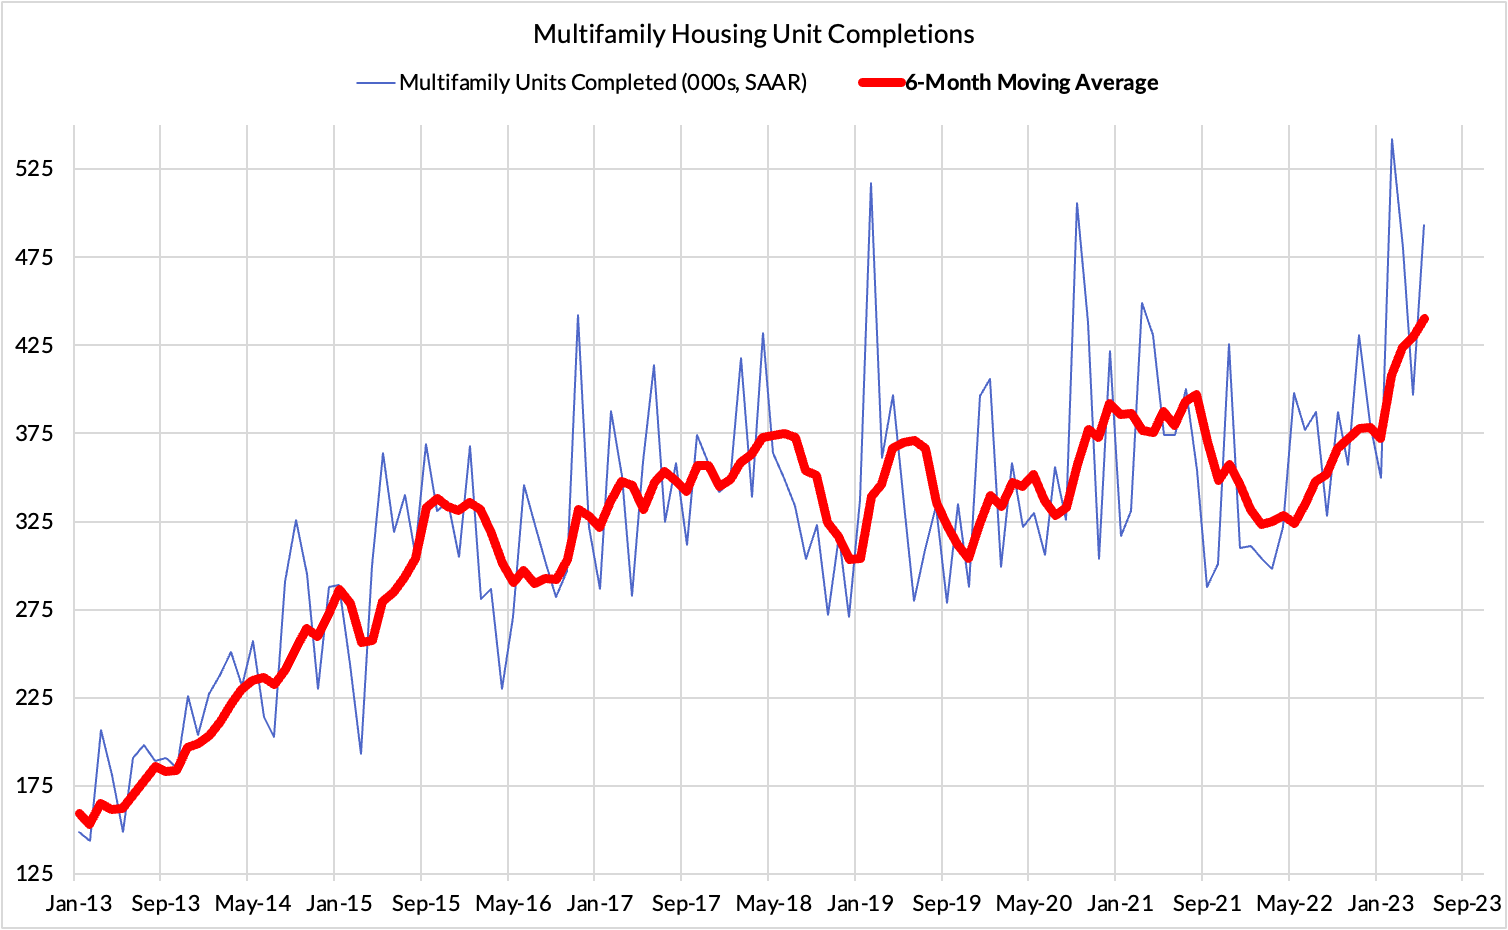
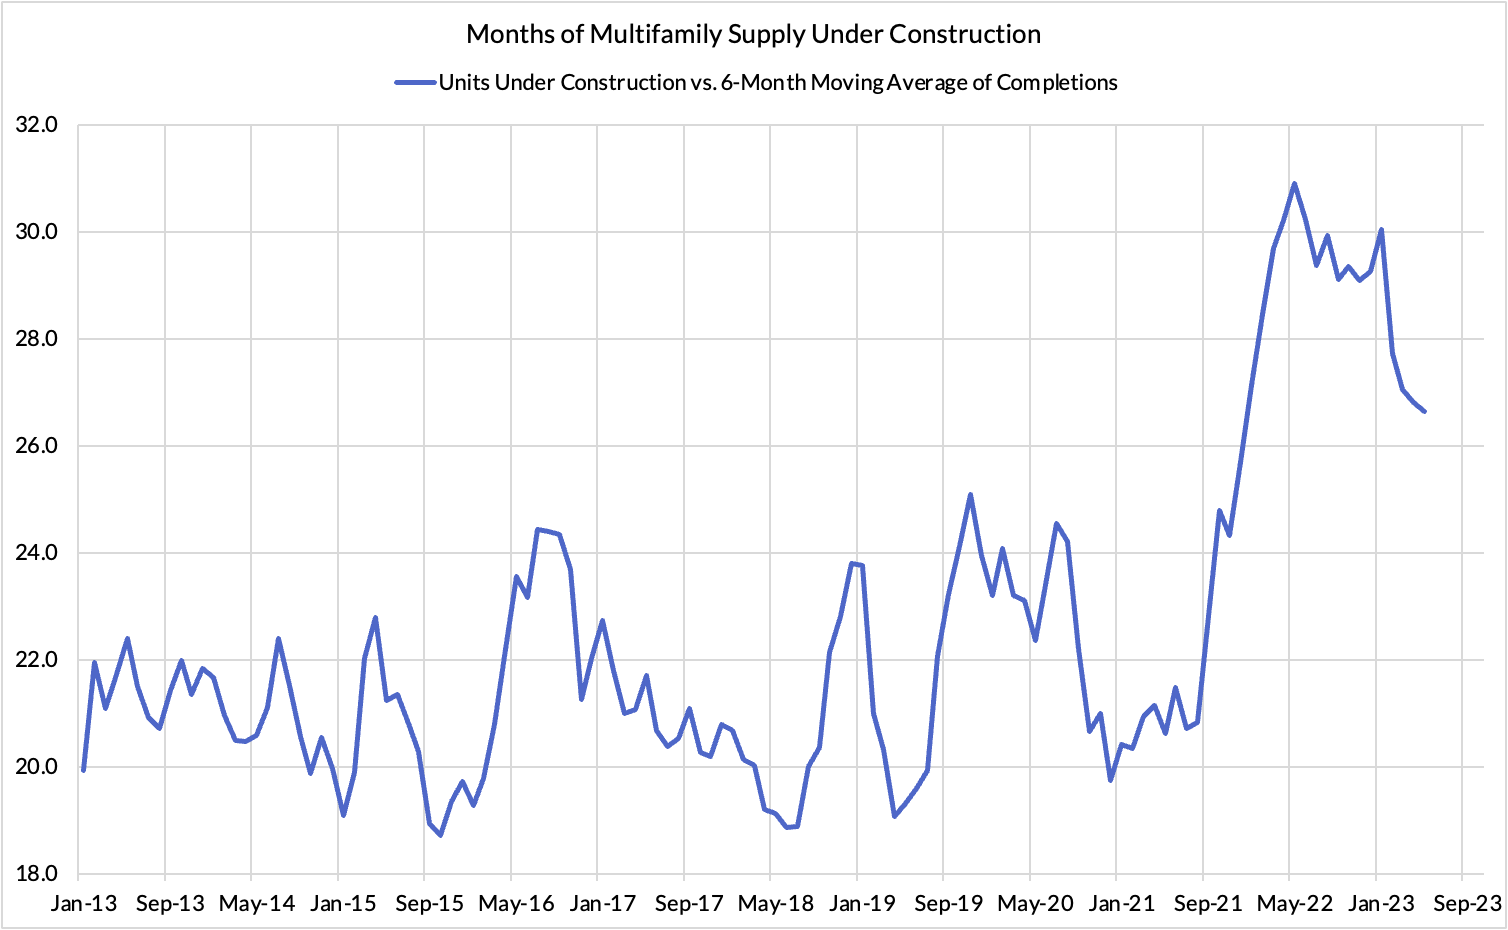
The sectoral composition of economic growth is also encouraging. The consumer and the services sector are still cooling from elevated growth rates, thereby putting less direct pressure on PCE inflation. Meanwhile, growth tied to fixed investment in structures and equipment—namely construction and manufacturing—is improving from deeper contractionary readings in late 2022 and early 2023. We see the resilient state of multifamily housing construction and completions to be especially encouraging for the trajectory of rent inflation in 2024. Meanwhile, for consumer-facing sectors that previously saw prices overshoot and real consumption contract as a result (e.g. food and food services), there is now higher prospect for real consumption to start expanding as the inflationary demand-destruction process ends.
The economic expansion could still take a number of surprising turns and policymakers may still misinterpret the recent pickup in real economic activity as an inherent sign of overheating. The current information set leaves us encouraged that the Fed has a clear non-recessionary pathway to achieve its dual mandate goals over time.
The link has been copied!
Your link has expired. Please request a new one.
Your link has expired. Please request a new one.
Your link has expired. Please request a new one.
Great! You've successfully signed up.
Great! You've successfully signed up.
Welcome back! You've successfully signed in.
Success! You now have access to additional content.