This monitor is a reflection of how we update our assessments of economic growth in real-time as we get meaningful updates from macroeconomic data releases. It provides a more timely and meaningful gauge of economic activity growth than what GDP and similar summary indicators provide. Please see here for more details about how to interpret this information.
Bottom Line:
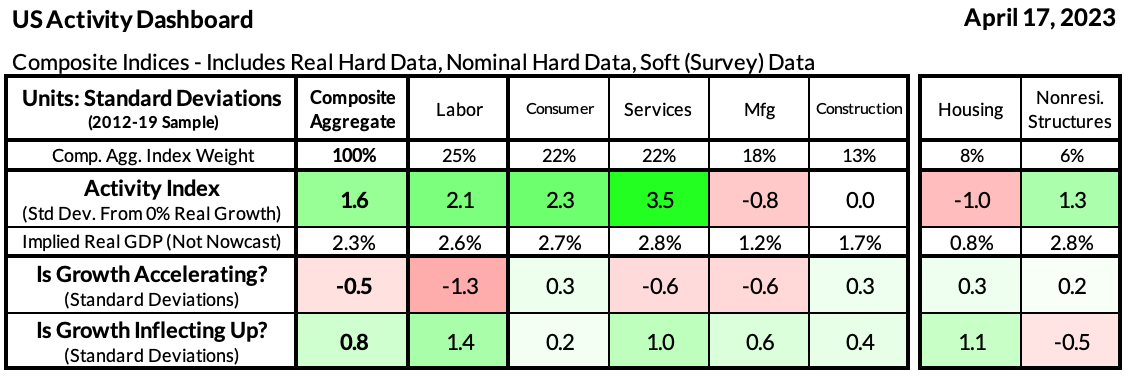
Today's data is generally lower tier but is of outsized relevance in the current context: it's our first set of soft data following the initial "post-SVB" readings. April Empire Manufacturing and NAHB Homebuilder Sentiment data suggest some local acceleration in the two weakest sectors of the US economy: manufacturing and housing. These data releases merely confirm the story our activity dashboard has been signaling: the (1) growing, (2) slowing, but also (3) stabilizing. The acceleration indices on the penultimate row of the heatmap have been falling, while the inflection indices in the last row of our heatmap have continued to rise.
Takeaways:
The full version of this Activity Monitor is made available exclusively for our Premium Donors. To view the full version, sign up here for a 30-day free trial or contact us for more information.