Labor Market Recap August 2023: How Much Slowing is Left?

The August 2023 labor market data points to a labor market that, while strong and not recessionary, is certainly slowing down more starkly than earlier this year.
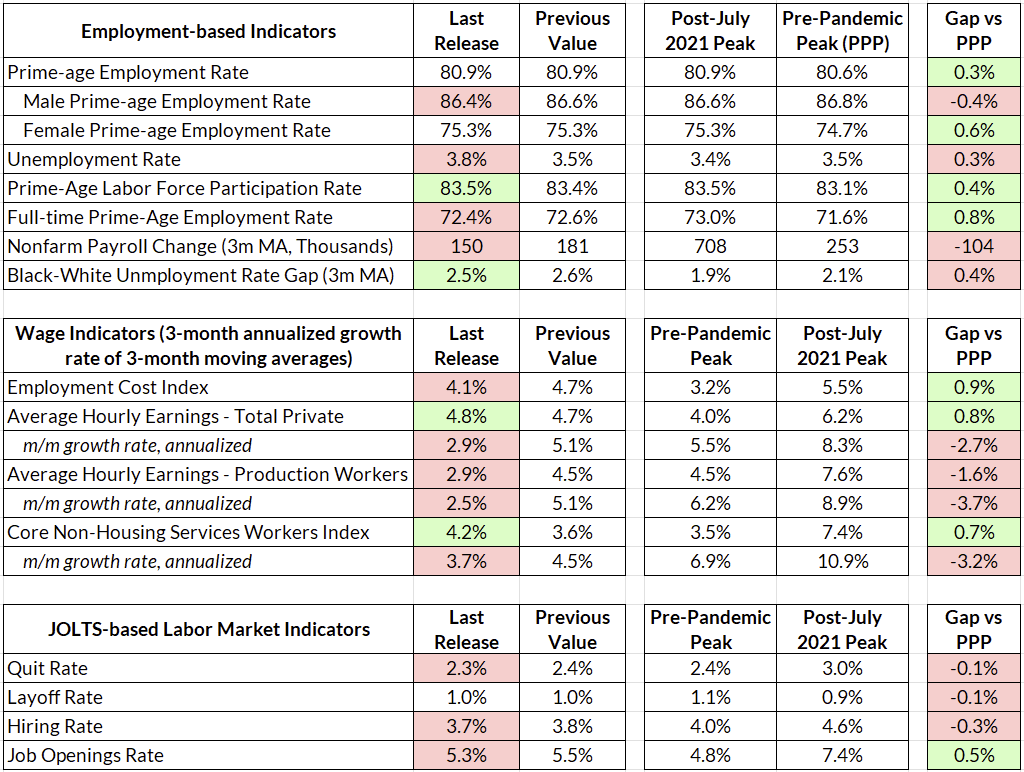
The headline unemployment rate increased to 3.8% from 3.5%, and the establishment survey showed 187,000 jobs added in August (albeit with a -110,000 revision to previous months). That increase in the unemployment rate was partially driven by an increase in labor force participation, primarily from the under-25 cohort. Prime-age employment is flat, again, at 80.9%. Full-time prime-age employment is down slightly, to 72.4% from 72.6%.
While the labor market still looks strong (and not recessionary), the progression of the labor market will be bumpier from here on out. As this labor market matures, we are no longer seeing month after month of consistent improvements in employment rates and high payroll prints. This shouldn’t be cause for worry, and is consistent with the path to a soft landing. Care must be taken to distinguish between signs of labor market slowdown and signs of labor market deterioration. Labor market signals like the composition of unemployed and newly unemployed workers may move up and down from month to month; it is useful to zoom out and take a longer view to put these numbers into perspective.
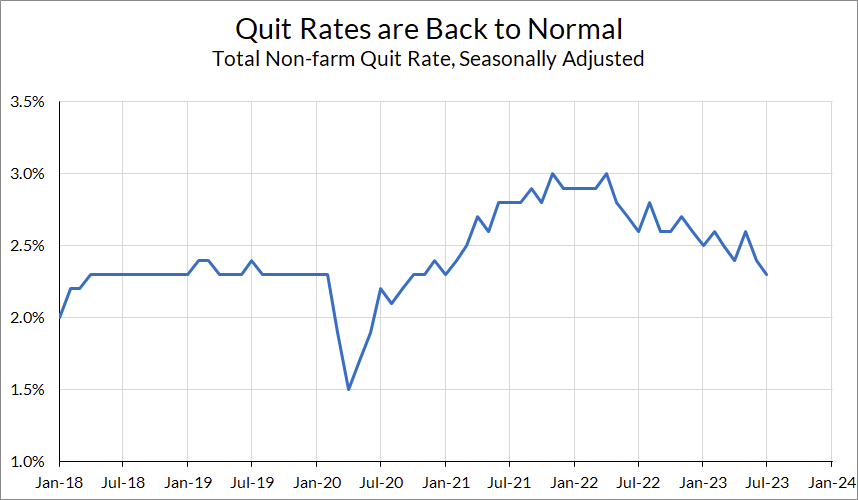
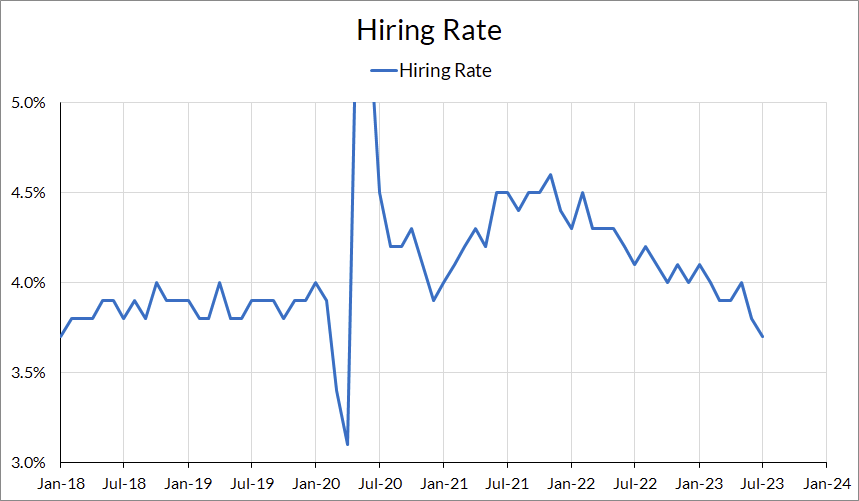
Speaking of longer-timeline comparisons, this month is the first time that the quit rate fell below its pre-pandemic peak. The hiring rate has deteriorated even more. Both of these JOLTS data points are confirmed with the household survey data, with CPS-derived quits and hiring rates also at or below 2019 levels.
Labor Market Dashboard: August 2023
Slowing Down
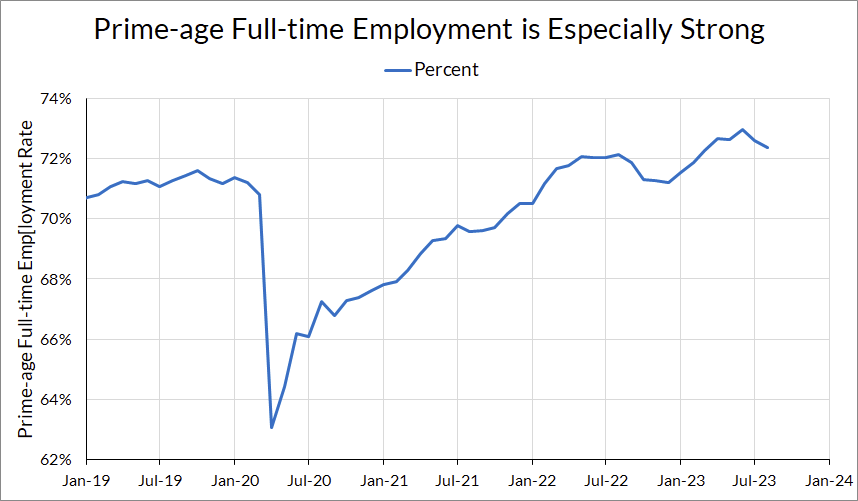
For the second month in a row, the prime-age employment rate has moved sideways instead of upwards. While we are still a touch above pre-pandemic levels, it appears that the pace of labor market improvement is dialing down to a slower pace.

Prime-age full-time employment fell to 72.4% from 72.6%. This is the second month in a row where it’s fallen.
The headline unemployment rate increasing to 3.8% from 3.5% is, at first glance, worrying. Some may point to the increase in the labor force participation rate as one explanation for the increase in the unemployment rate, but that is only a partial explanation. While the labor market entrants (especially new entrants) did rise in August, so too did the number of unemployed job losers. The total number of labor market entrants (both reentrants and new entrants) increased to 2,527,000 from 2,356,000, a 7% increase; meanwhile the number of job losers increased to 2,914,000 from 2,620,000, an 11% increase. The increase in unemployed entrants could reflect weakening labor demand as well increasing labor supply, since stronger labor demand would see some of those unemployed entrants being hired from out of the labor force, or be hired in a short enough time that they don’t get counted as unemployed by the monthly CPS.
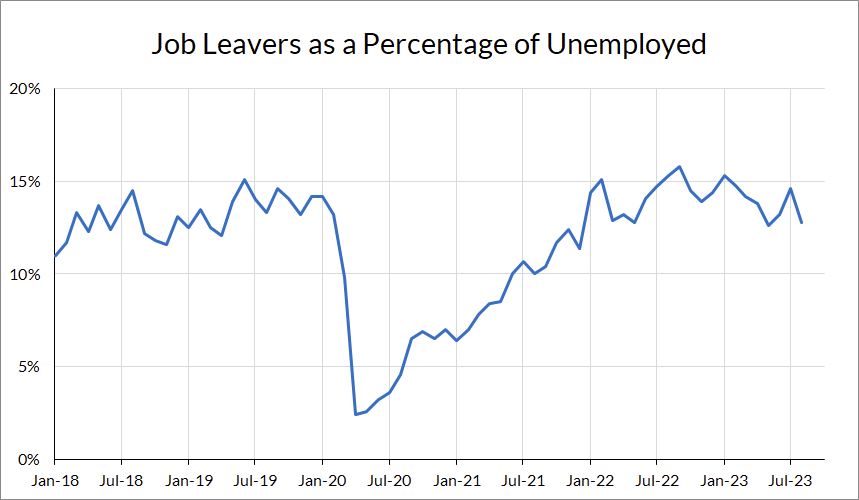
To contextualize this, the percentage of unemployed that report being job leavers (the remaining category) fell in August—but this figure is still well within 2019 levels.
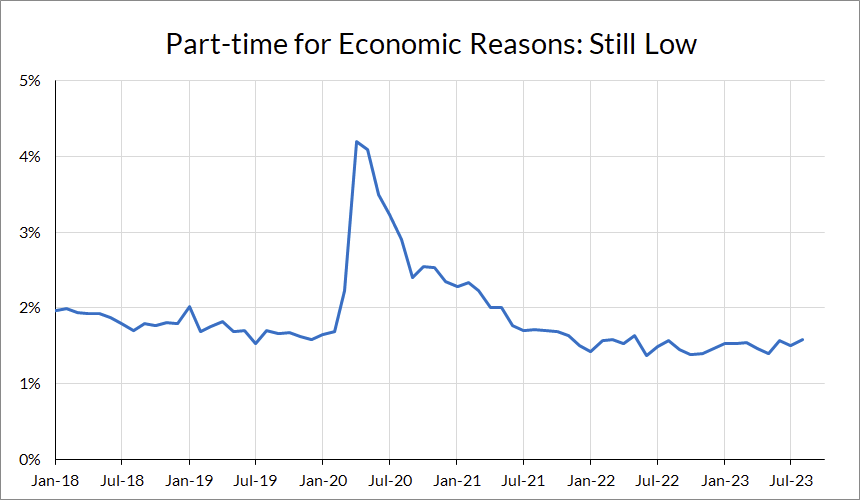
Another indicator of weak labor demand, the percentage of workers that are part-time for economic reasons, has increased slightly over 2023 but also remains at or below 2019 levels.
As the pace of labor market gains slows, it’s not going to be unusual to see changes in the labor market that, when viewed on the timescale of a few months, look like labor market deterioration. It’s important to keep in mind that in general the labor market is as good as, or even better than, the 2019 labor market.
Back to 2019
This month marked the first month where both quit and hiring rates are below their 2019 peaks. The JOLTS quit rate in July 2023 fell to 2.3%, below its 2019 peak of 2.4%; the hiring rate fell to 3.7%, a level not seen since January 2018 (besides during the early months of the pandemic).
These two trends are confirmed by our in-house CPS-derived quit and hiring rate data (available for subscribers at our Labor Market Dashboard), which use the household survey to recreate JOLTS concepts of quits and hires.
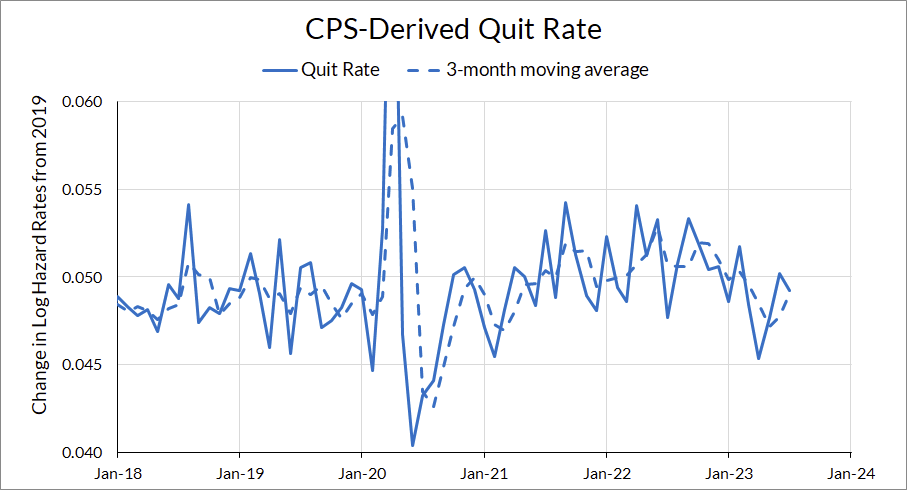
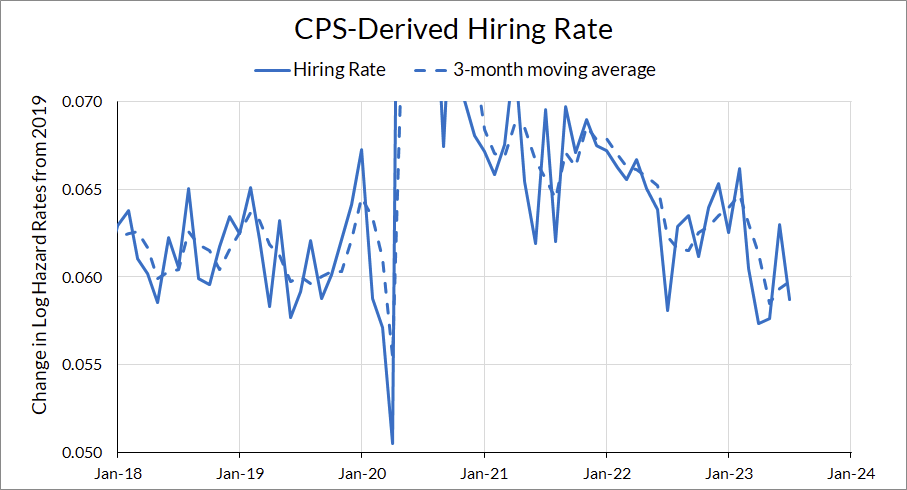
Combined with the increase in unemployment and the slowdown in job growth this data should prompt the Fed to start asking itself how much cooling in the labor market is really left before things turn into labor market deterioration. If quits and hires are anything to go by, the answer is “not much.”
Core Non-housing Services Wages Have Cooled the Most
Average hourly earnings cooled significantly this month, with annualized growth at 2.9% for all private workers and 2.5% for non-supervisory workers. Of course, this is one month of a noisy series that gets revised, so neither we nor the Fed will take too much away from that. However, I do want to take a look at how the Fed’s narratives of wage growth and inflation are playing out.
In June, Powell clarified his views on wages’ role in inflation. While he doesn’t believe wage growth overall is a key driver of inflation, he did cite its role in driving price growth specifically in the core non-housing services sector. While wages in the core NHS sector were growing faster than wages overall, that dynamic has since shifted, with core NHS wages now growing slower than wages in overall PCE and core goods sectors.
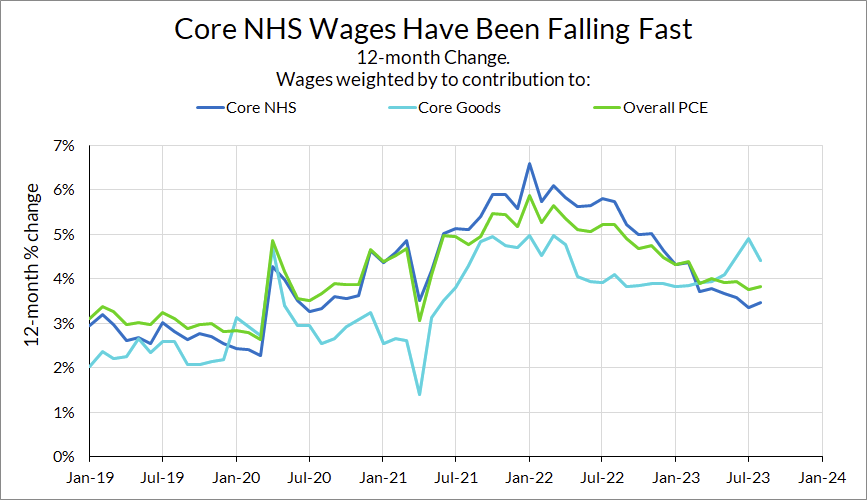
The 12-month growth rate in core NHS wages is now just 3.5%, with more recent 3-month readings around 3%. That might be above what Powell would want to see, but only by a bit. Again, the Fed needs to ask itself how much cooling is left on this front.
Policy Outlook and Risks
Last month I switched my characterization of the labor market to “slowing, but strong” rather than “strong, but slowing.” This continues with the data from August, but with an even greater emphasis on “slowing.”
The key question for the Fed going forward is: how much more slowing can there be before the soft landing is threatened? To take that metaphor literally, a soft landing requires slowing the plane before the runway, but too much slowing induces a stall. While the stick shaker hasn’t been activated yet, the Fed should keep a close eye on the airspeed.