Labor Market Recap, February 2024: Back to "Slowing, but Strong"
After what appeared to be (on the surface and at first glance) a hot January, the labor market data for February 2024 signaled a return to the narrative we followed throughout last year: the labor market is slowing, but remains strong.
After what appeared to be (on the surface and at first glance) a hot January, the labor market data for February 2024 signaled a return to the narrative we followed throughout last year: the labor market is slowing, but remains strong.
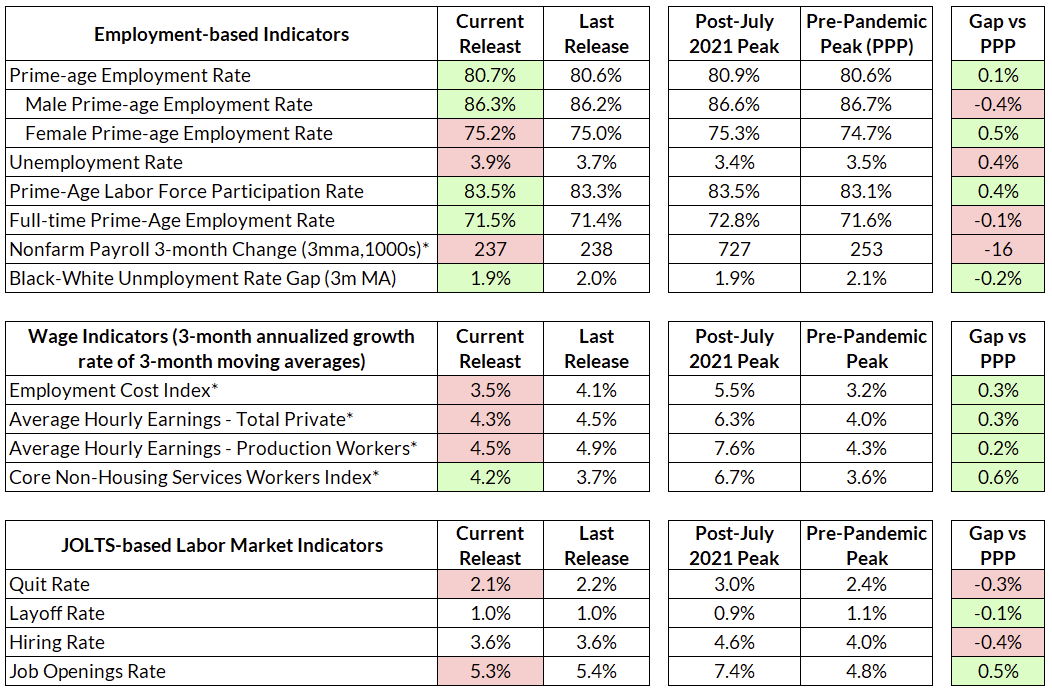
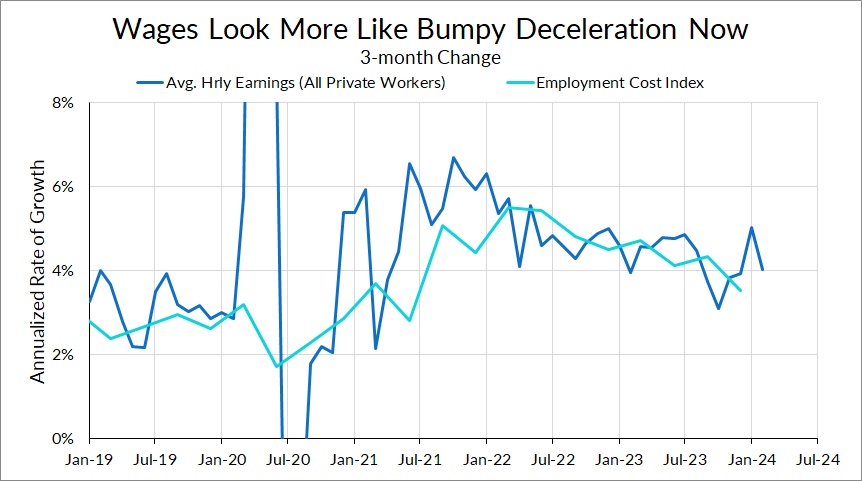
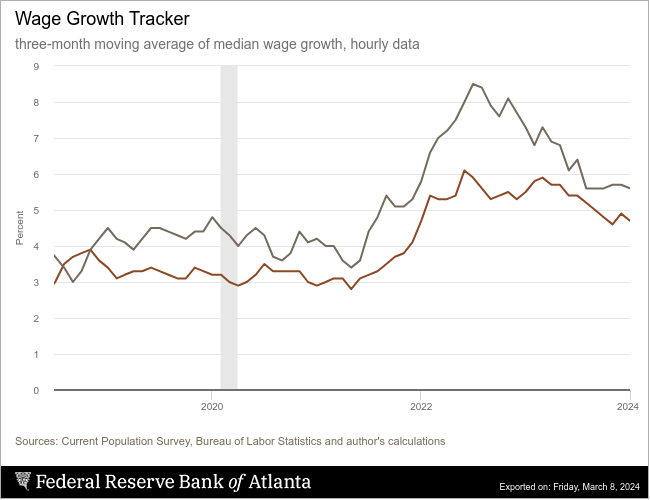
The economy added 275,000 jobs in February, with downward revisions to December and January. Payroll growth was revised down by 43,000, from 333,000 to 290,000 in December and down by 124,000, from 353,000 to 229,000 in January. The headline unemployment rate rose by 0.2% to 3.9%, mostly concentrated in young workers. Prime-age employment actually rose by 0.1% to 80.7%. Last month’s average hourly earnings read also turned out to be a fluke, driven by a weather-driven drop in hours. Average hourly earnings grew at an annualized rate of 1.75%, the slowest since February 2022.
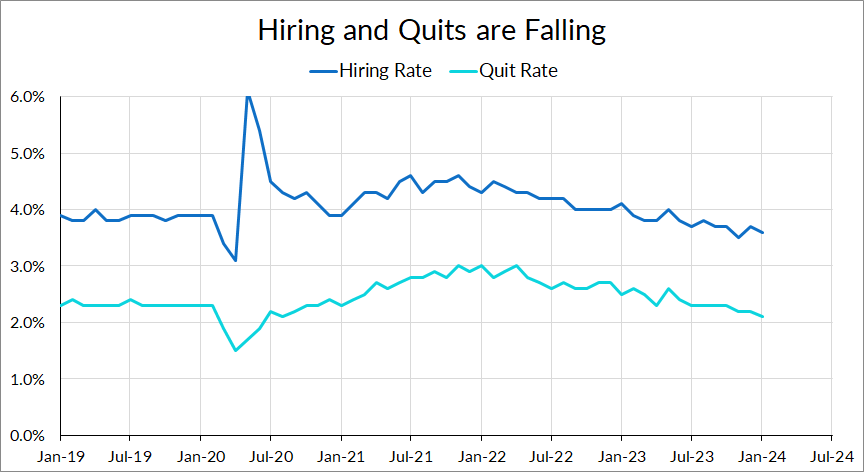
Quit and hiring rates took another step back in the January data. This is another sign of slowing in the labor market. However, something notable is that the unemployment rate is lower than one would historically expect, given the quit and hiring rates. A look at the CPS microdata reveals that the quit-and-hiring phenomenon is about reduced churn and job-hopping; hiring rates for the unemployed are actually quite healthy.
This is overall a good jobs report. It’s just weak enough that it should move Fed cut probabilities up, but not at all weak enough to signal imminent labor market deterioration. There are signs to worry about; the number of short-term unemployed and unemployed job losers rose noticeably this month. File those under “keep an eye on that.”
The key takeaway from the February jobs data is that what looked like an accelerating labor market—and a catalyst for the Fed to remain higher for longer—is back to its late-2023 trajectory of remaining strong, but noticeably slowing down.
Source: Bureau of Labor Statistics, Author’s Calculations. Red indicates weaker labor market development; green indicates stronger. *Previous month figures for these indicators refer to the as-reported numbers from the previous month, not the previous month’s figure in the current vintage. For an explanation of why, see thispost.
Shading down the January labor market data turned out to be the right move. Payrolls for December and January were revised down substantially, and average hourly earnings growth was slow in February. The average hourly earnings story now looks more like “bumpy deceleration” than “reacceleration”:
Source: Bureau of Labor Statistics
This isn’t by any means a bad labor market report. The three-month average of the payrolls change is still a respectable 237,000. Turning to the household survey, things still look solid despite the tick up in unemployment. The unemployment increase this month was concentrated in under-25s. Prime-age employment continues to bounce, but remain high. Labor force participation for prime-age workers continued to rise this month, and now matches its post-COVID high of 83.5%.
Source: Bureau of Labor Statistics
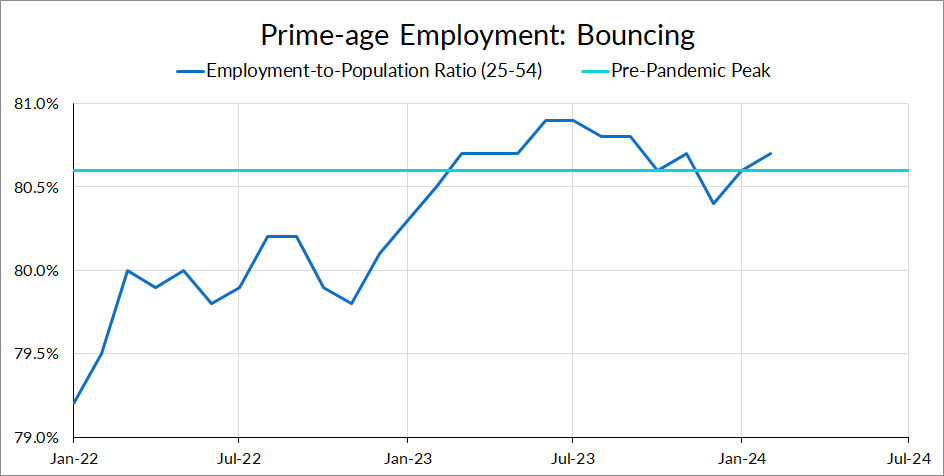
And the proportion of workers that are part-time for economic reasons remains low:
Source: Bureau of Labor Statistics
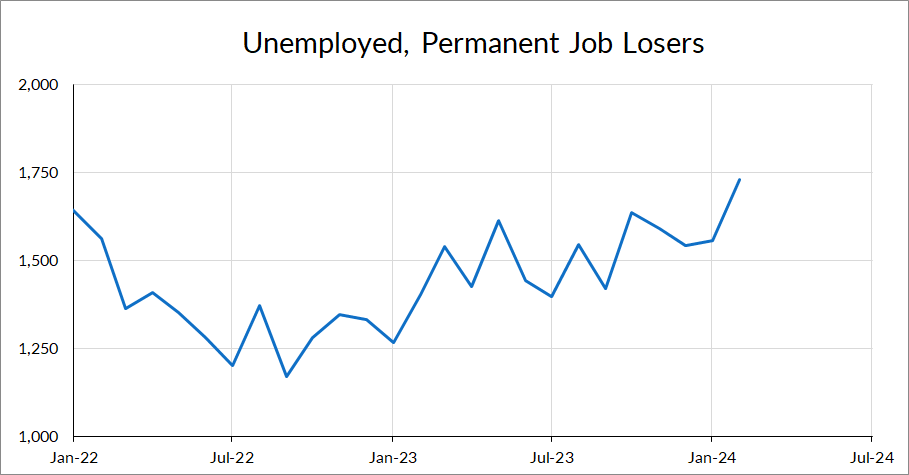
If there is one glaring sign of weakness in the household survey, it is that the number of unemployed job losers has been rising over the past 18 months. It’s about 40% above its post-pandemic low in mid-2022.
Source: Bureau of Labor Statistics
This isn’t, however, a sign that layoffs are unusually high. There’s no evidence of that in the JOLTS or the household survey data. However, what it does signal is a hiring slowdown—previously, when people were laid off, it was easy for them to find a job (and not even show up as unemployed by the next household survey). That seems to have gotten harder as the labor market has slowed down.
The Great Stay
Speaking of JOLTS, both quit rates and hiring rates have been falling over the past few months. The quit rate, which fell to a new post-COVID low of 2.1%, is now at 2017 levels; hiring rates are at 2015 levels.
Source: Bureau of Labor Statistics
Despite the fall in quits and hires, unemployment has remained low. The “Great Resignation” has, over the past few months, evolved into what Guy Berger calls the “Great Stay.” The Great Stay is characterized by firms willing to hold on to their already-hired workers, but aren’t looking to expand their workforce either. As a result, workers are both less likely to job-hop and less likely to lose their jobs.
While that story is likely relevant—we see slowing in the labor market in other measures, such as job growth and wage growth—there may be an additional force keeping people at their jobs. Here’s an alternate story that may also be at play: workers may be better-matched to their jobs now.
Here’s an analogy: suppose there is an urn full of numbered balls. You randomly pull balls from the urn; if the new ball has a higher number than the ball you’re currently holding, you replace it with the higher-numbered ball. At first, you’re likely to replace the ball fairly often. But over time, as the number you are holding gets higher, you become likely to draw a higher number. Your switching rate starts to fall.
During the earlier parts of the earlier parts of the recovery, workers took advantage of the tight labor market to find higher-paying jobs. This resulted in a lot of churn, and can be seen in the elevated quit rates and growth in wages of job-switchers in 2022 and early 2023.
Over time, as workers became better matched to their jobs, their chances of finding even better jobs has fallen. That’s a potential explanation of why the quit rate has fallen that doesn’t run through labor demand. To use the urn-ball example, workers are holding balls with higher numbers now.
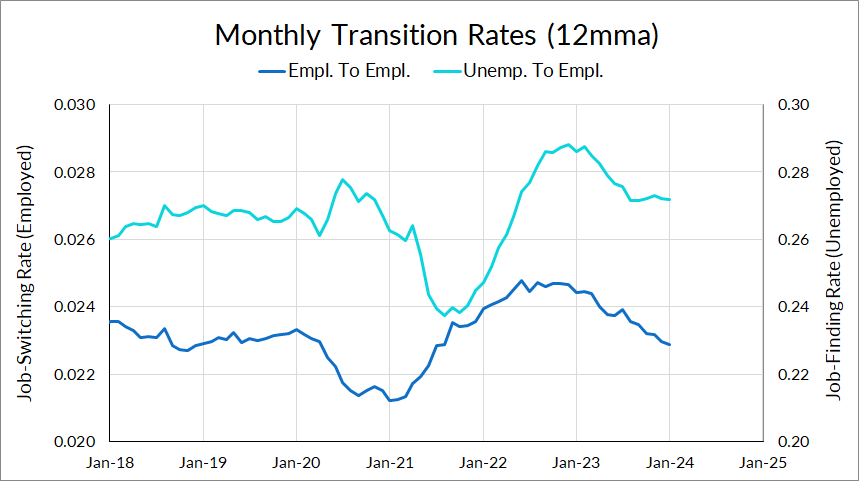
One way to test this theory is to compare job-finding rates of the unemployed versus job-switching rates of the already-employed in the CPS, an idea proposed by Moscarini and Postel-Vinay (2023). While job-switching rates have been declining throughout 2023, the job-finding rate of the unemployed has stabilized in the latter half of 2023, and remains above pre-pandemic levels.
The ratio of job-switching rates to job-finding rates is actually at its lowest level ever in this data series (which runs from the mid-1990s to now). It looks like workers speed-ran the job quality ladder during the labor market recovery and are higher up on that ladder than they’ve ever been.
In short, the falling quit rate is not only reflective of labor demand. It’s worth keeping in mind that the JOLTS data has only existed since the early-2000s. This means that we’ve basically never observed the JOLTS data for any meaningful amount of time during full employment. Interpreting that data in the context of full employment could be tricky.
The Fed Should’ve Maintained Optionality
The January data has been especially tricky to parse. After the hot jobs numbers and inflation came in, nearly all Fed officials, including doves, came out with hawkish Fedspeak, urging more patience with cuts. This took March off the table and pushed our base case for the first cut back to June.
The elevated potential for a reversion in the January jobs report was always a known possibility. The overreaction of the Fed to that month’s data was an unforced error. They seem to have realized it—the Fedspeak from last week saw multiple Fed officials trying to downplay the importance of the January inflation data.
The February jobs data vindicates Austan Goolsbee’s response to the January data. The day of that jobs report, he flagged the fall in hours and declined to take March off the table. He’s also appropriately marked down the importance of the January inflation data given the potential for noise.
This jobs report should calm some fears of reacceleration among the committee. While June is still our base case, there is marginally more probability of a May cut, although this will of course hinge on the incoming inflation data.
The link has been copied!
Your link has expired. Please request a new one.
Your link has expired. Please request a new one.
Your link has expired. Please request a new one.
Great! You've successfully signed up.
Great! You've successfully signed up.
Welcome back! You've successfully signed in.
Success! You now have access to additional content.