Labor Market Recap July 2023: Slowing, but Strong

The July 2023 labor market data continues to confirm the story we’ve been telling for months: while slowing down, the labor market remains strong, with high levels of employment amidst a disinflationary environment.
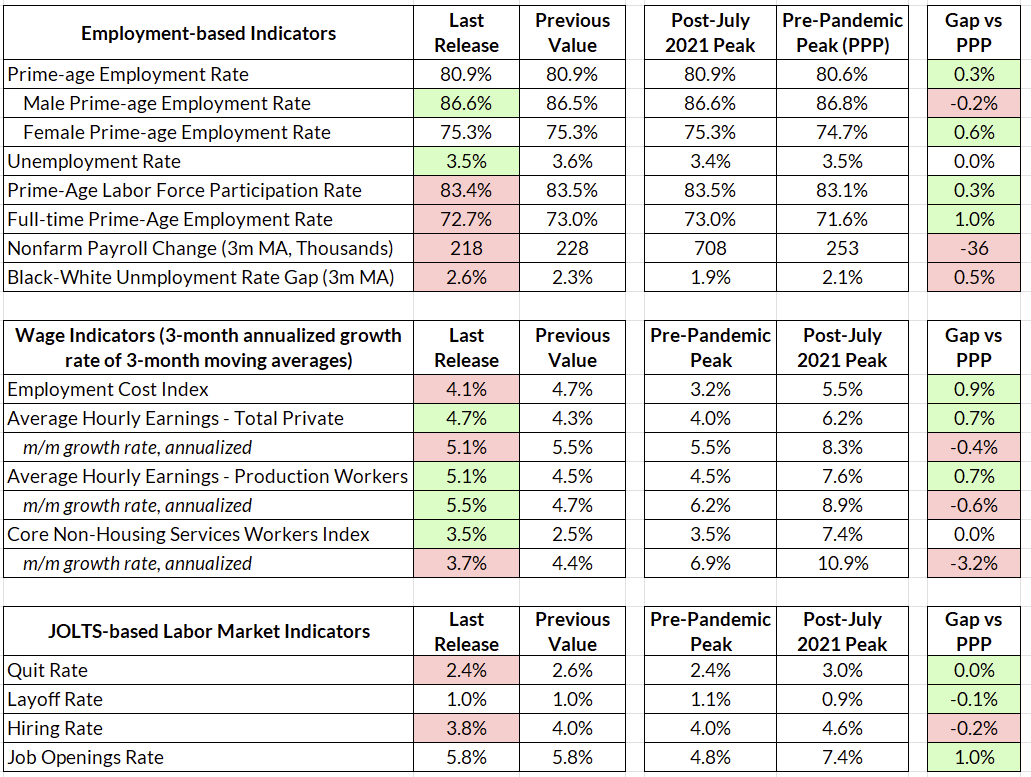
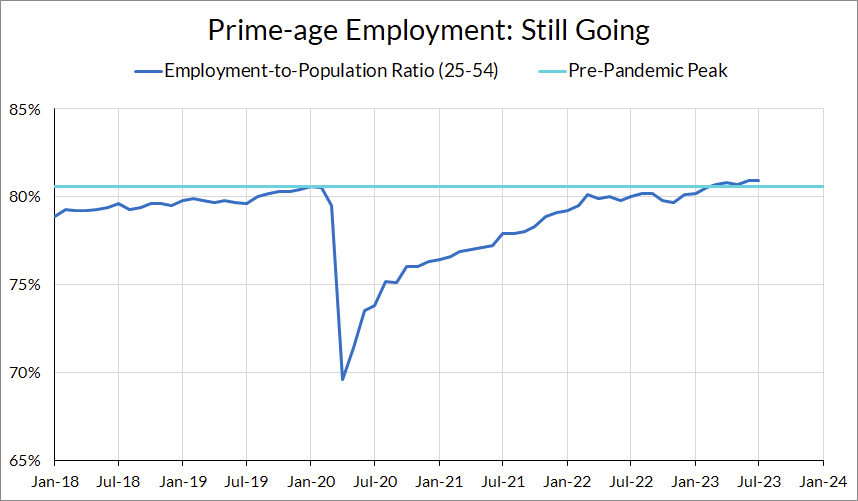
The headline unemployment number fell to 3.5% from 3.6%, consistent with our preview, and the establishment survey showed a solid 187,000 jobs added in June. While below consensus expectations, this is still another solid jobs report, as further details in the household survey confirm. The prime-age employment rate remained at 80.9%, and prime-age labor force participation fell slightly to 83.4% from 83.5%.
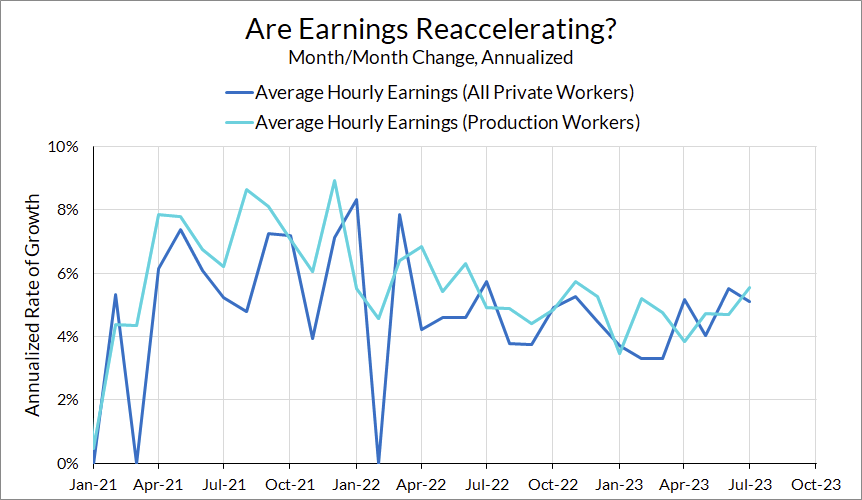
Average hourly earnings growth continued to be warm, with total private average hourly earnings growth coming in at 5.1% annualized and production workers at 5.5% annualized. While these figures are higher than the Fed has wanted, the softer Employment Cost Index print this month suggests a rotation towards higher-paying jobs, with composition changes possibly driving the average hourly earnings figure. This, combined with the recent GDP and productivity numbers as well as a still-depressed labor share, point away from these earnings representing an inflationary impulse.
As we wrote earlier this week, we didn’t see anything particularly special coming from this report, and that’s what we got. With little change to the overall employment situation, a significant slowdown in 2023 Q2 ECI, and disinflationary trends in prices, a September hike seems unlikely barring hot inflation prints from here.
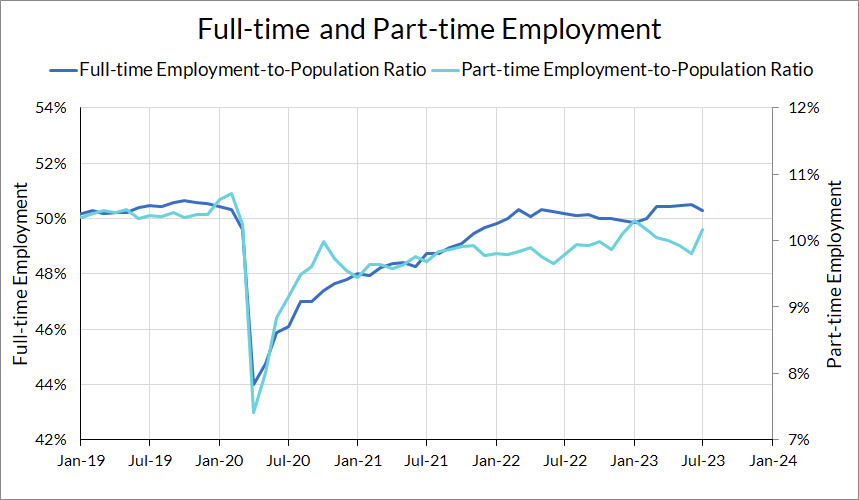
There’s not too much that’s interesting in the rest of the household survey. Movements in indicators like the composition of unemployed, reasons for part-time unemployment, and labor force participation are only marginally changed from the previous month. The only large change is from the number of part-time employed, which took a jump up this month, but this is a noisy series and the composition of full-vs-part-time employment is still relatively healthy.
How much does labor utilization have left to slow? If one looks at hours: not much. Aggregate weekly hours are the product of average weekly hours and the number of employees, which means that, to a first approximation, the growth rate of aggregate hours is the sum of the growth rate of average weekly hours and employees. Average weekly hours have been slowly falling since 2022, and so the growth rate in aggregate hours has fallen more than the growth rate in payroll employment has fallen.
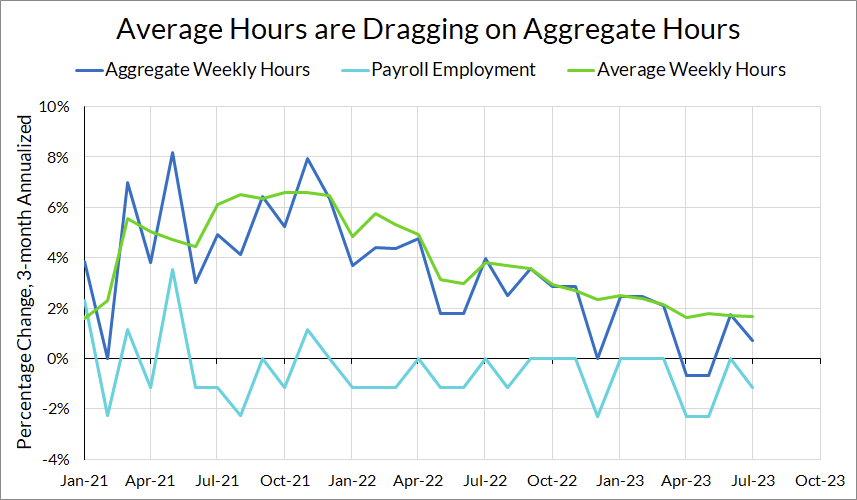
While payroll employment is still growing (albeit at a slower rate), aggregate weekly hours growth is trending towards zero. Average weekly hours are at 34.3 hours—below the 2019 average.
We can also see this in the JOLTS data. The quits and hiring rates both fell in June, with the quit rate falling to 2.4 and the hiring rate fell to its lowest level during the post-pandemic level at 3.8. Both of those are solidly within 2019 levels. All of this means that there’s not much more slowing to be had without dipping back down below where the pre-pandemic labor market was.

If there is one part of the recent data that hasn’t been consistent with the “strong but slowing” narrative, it’s that growth in average hourly earnings appears to have stopped falling. While we don’t think you should put too much weight on average hourly earnings, it may be tempting for some to interpret this as an inflationary impulse to the economy and a reason for the Fed to pursue marginally tighter policies.
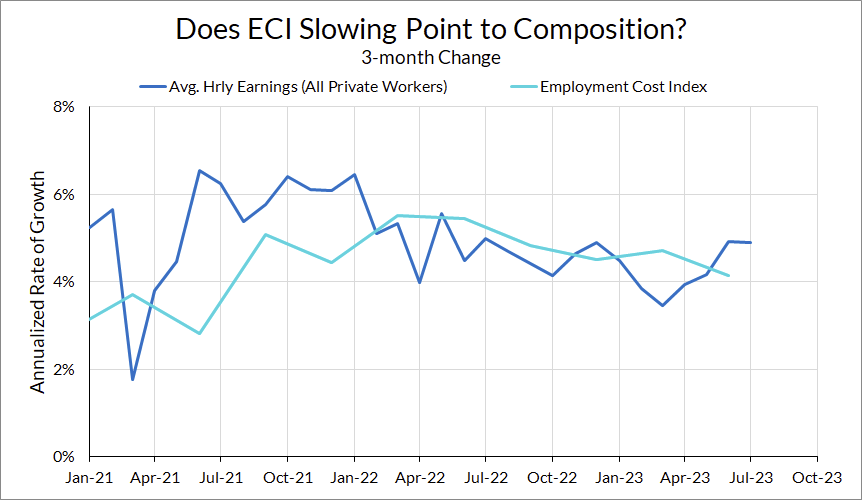
There are three reasons why this interpretation would be misguided. The first is that we have in-hand a higher-quality measure of wages for Q2 2023: the Employment Cost Index. Growth in the Employment Cost Index came in at a relatively soft 4.1% annualized growth rate for Q2 2023 (the survey covers a period during the last month of the quarter, so one can think of this as the 3-month change from March to June). That is softer than the 4.9% growth reported in average hourly earnings over the same period.
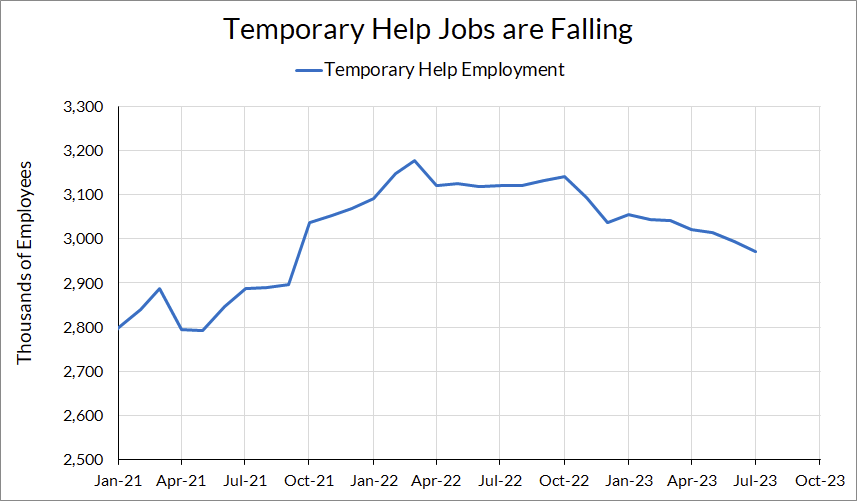
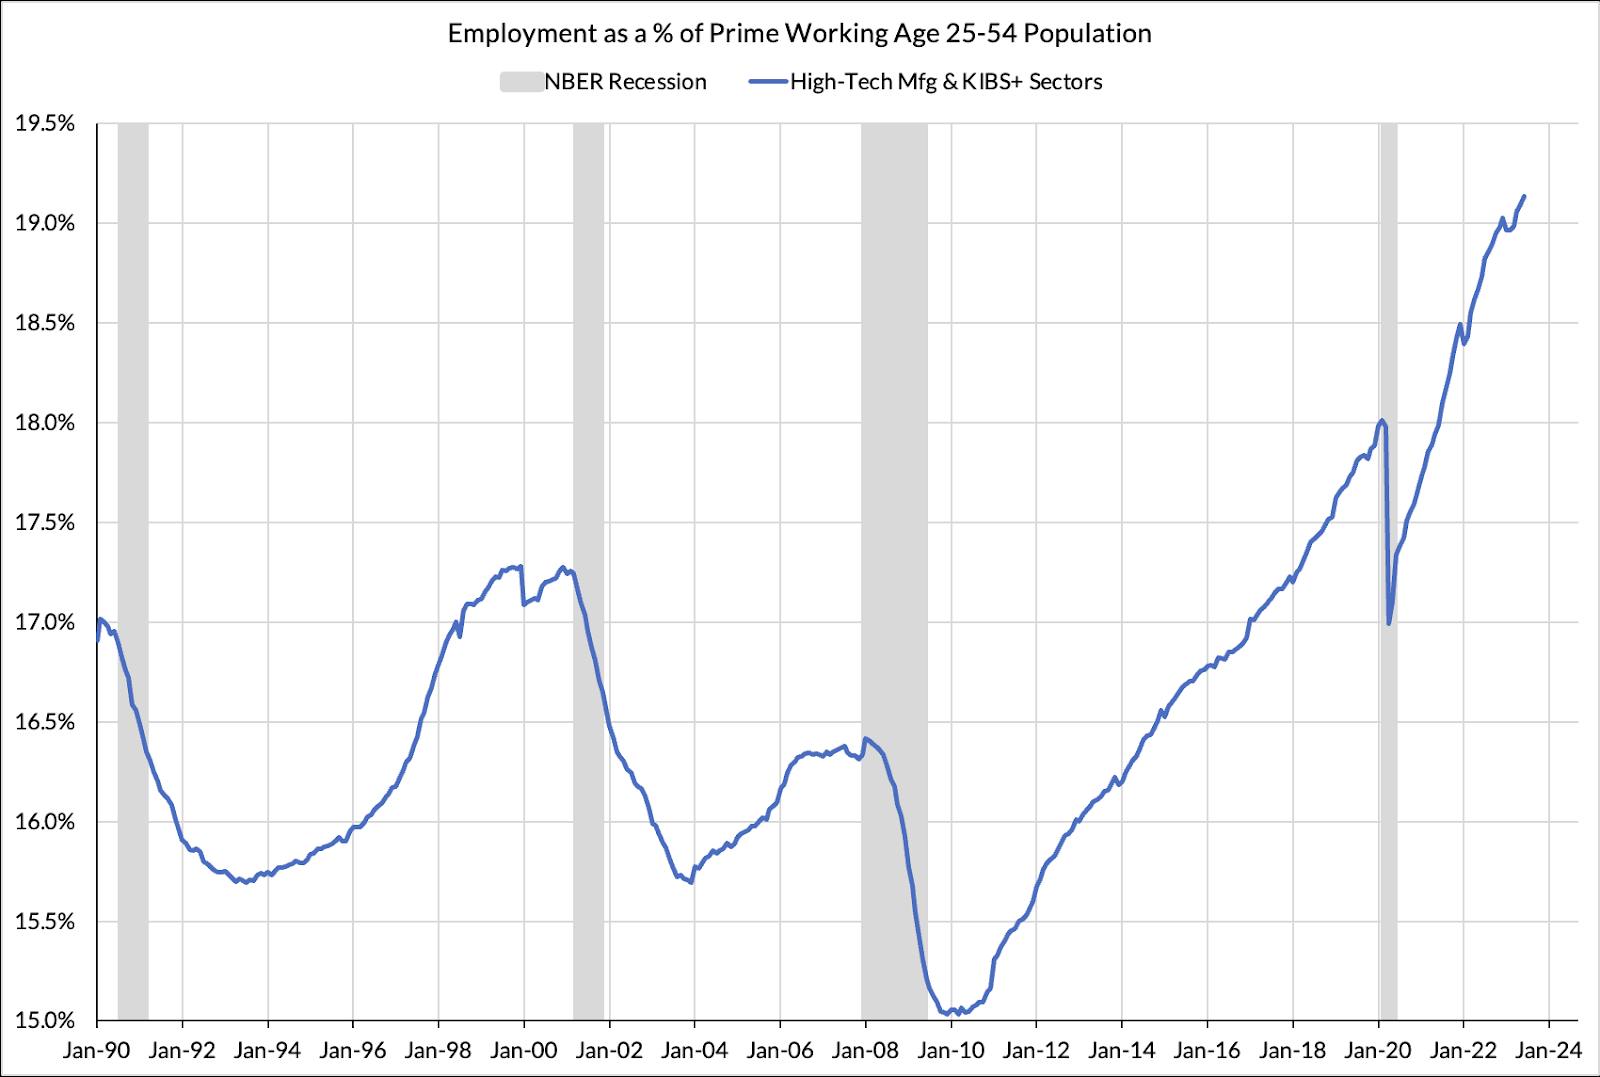
One potential explanation is that workers are moving to types of jobs that are higher-paying, which would push average hourly earnings up more than the employment cost index. One can see hints of this in the declining number of temporary help workers and the share of employment in high-tech manufacturing and Knowledge-Intensive Business Services:
The second reason is that Powell has in the past thought about wage growth as sustainable if it’s equal to inflation plus productivity growth, implying that a wage growth rate of around 3.5% is consistent with 2% inflation. Productivity in Q2 2023 came in at a blistering 3.7% growth rate, and we think there are reasons to be bullish about productivity and GDP growth in the next few quarters. To the extent that the Fed sticks with this framework of thinking about wage growth, they should be more tolerant of wage growth.
Finally, as I wrote last month, the corporate labor share, when measured properly, is still depressed. Recovering the labor share will require wage growth exceeding productivity and inflation growth. It’s not clear to me why one would write off this possibility; in fact, if one looks at the historical evidence, the labor share tends to recover during the latter part of expansions. If that pattern holds for this recovery, we should expect—and allow for—more wage growth than the Fed thinks is appropriate.
Over the past couple months, commentators (including myself) have flagged the rise in black unemployment as one worrying sign in the labor market. Over the past three months, the black unemployment rate has increased by 1.1 percentage points and the teen unemployment rate has increased by 2.1 percentage points.
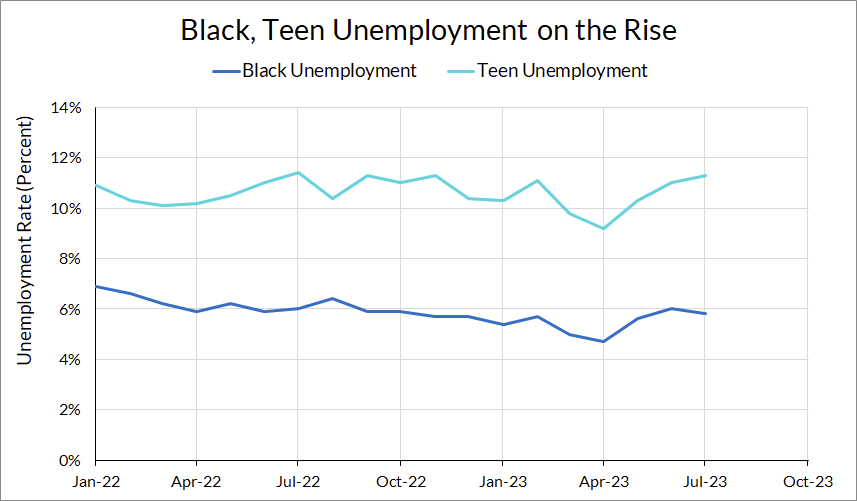
Unfortunately, it’s unclear what’s signal and what’s noise here. As Matt Darling points out, subgroup analysis is complicated by the fact that sample sizes get very limited when you look at finer and finer subgroups—the raw number of respondents in the Current Population Survey who were black and unemployed in April 2023 was 220.
For what it’s worth, the Bureau of Labor Statistics does publish a table of the statistically significant changes in selected labor force indicators, and the 3-month change in black and youth unemployment is statistically significant at the 90% level. But, these figures are also not statistically significantly different from 6 or 12-months ago.
Given the strength of the aggregate employment situation and the statistical noise present in these numbers, I would caution against the notion that this is a harbinger of labor market collapse or recession. It could be the case that April was an anomalously low unemployment reading for these groups, and the local upwards trend is spurious. But, it’s worth keeping an eye on.
As we said in our preview, we expect slower job growth over the next 2-3 quarters. The labor market over the next few quarters seems like it will be more “slowing, but strong” rather than “strong, but slowing.”
For their part, the Fed seems like they are warming to the idea of accepting a stronger labor market as long as disinflation continues to make progress. What remains to be seen is how they will accept new inflation data, especially if it comes in on the soft side, and if they will accommodate, rather than fight, strong output growth.