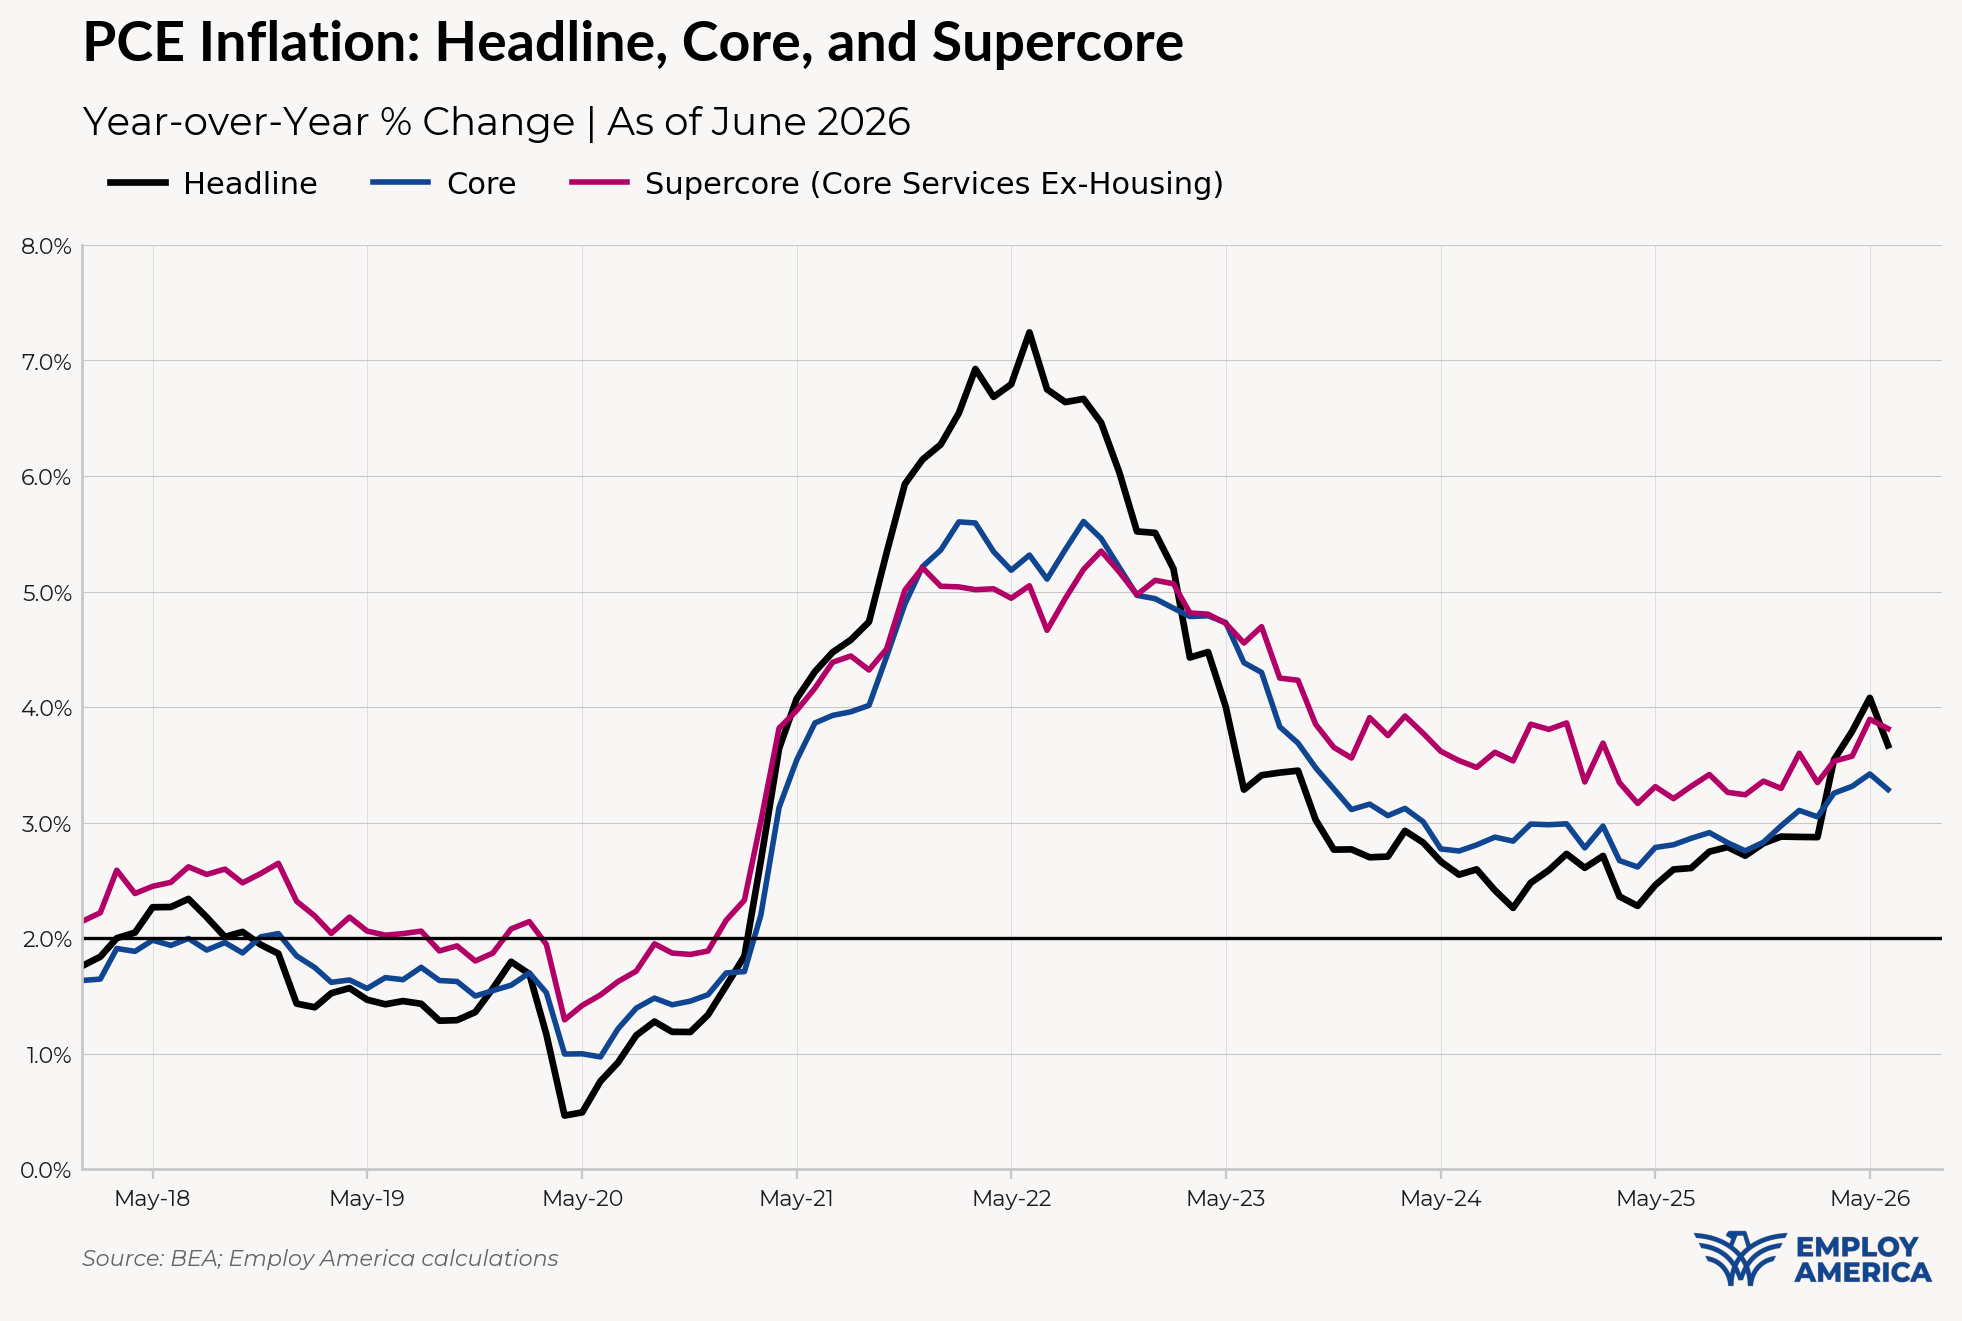
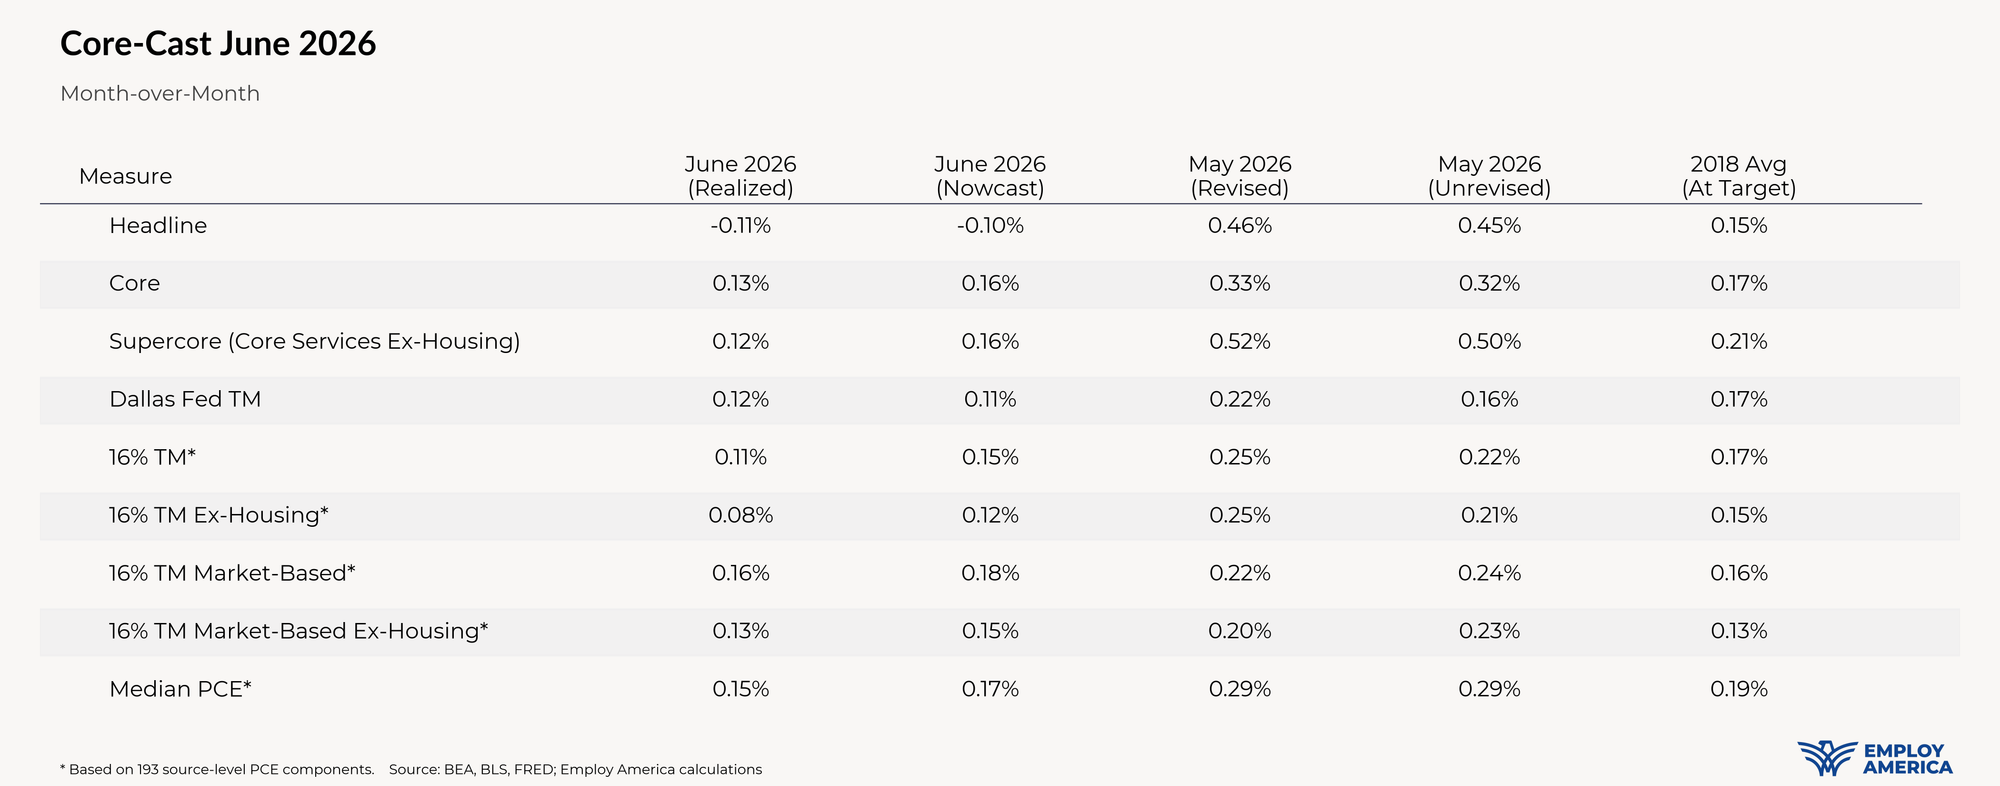
Month-over-month Core PCE came in at 13bps in June, three basis points below our nowcast of 16bps. Headline came in at -11bps vs our -10bp nowcast.
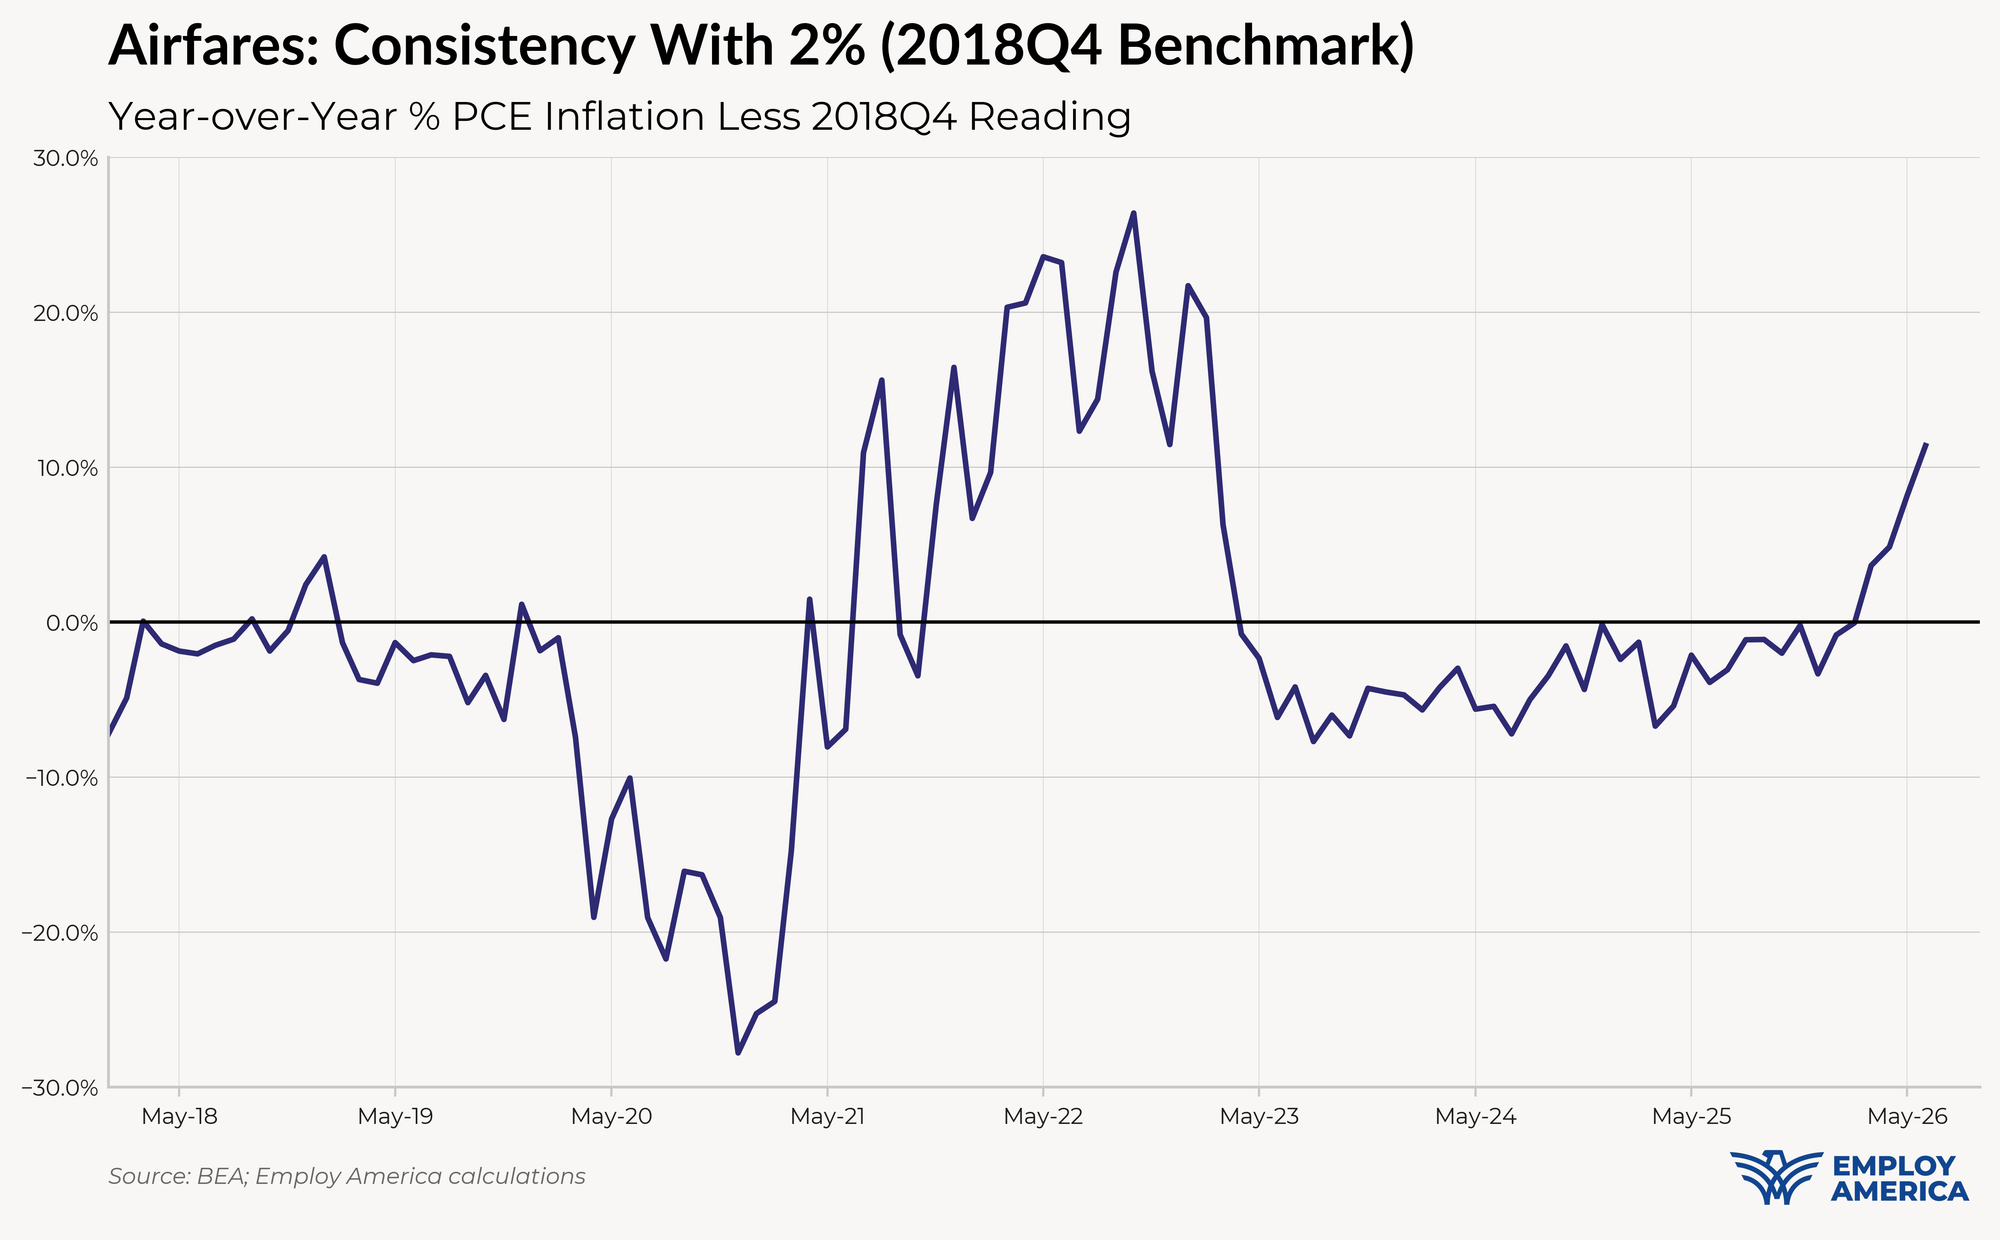
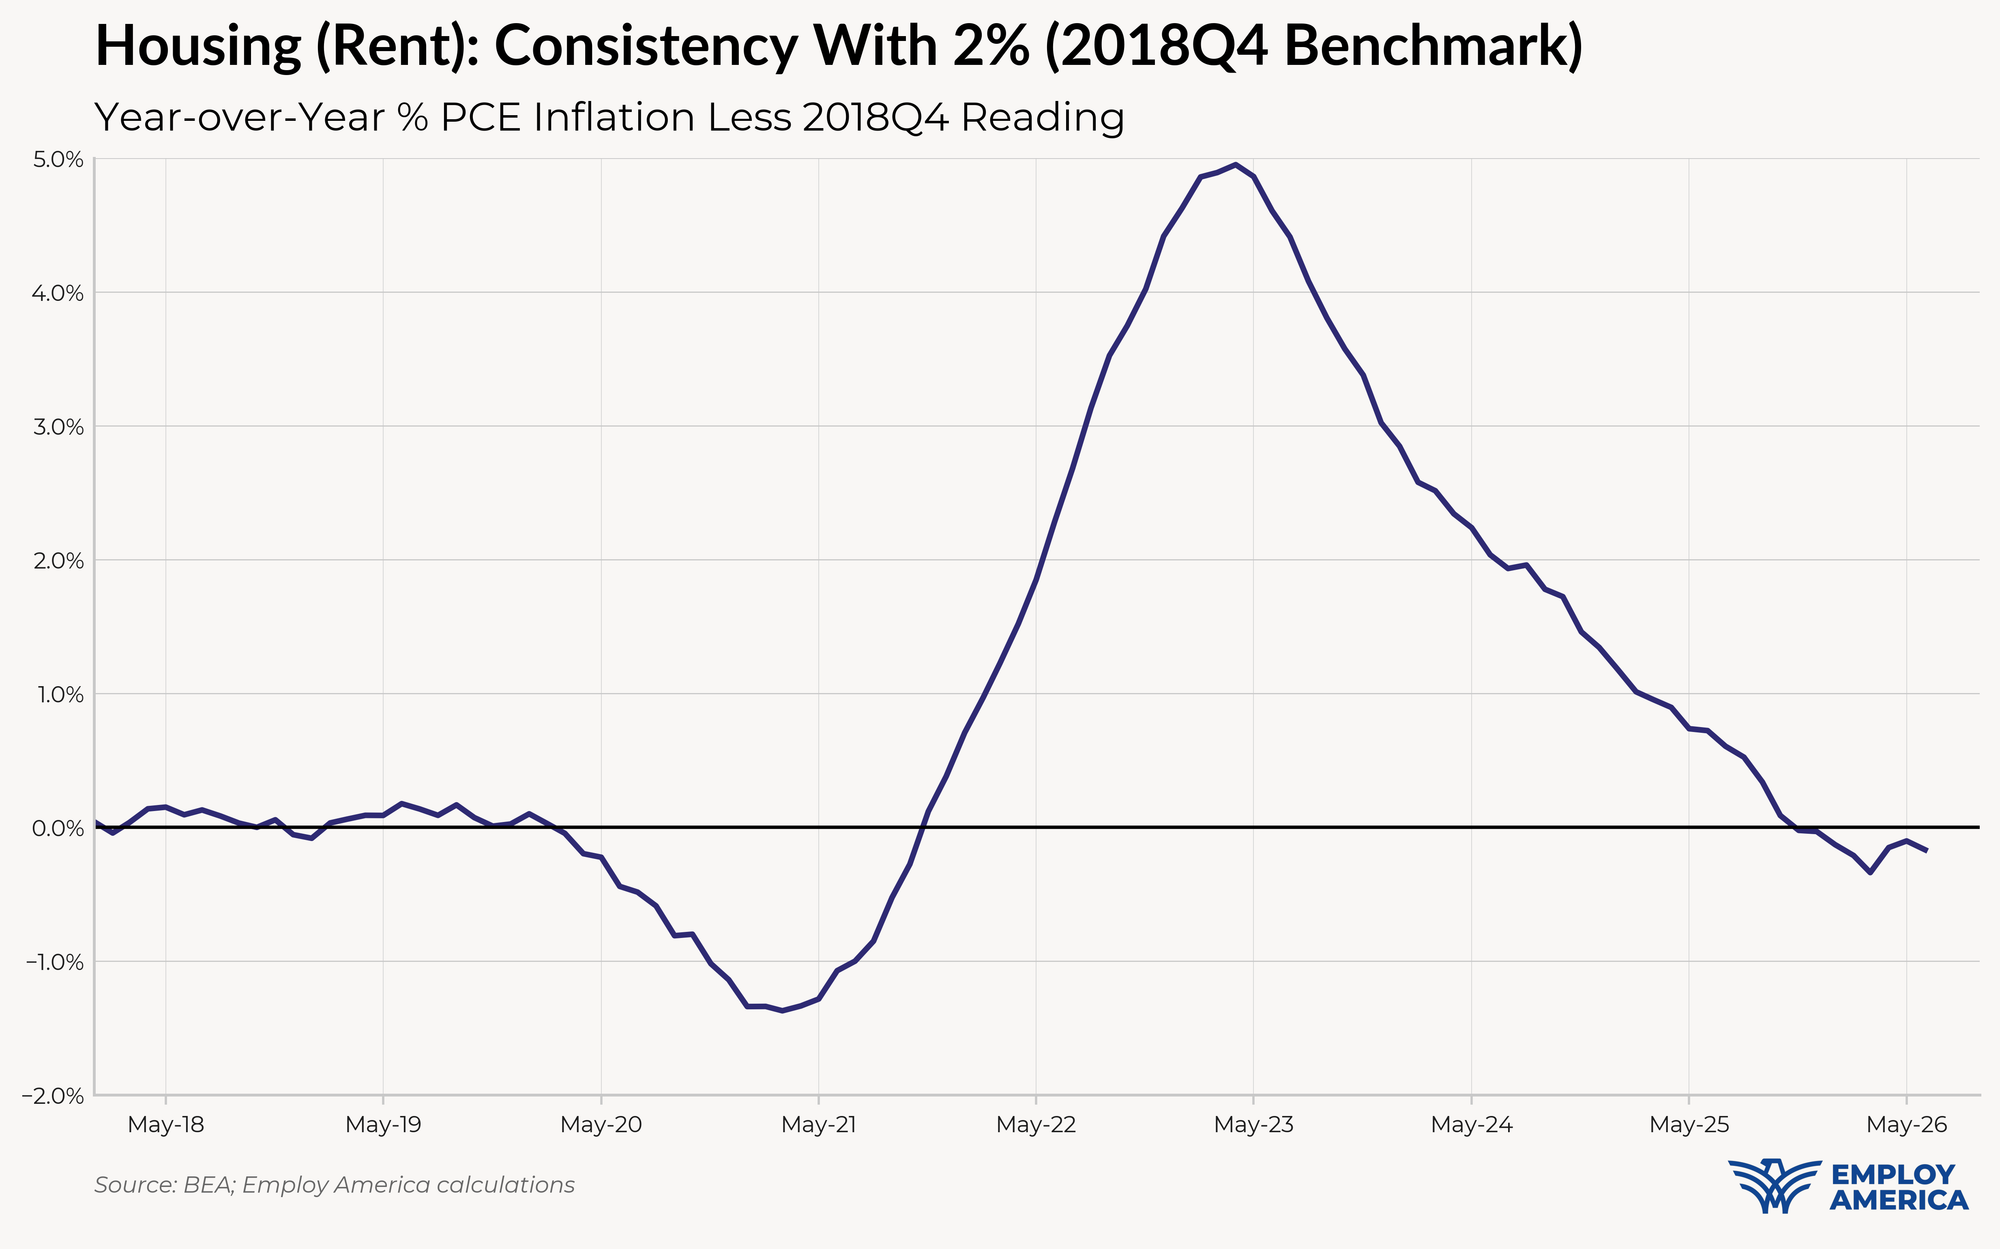
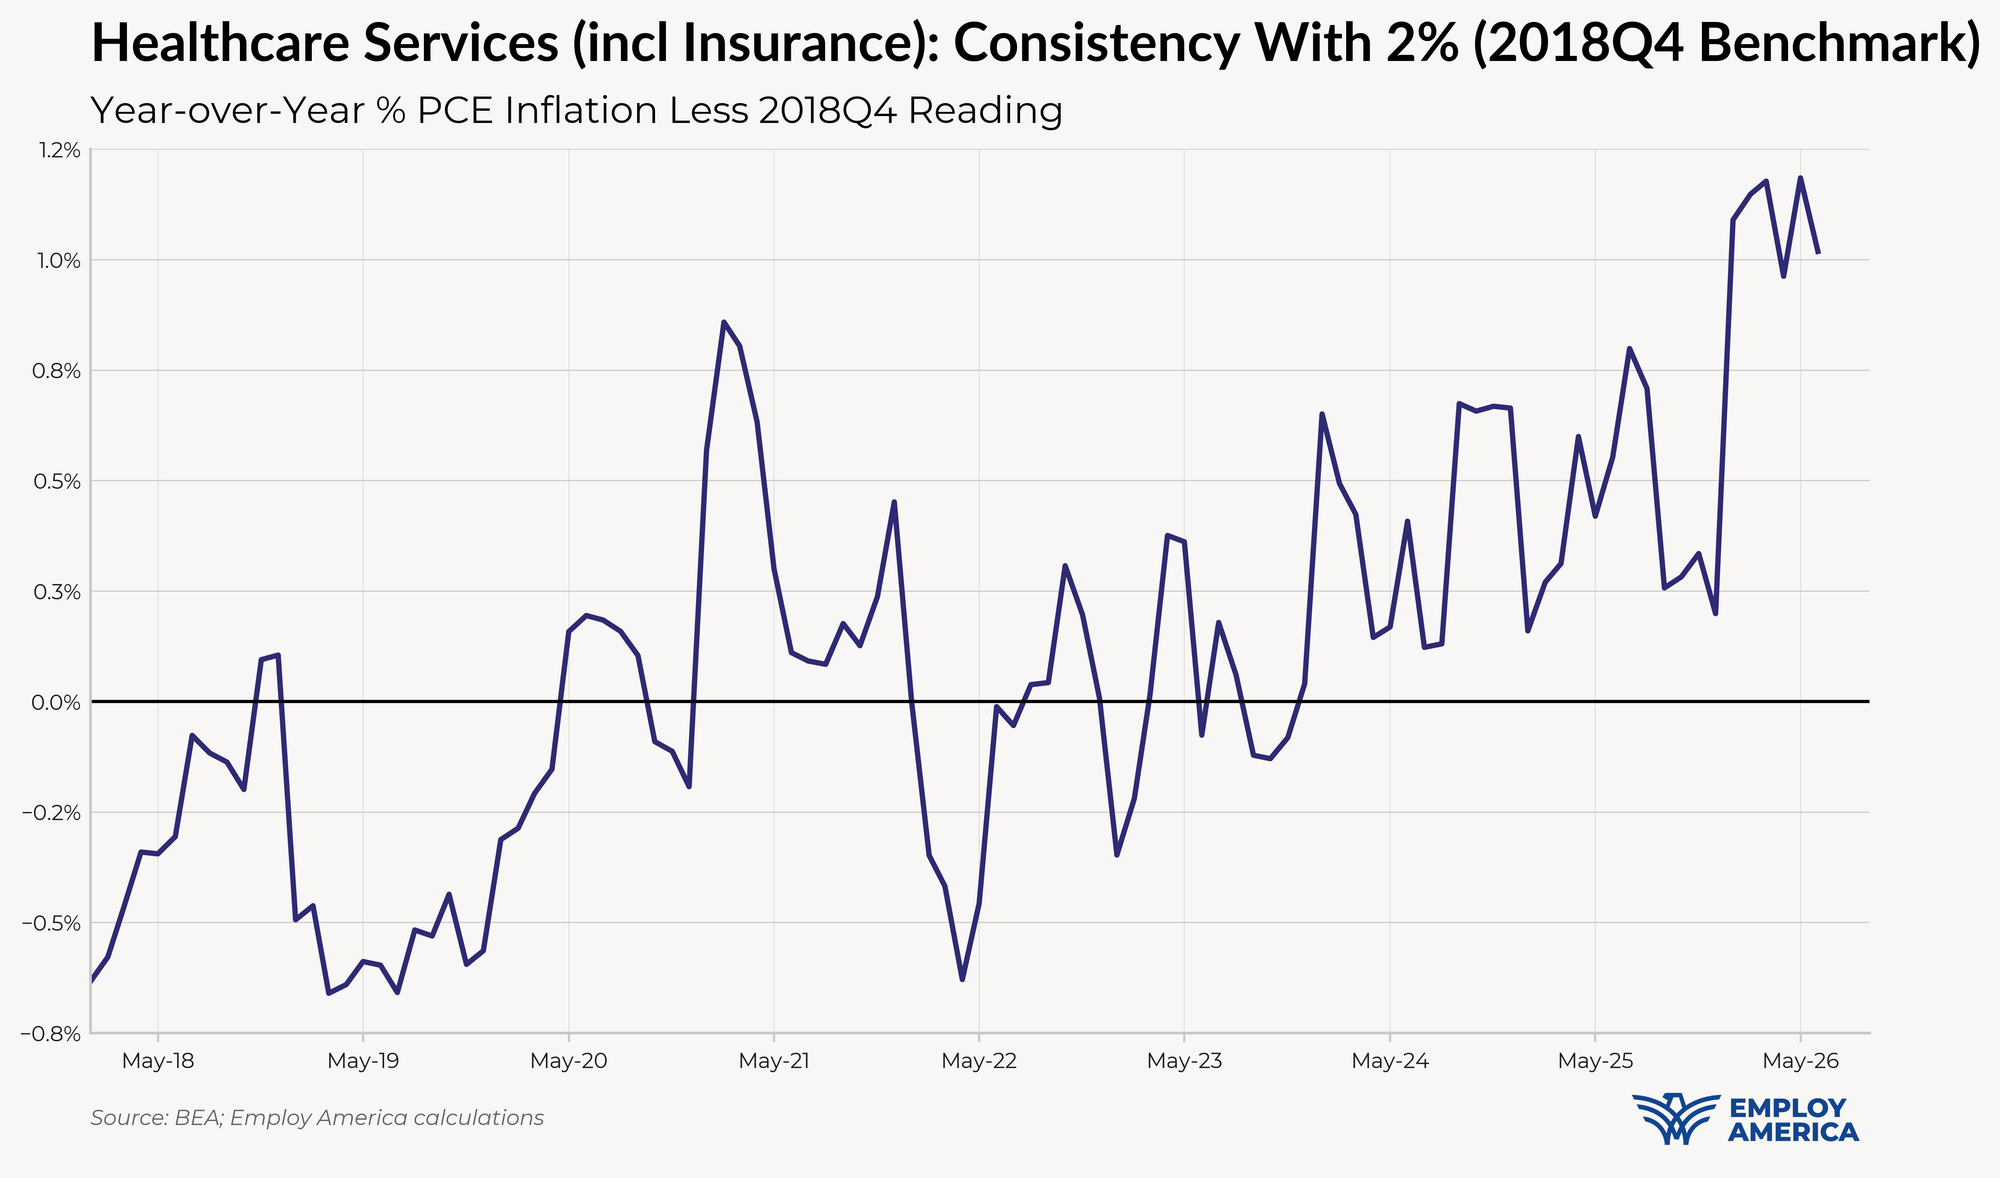
Our errors primarily stemmed from Supercore (core services ex-housing), while our nowcasts for core goods and housing came in right in line with our realized June numbers. Final consumption expenditures of nonprofit institutions (NPISH) was again our biggest miss (-0.86% nowcast vs 1.28% realized). Hospitals also came in softer than we anticipated (0.84% nowcast vs 0.66% realized), and airfares came in at -0.10% vs 0.66% nowcast.
Discussion
While the Fed opted to hold rates steady, the hawkishness continues to persist. We did not anticipate a dissent for Kashkari based on the Core PCE nowcasts heading into the June meeting. We believe the committee is moving towards an even more hawkish posture than what the June SEP implied. We believe the committee will want to see consistent inflation readings in the 15-20bp (or lower) range to hold rates steady.
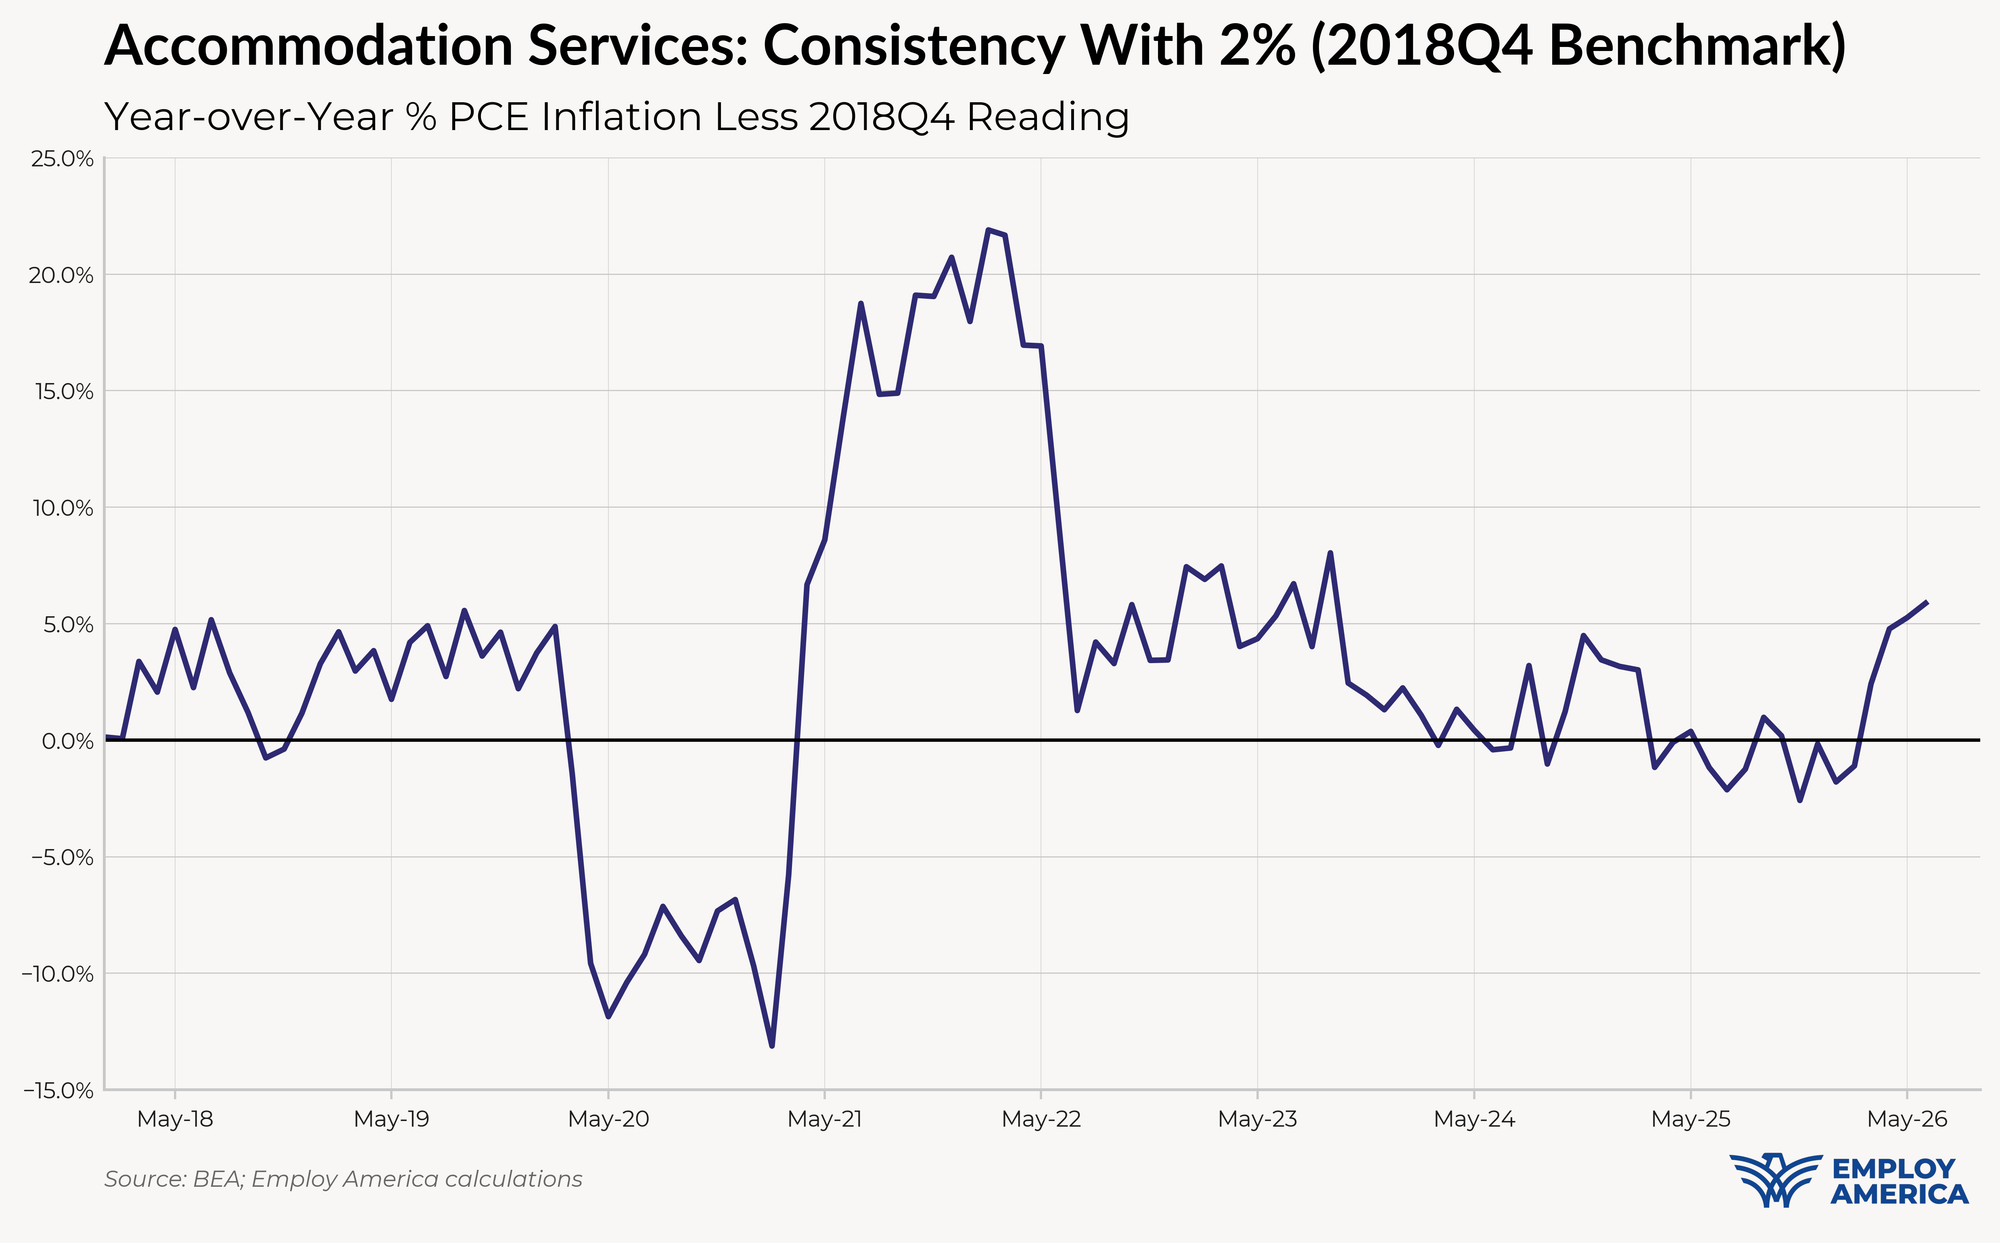
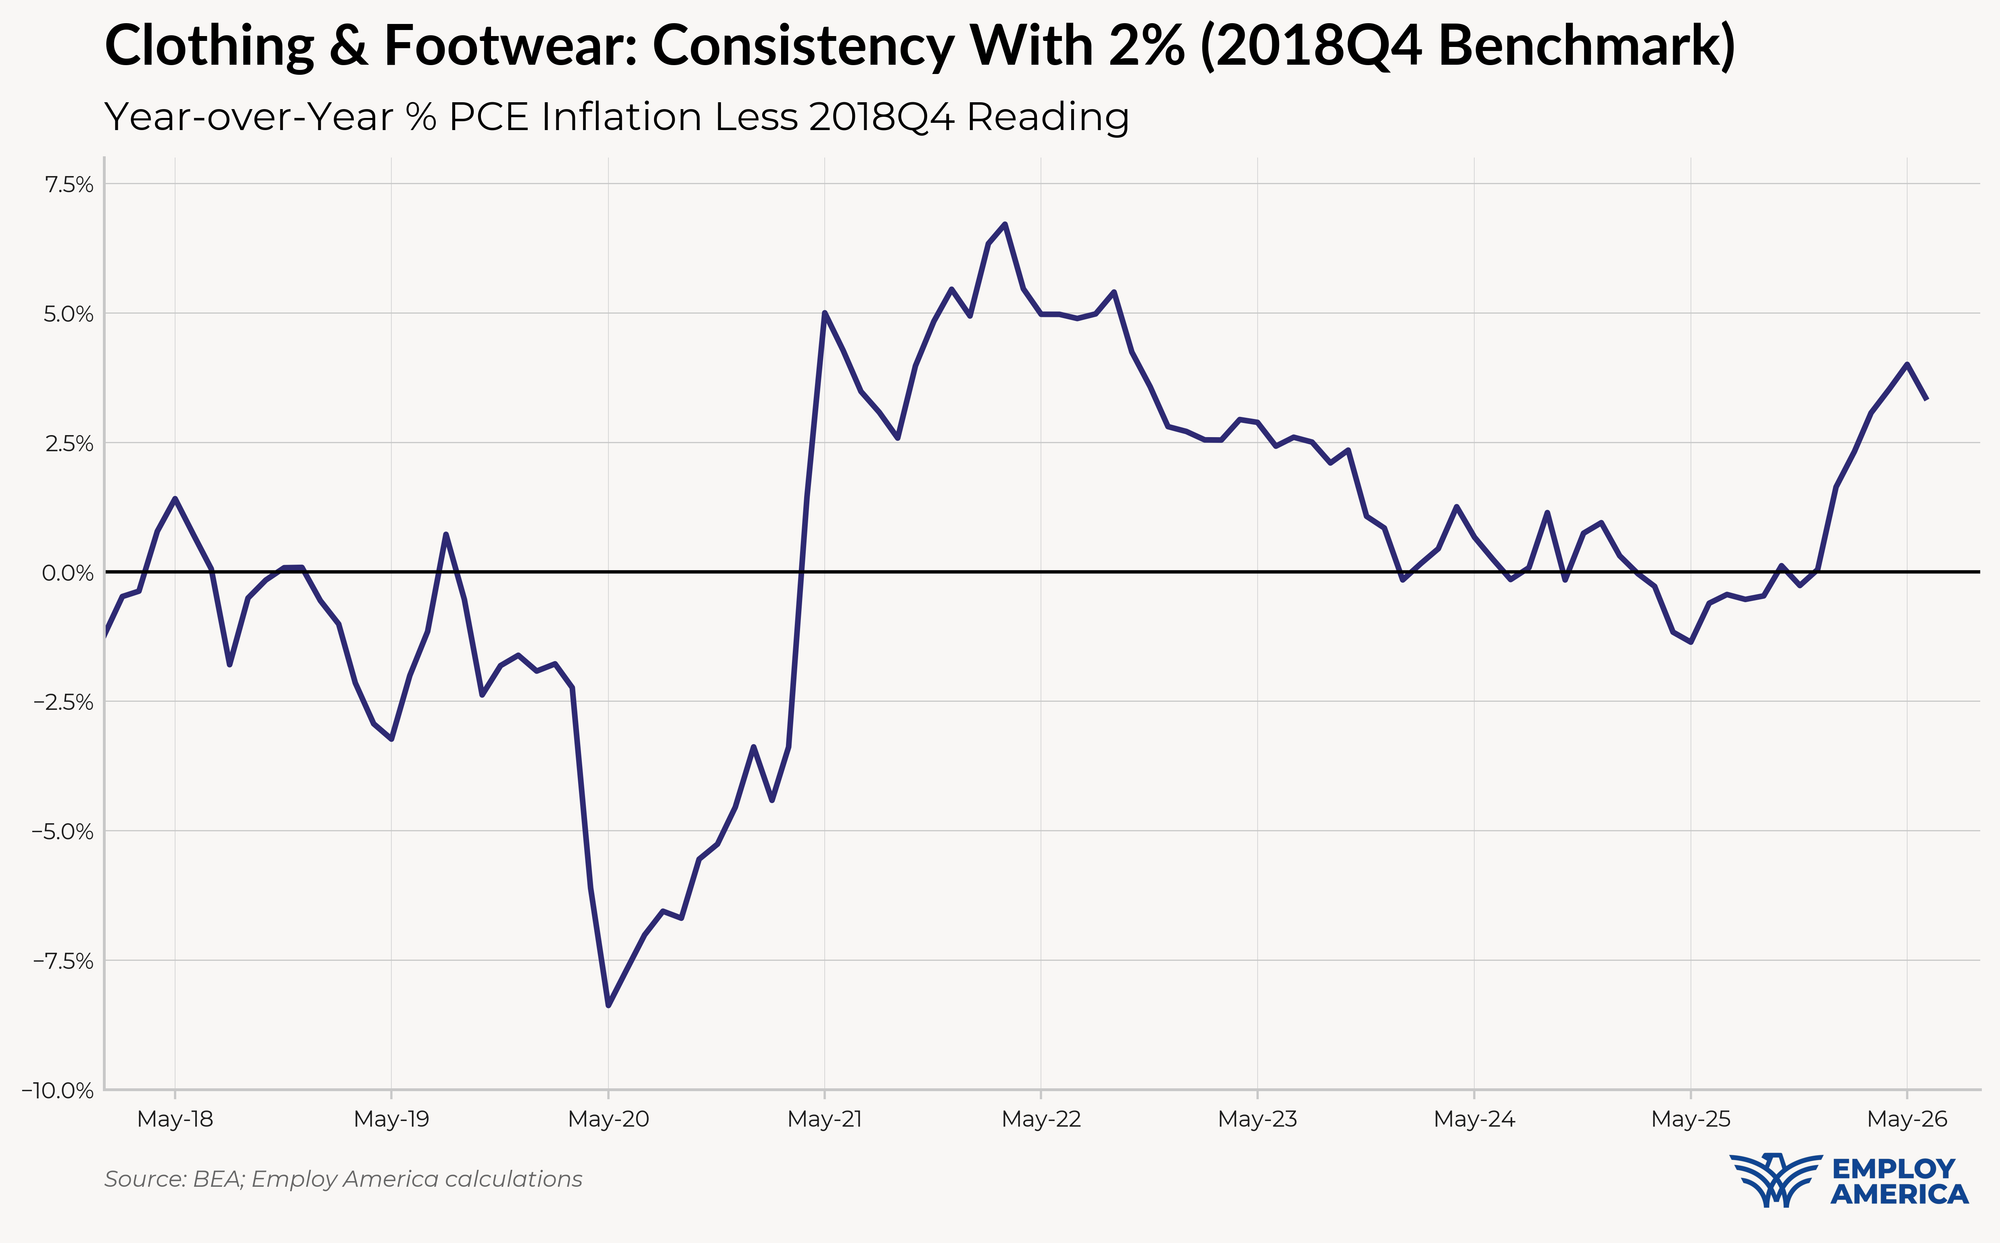
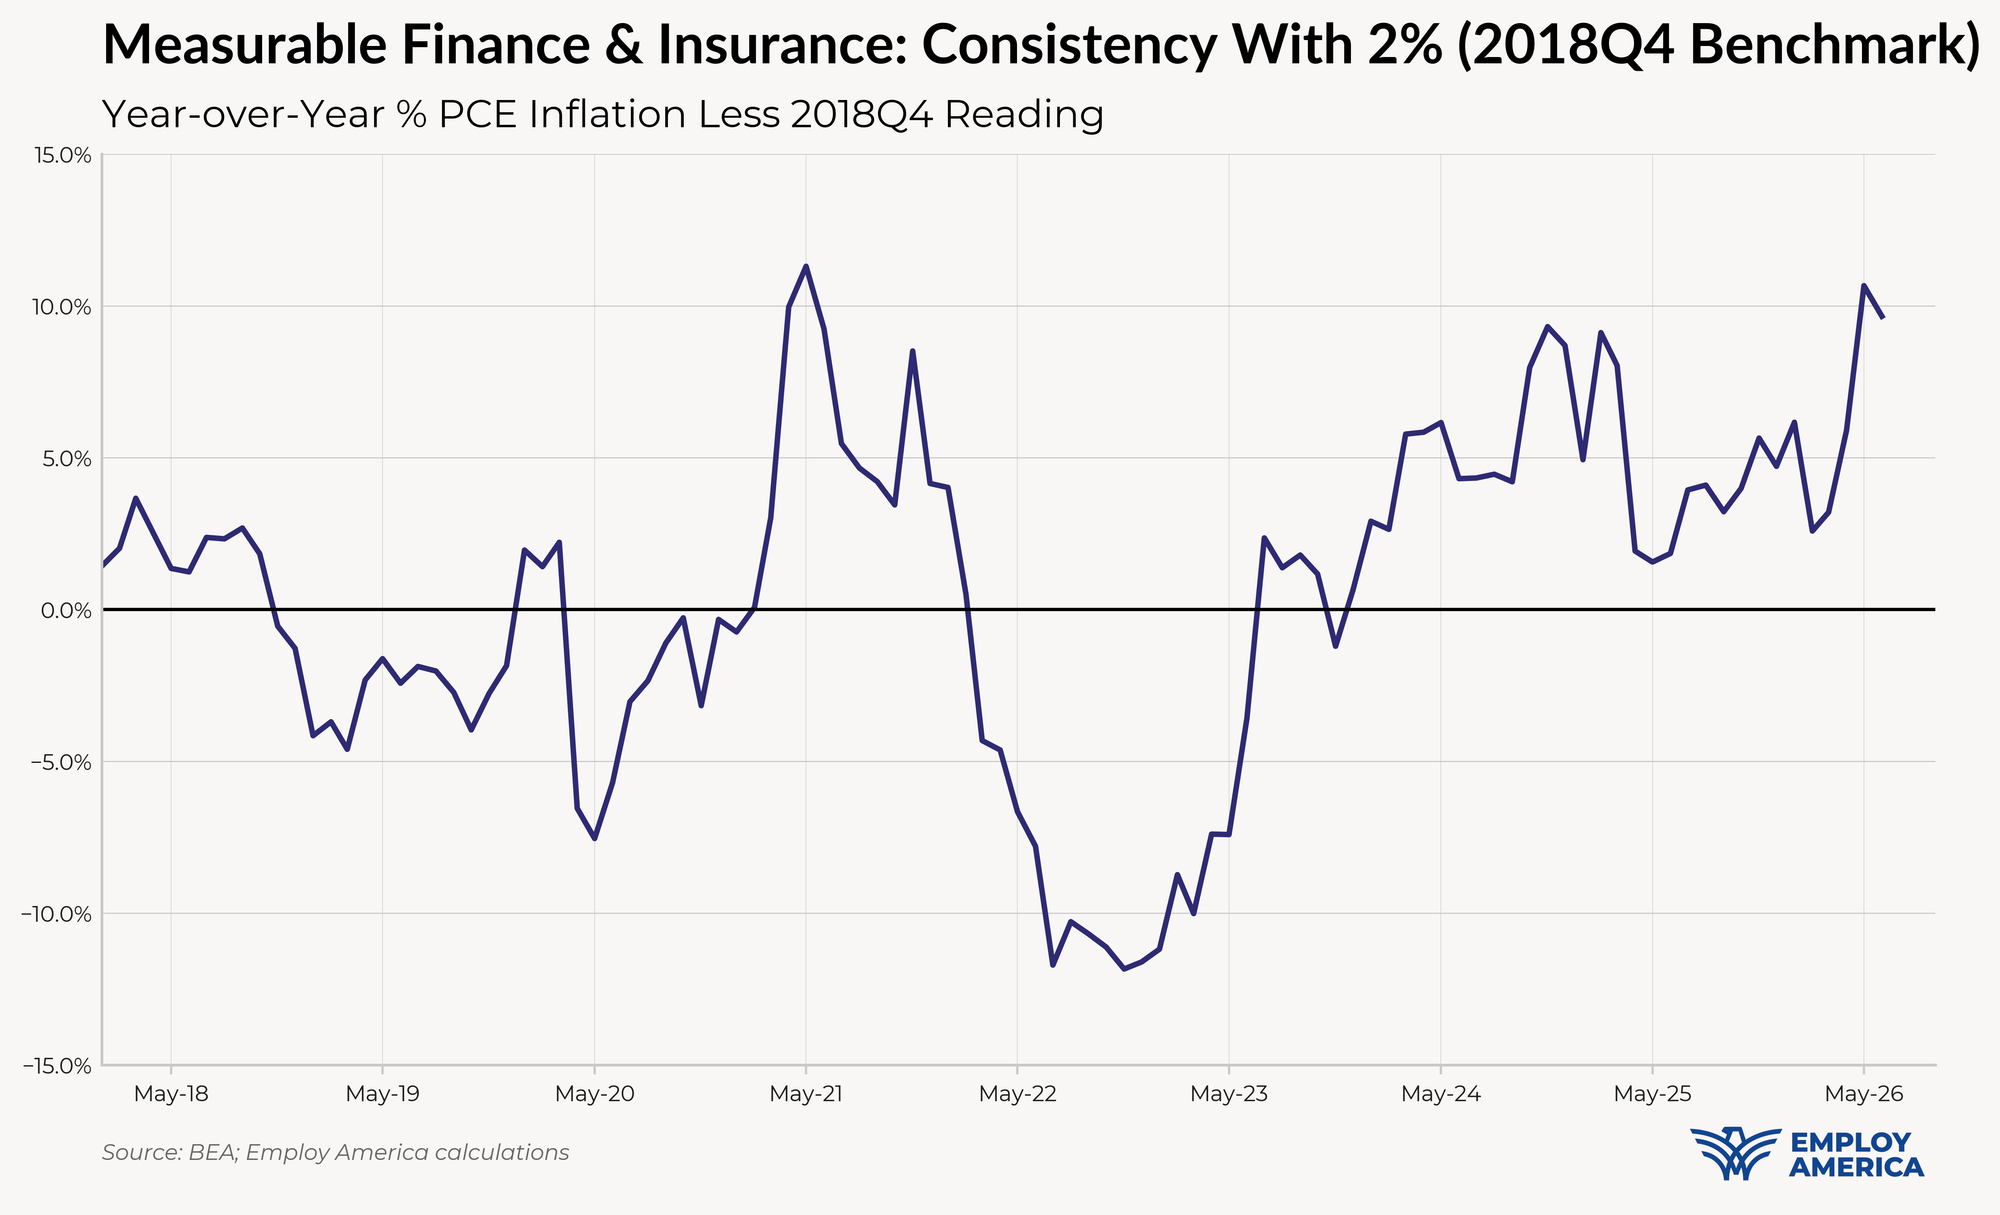
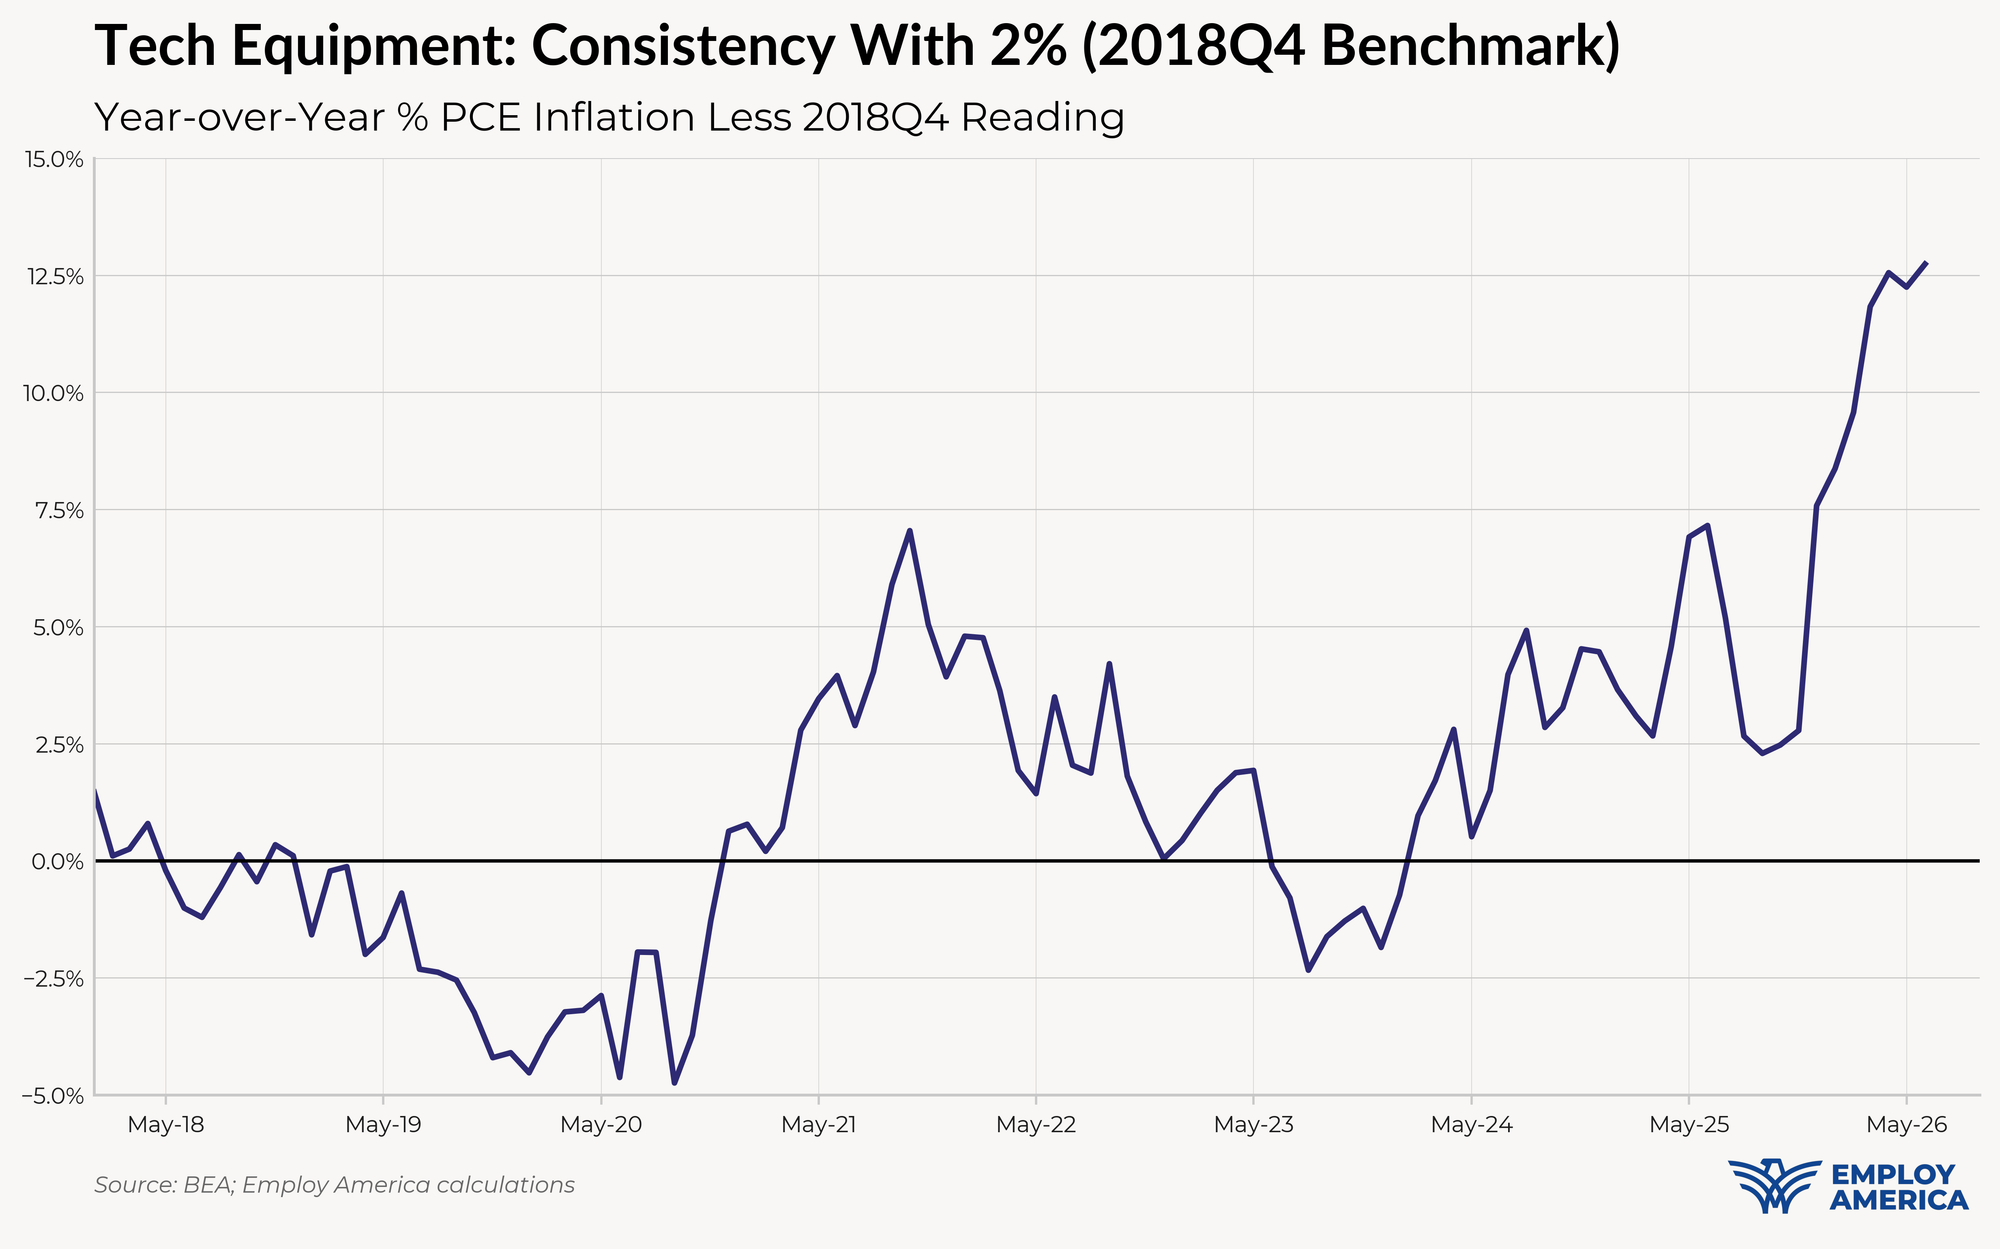
We anticipate inflation to come in much hotter next month due to some payback in core services categories that did came in soft in June. In particular, we see upside risk for airfares, lodging away from home, in-person recreational services, and food services inflation in July. We still see upside risk for tech equipment due to the storage and memory bottlenecks from the AI boom. Apple has already hiked prices and others have announced price hikes rolling out over the course of the year. Should this shortage persist, we could see production declines or manufacturers substituting in lesser-quality inputs for vehicles, TVs, smart appliances, and other devices that use memory chips. We will have more to say in the July inflation preview.
Underlying Inflation
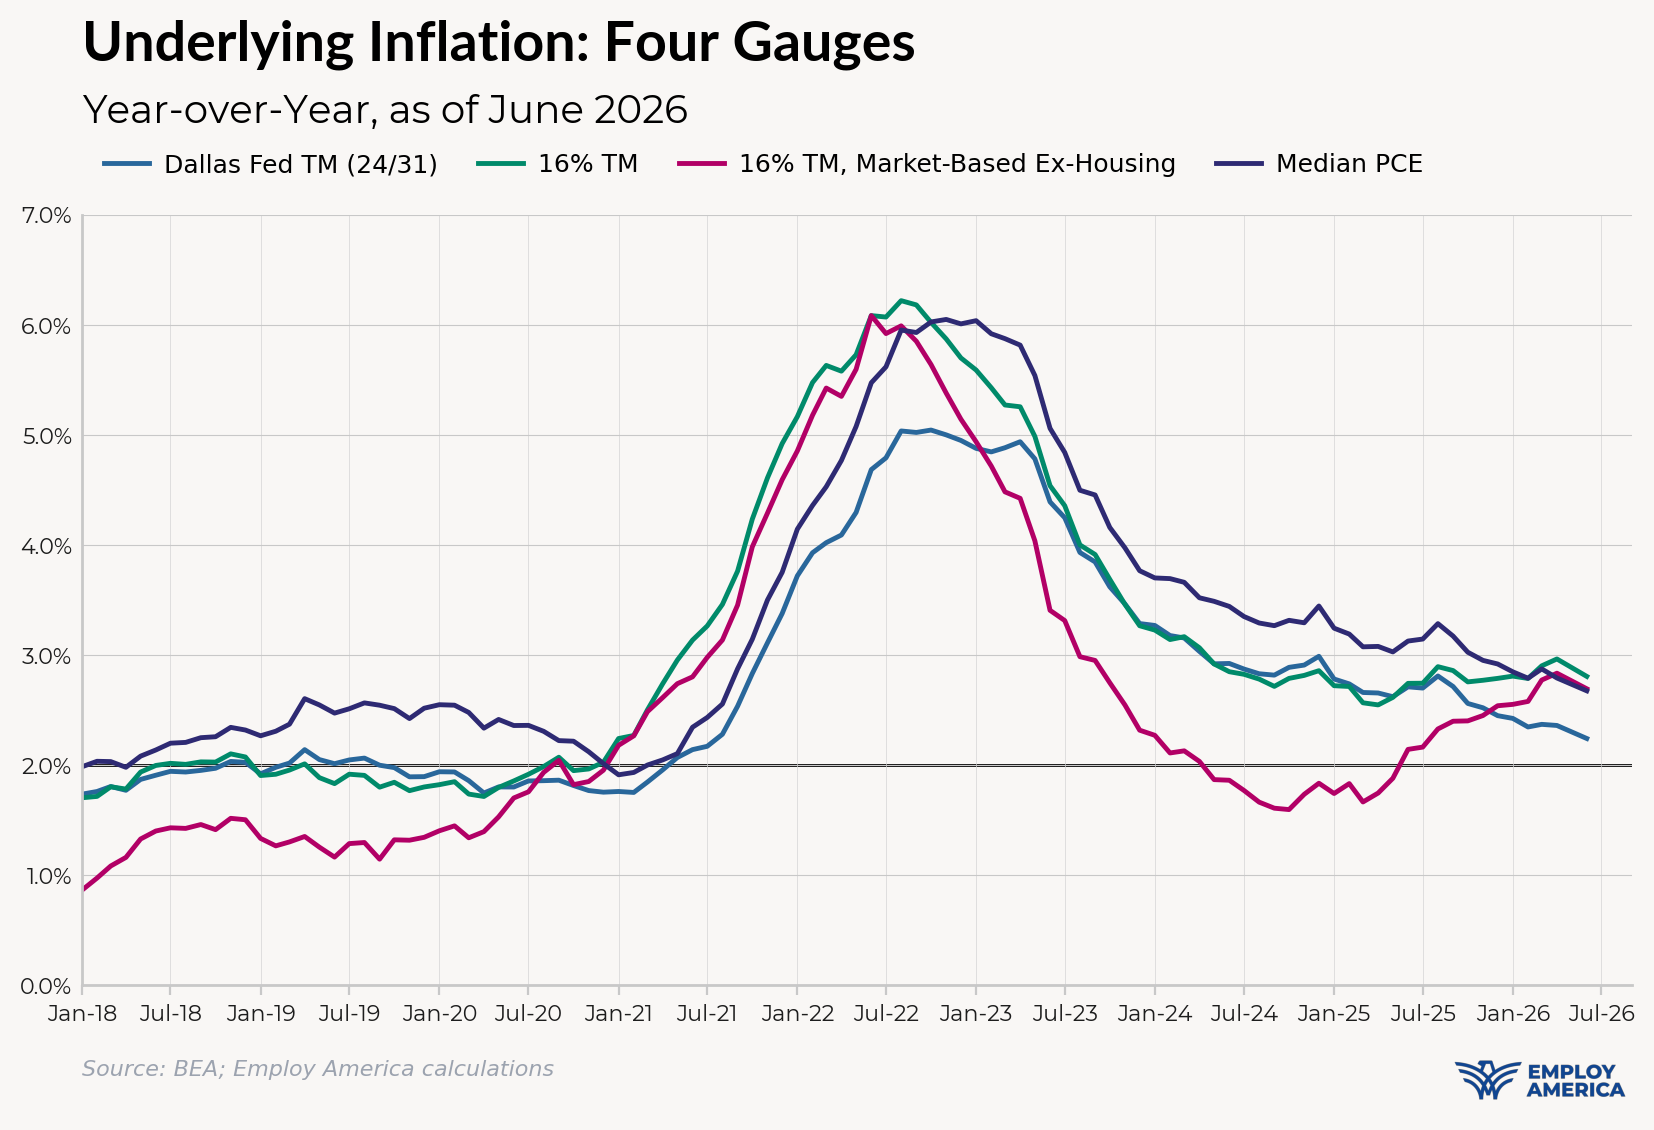
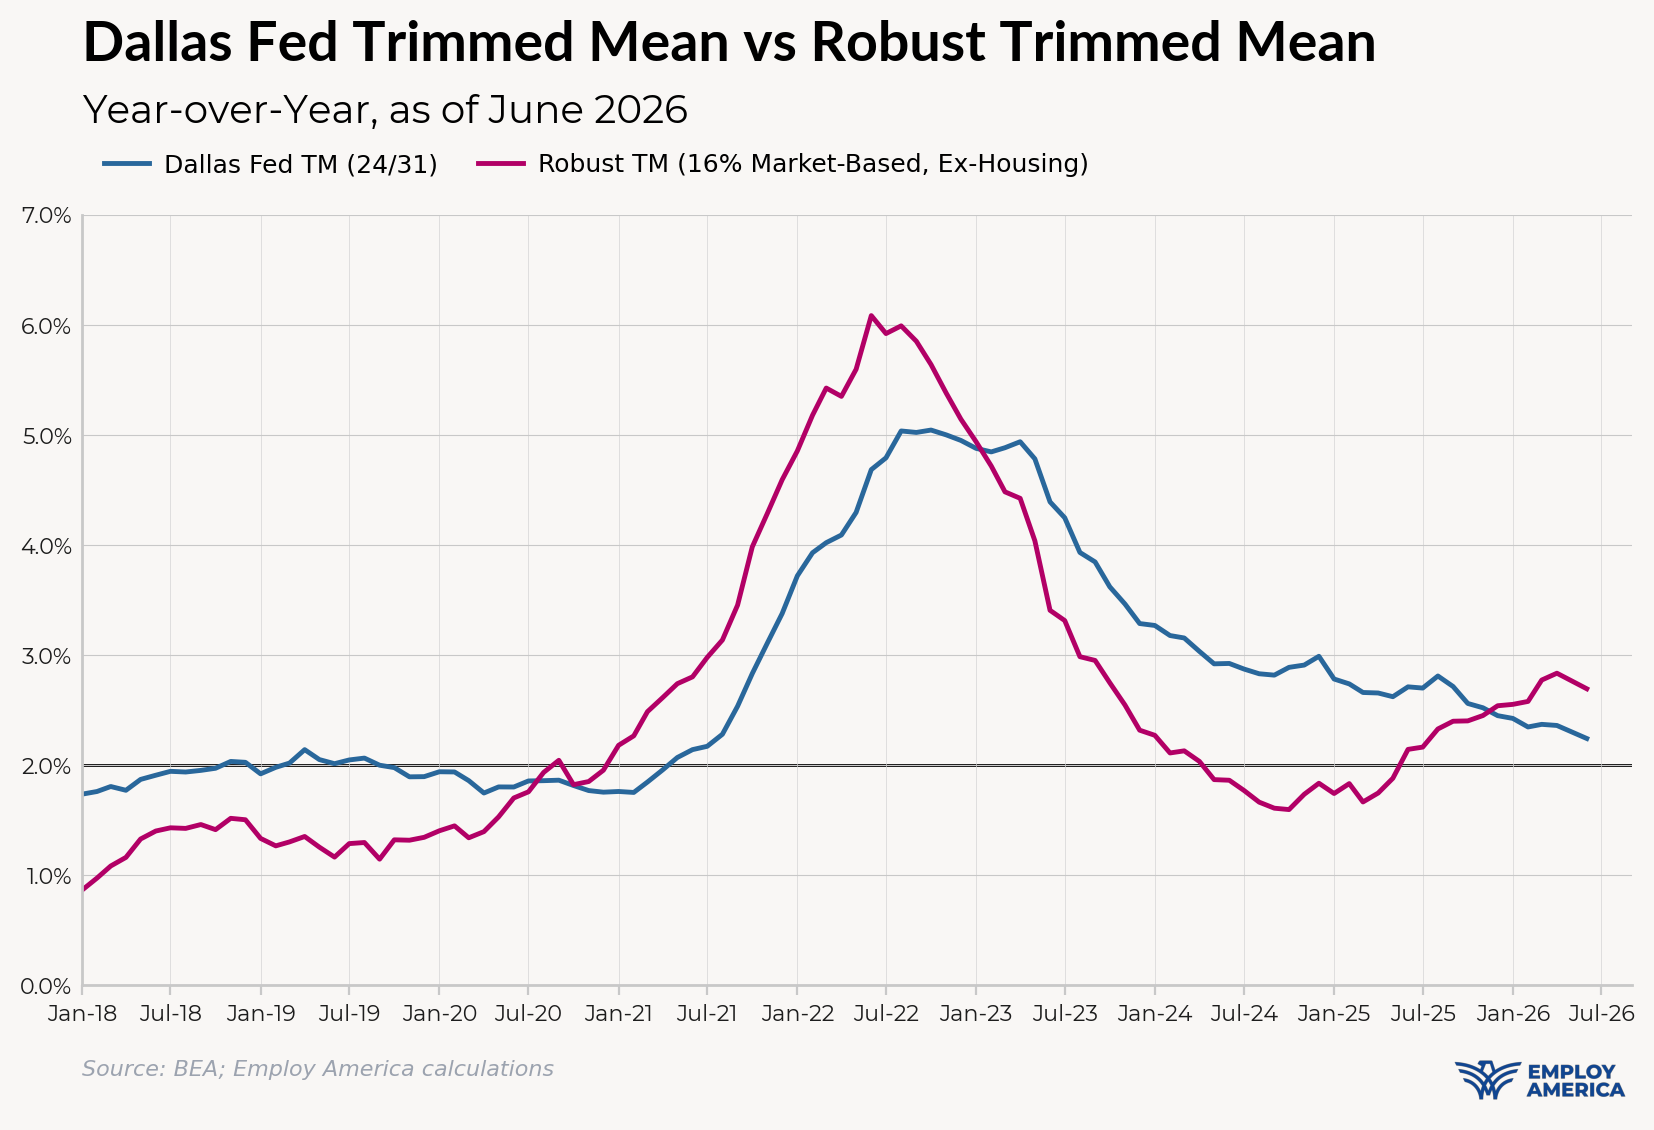
While Chair Warsh did a 180 at his Humphrey-Hawkins hearings, backing away from his professed support for trimmed mean and median PCE inflation gauges, they may be back in play come January, as he alluded to potentially changing PCE as the measure the Fed targets.
"The Federal Reserve every January outlines a statement of purposes and strategy, and in that strategy document, which I believe was dated January of this year, it describes a measure of PCE inflation as the – as the objective function there. I have enough of my – so that's our number, we're sticking with it. Who knows come after next January what we might say about strategy. I suspect the task forces might have something to add."
Inflation Overshoots at the Component Level
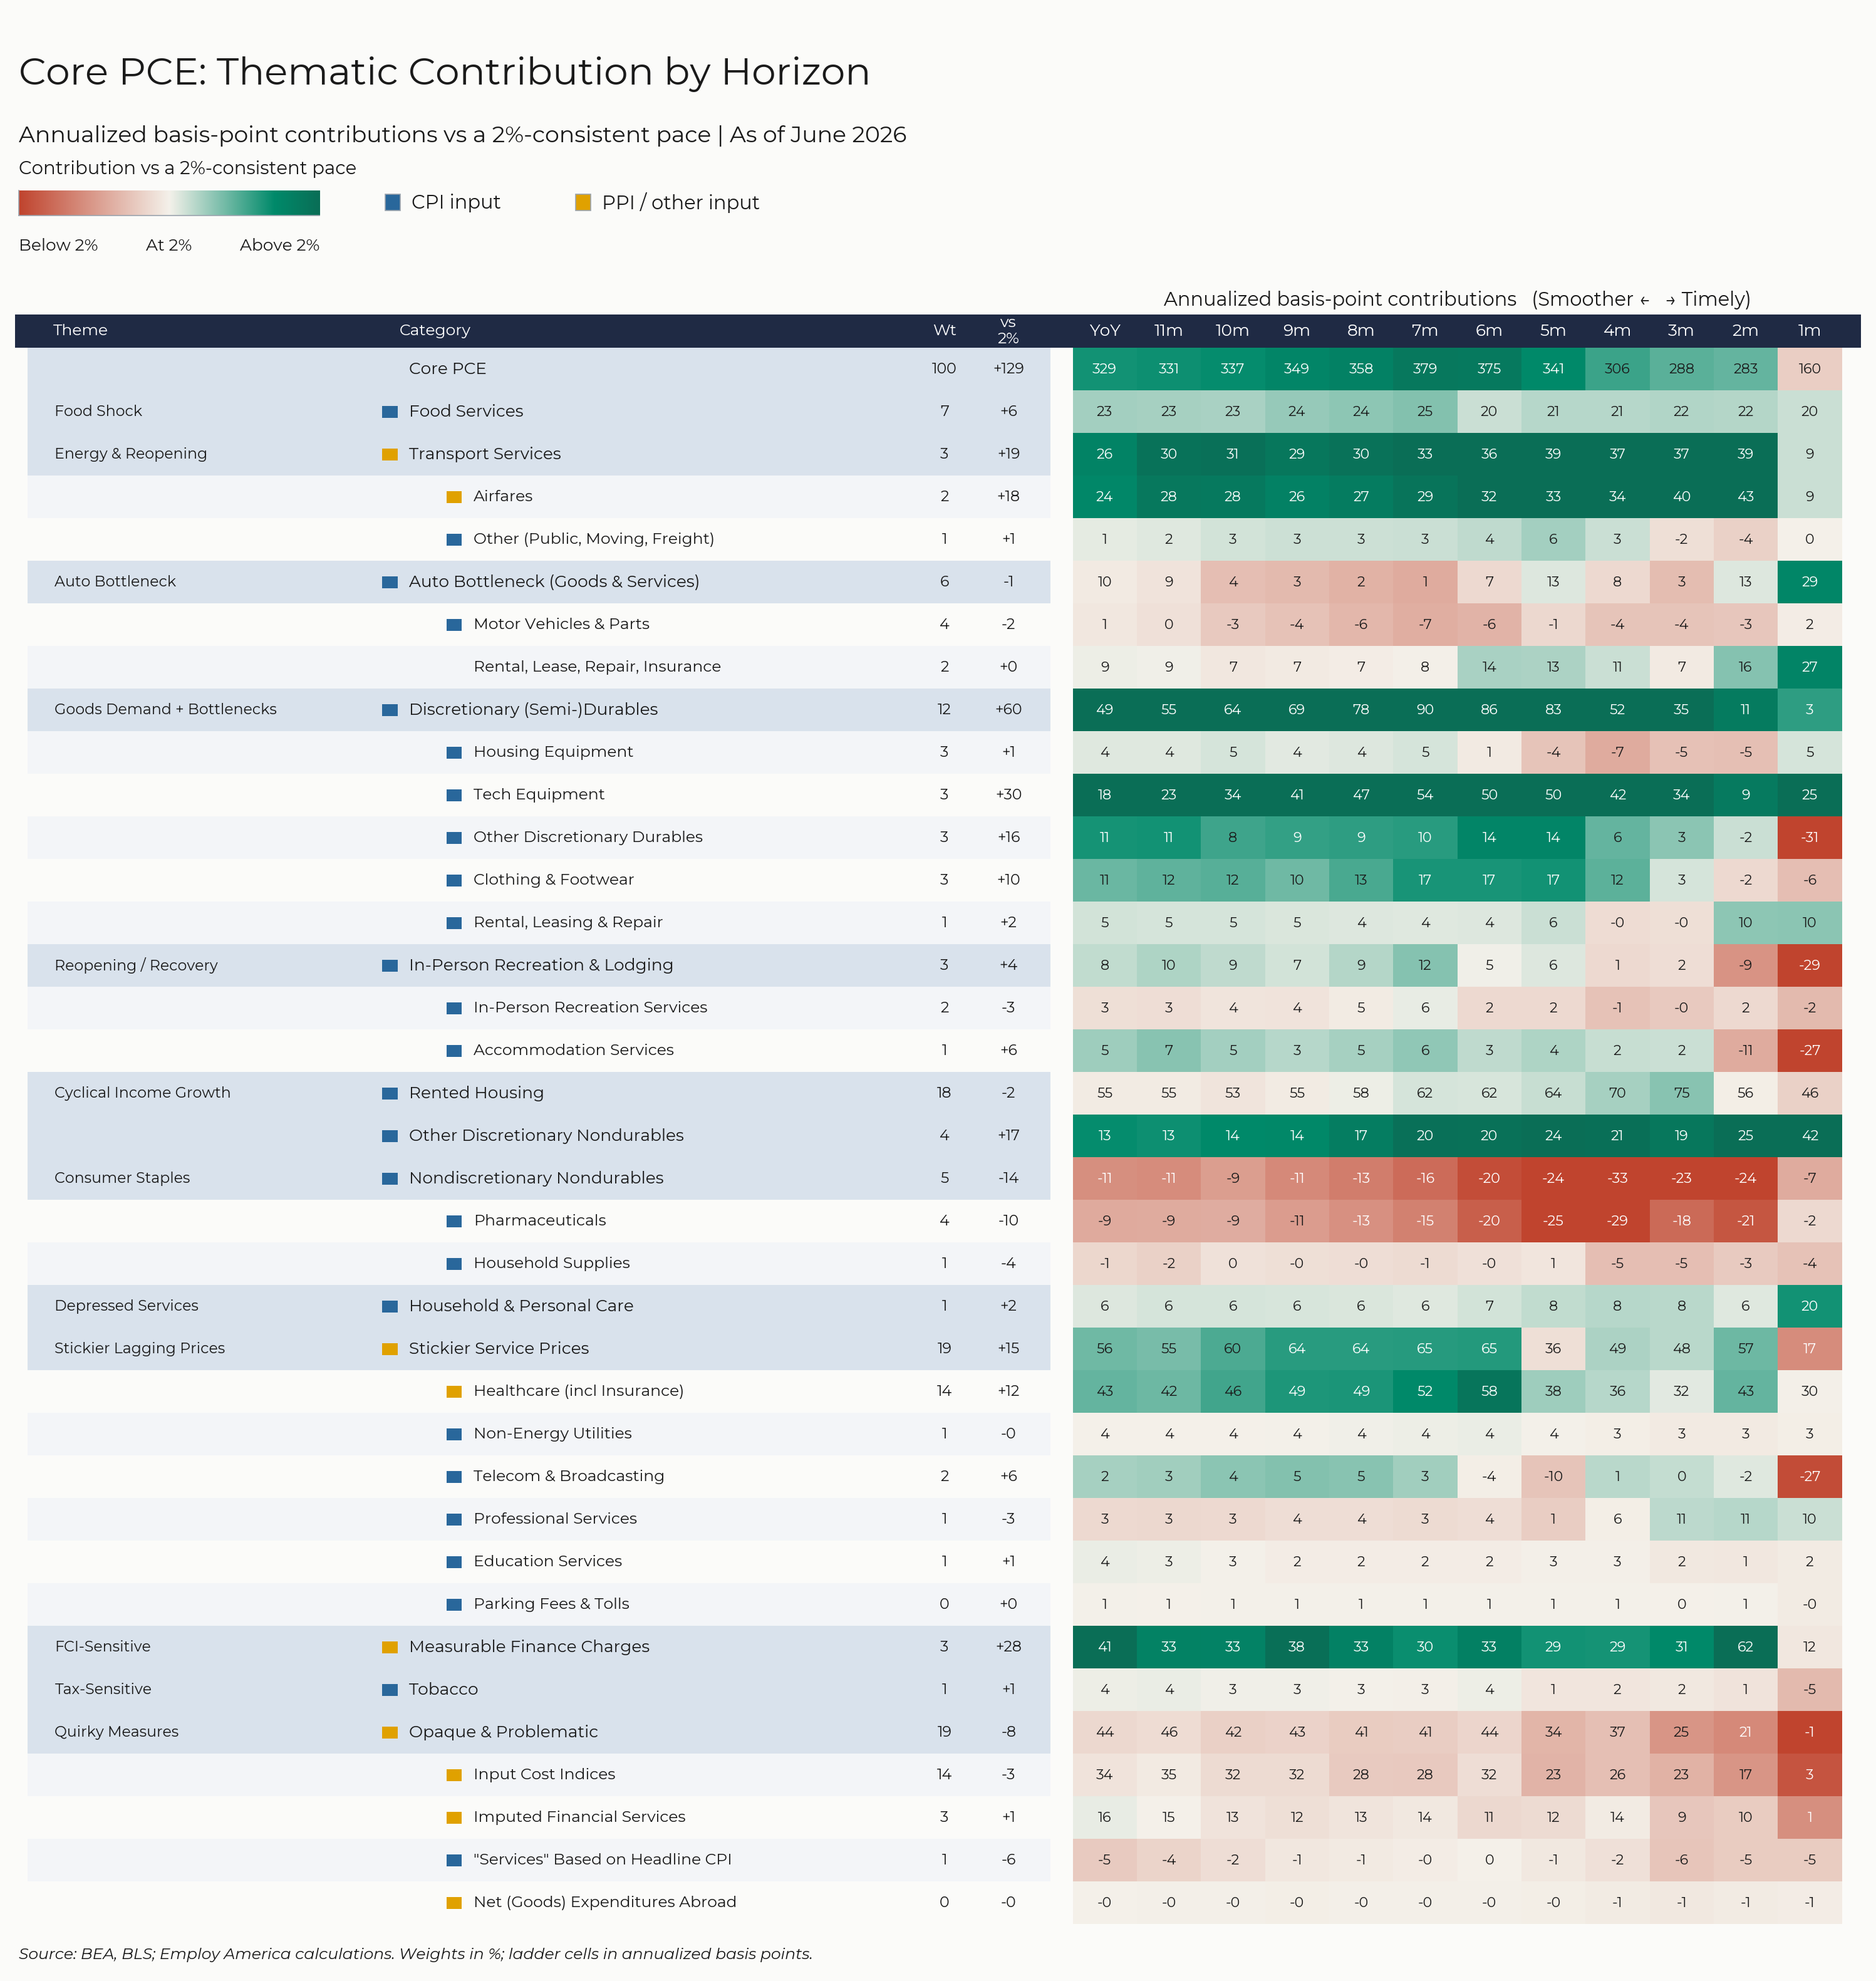
For the Detail-Oriented: Core PCE Heatmaps
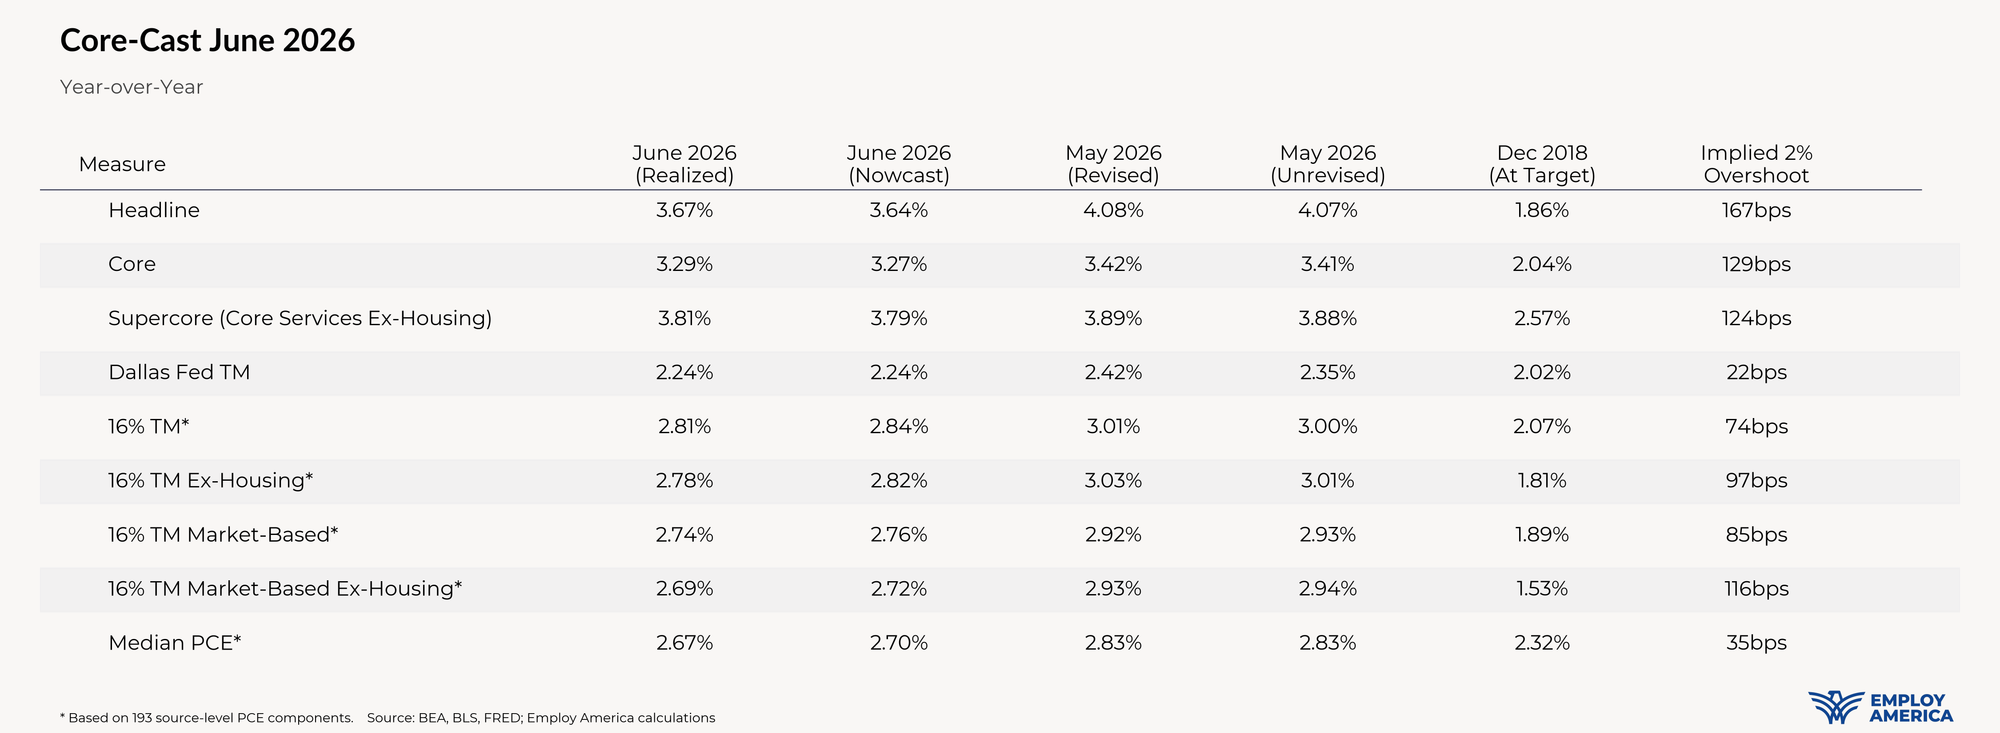
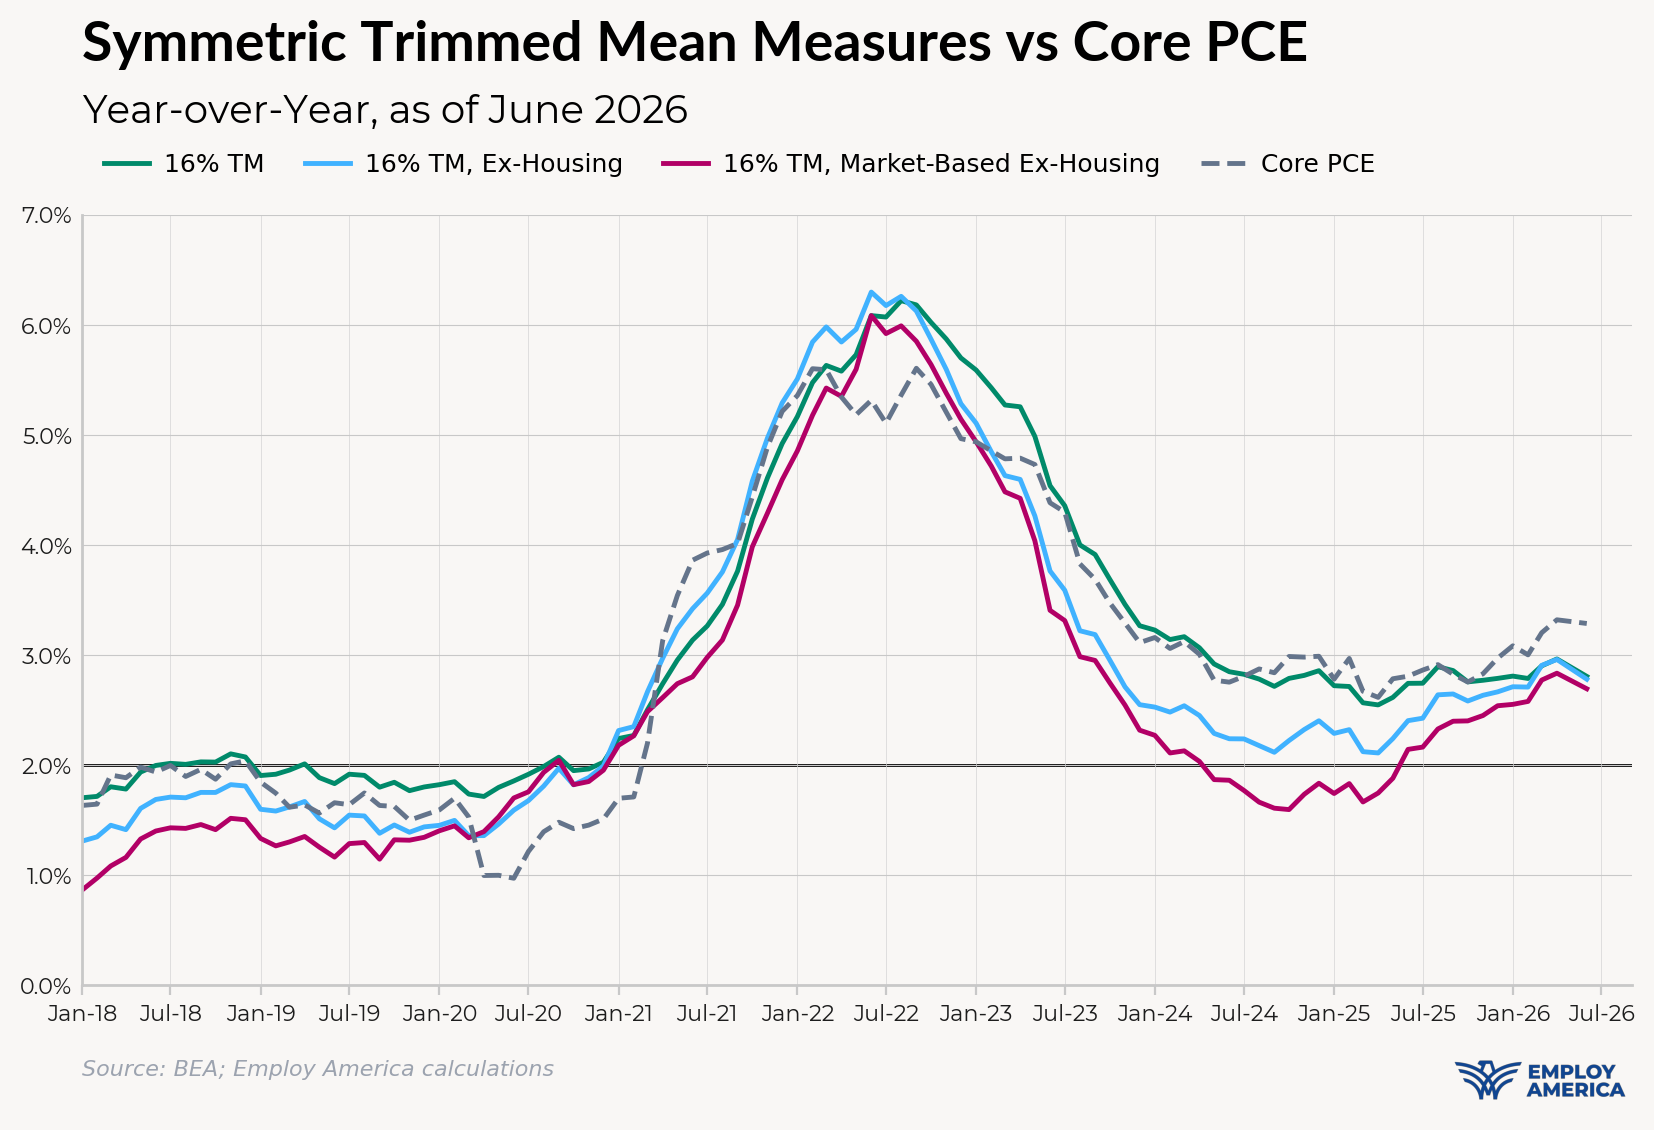
Right now Core PCE (PCE less food products and energy) is running at a 3.29% pace as of June, 129 basis points above the Fed's 2% PCE target.
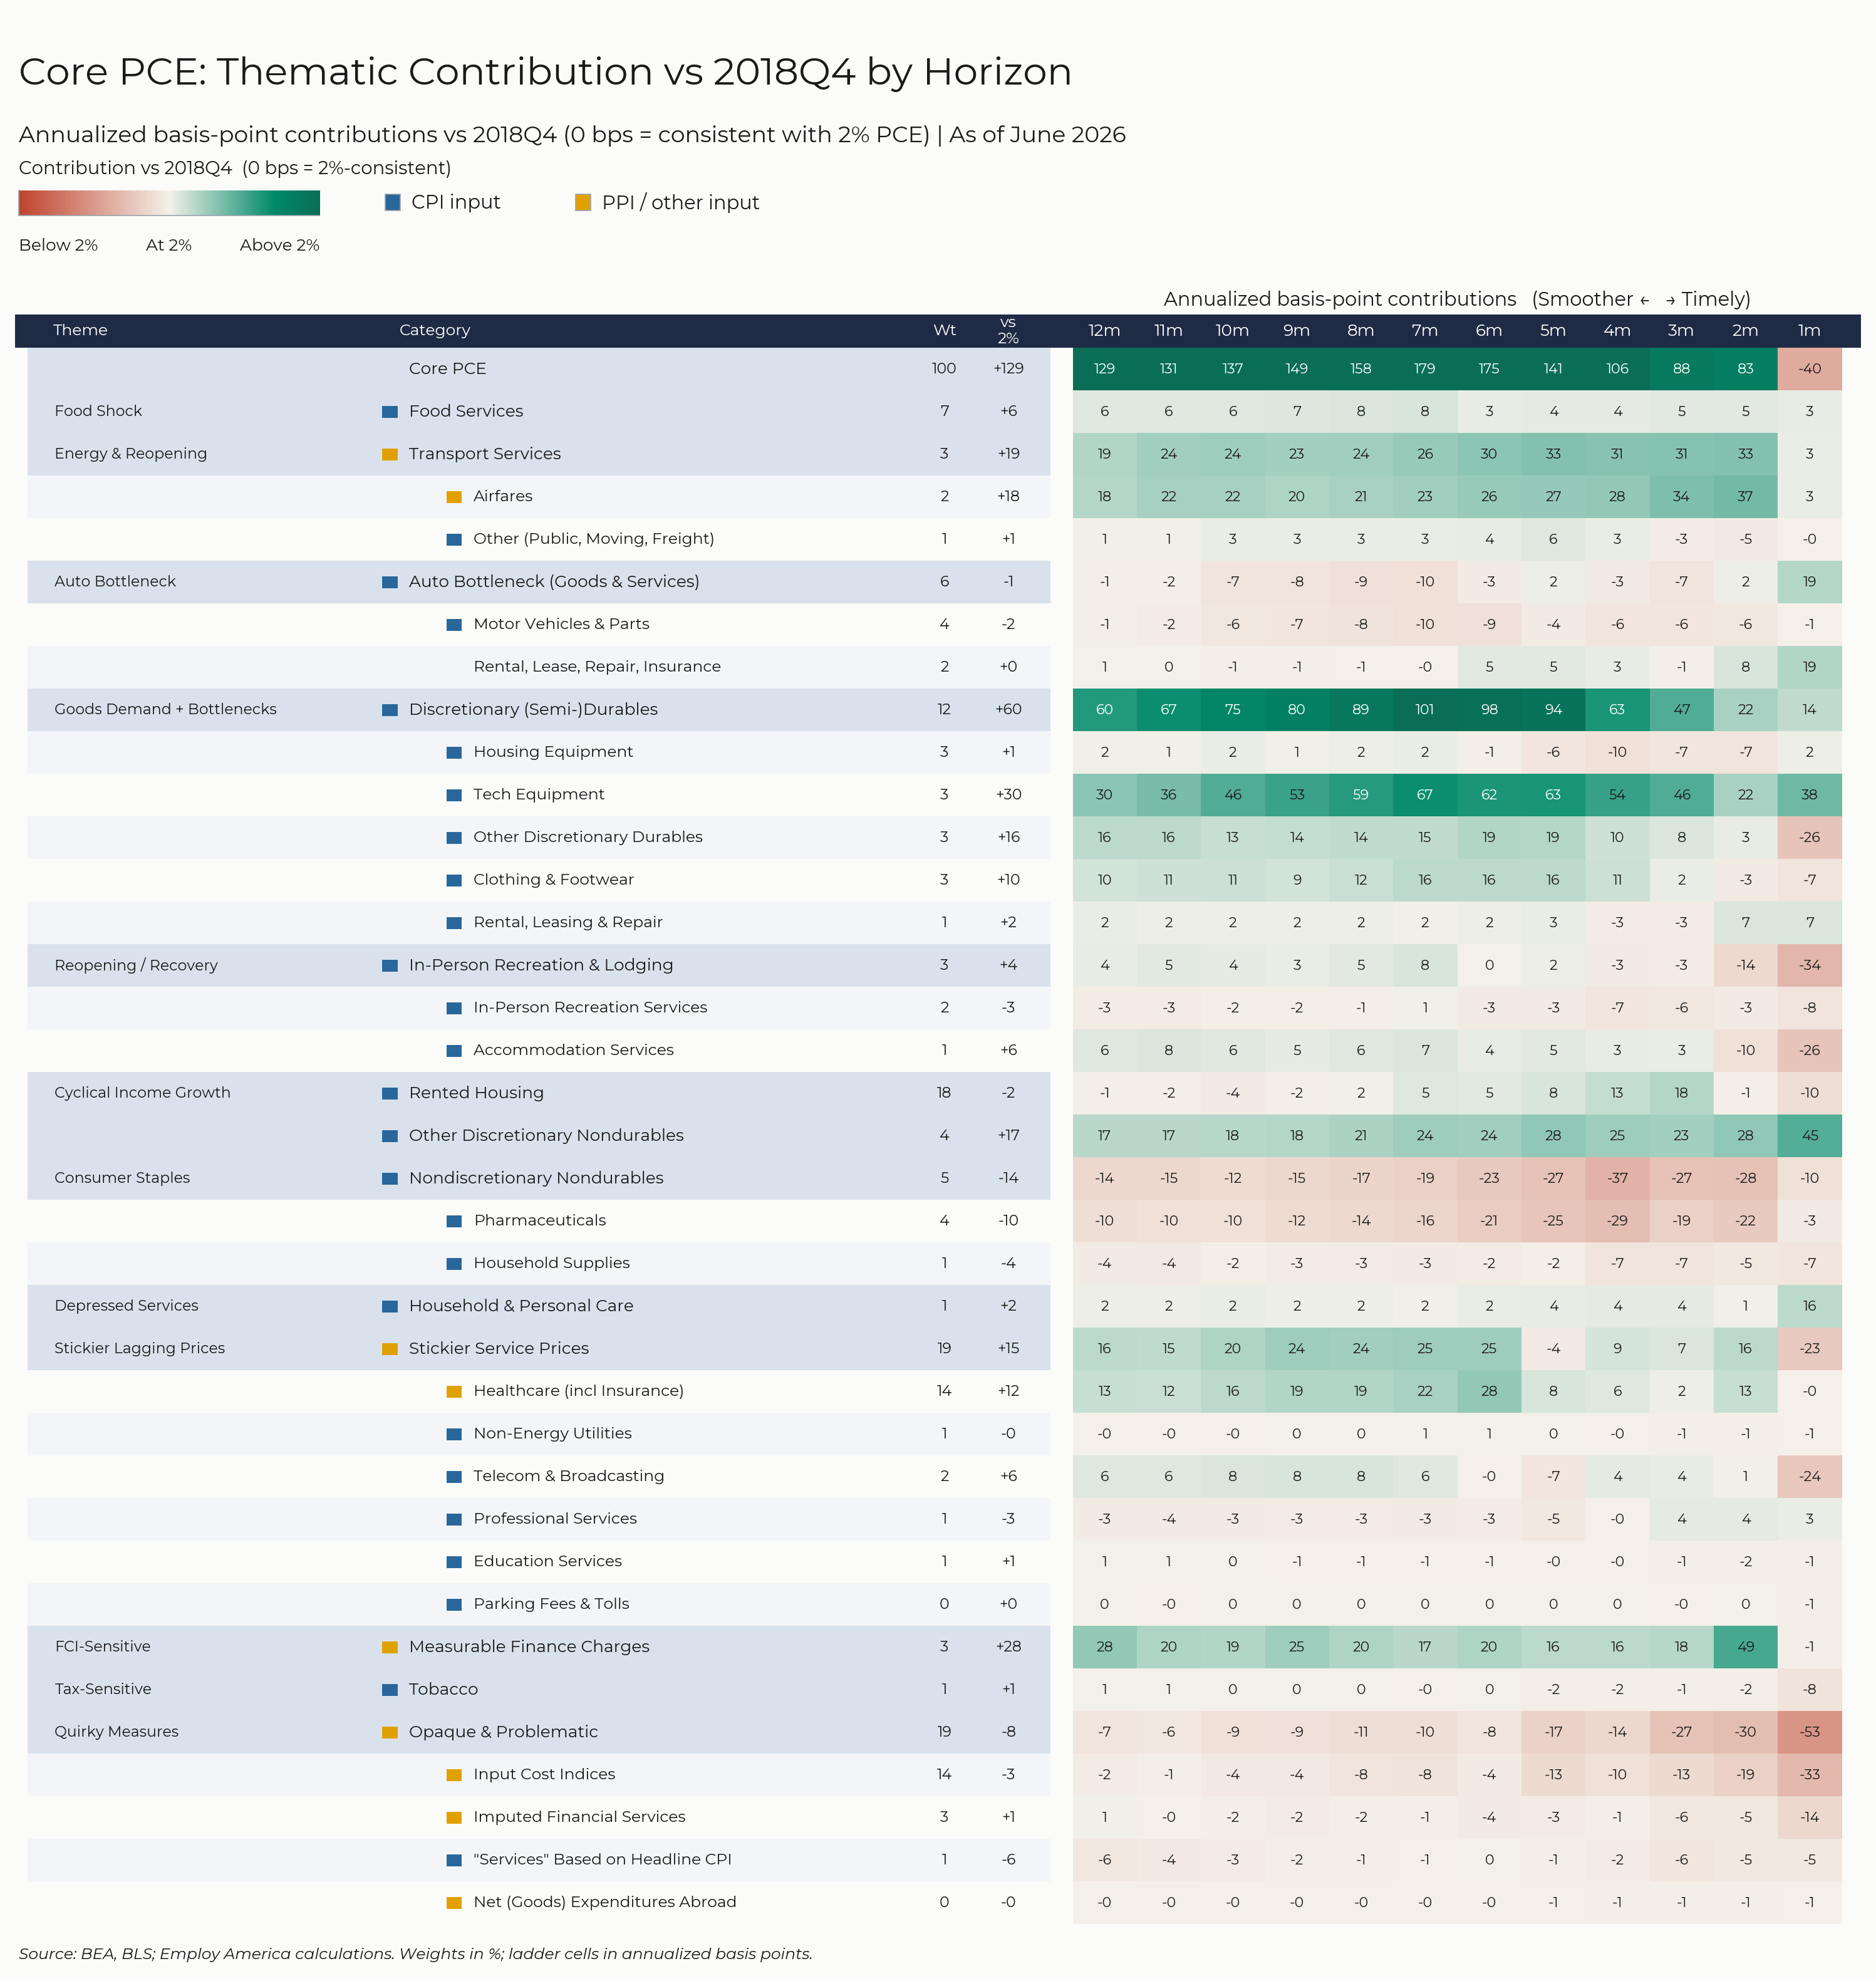
The final heatmap below gives you a sense of the overshoot on shorter annualized run-rates. June monthly annualized Core PCE is running at a 1.60% annualized pace, a 40 basis point undershoot vs 2% target inflation. These estimates are subject to substantial revision as more data gets released (IPI, GDP, PCE).
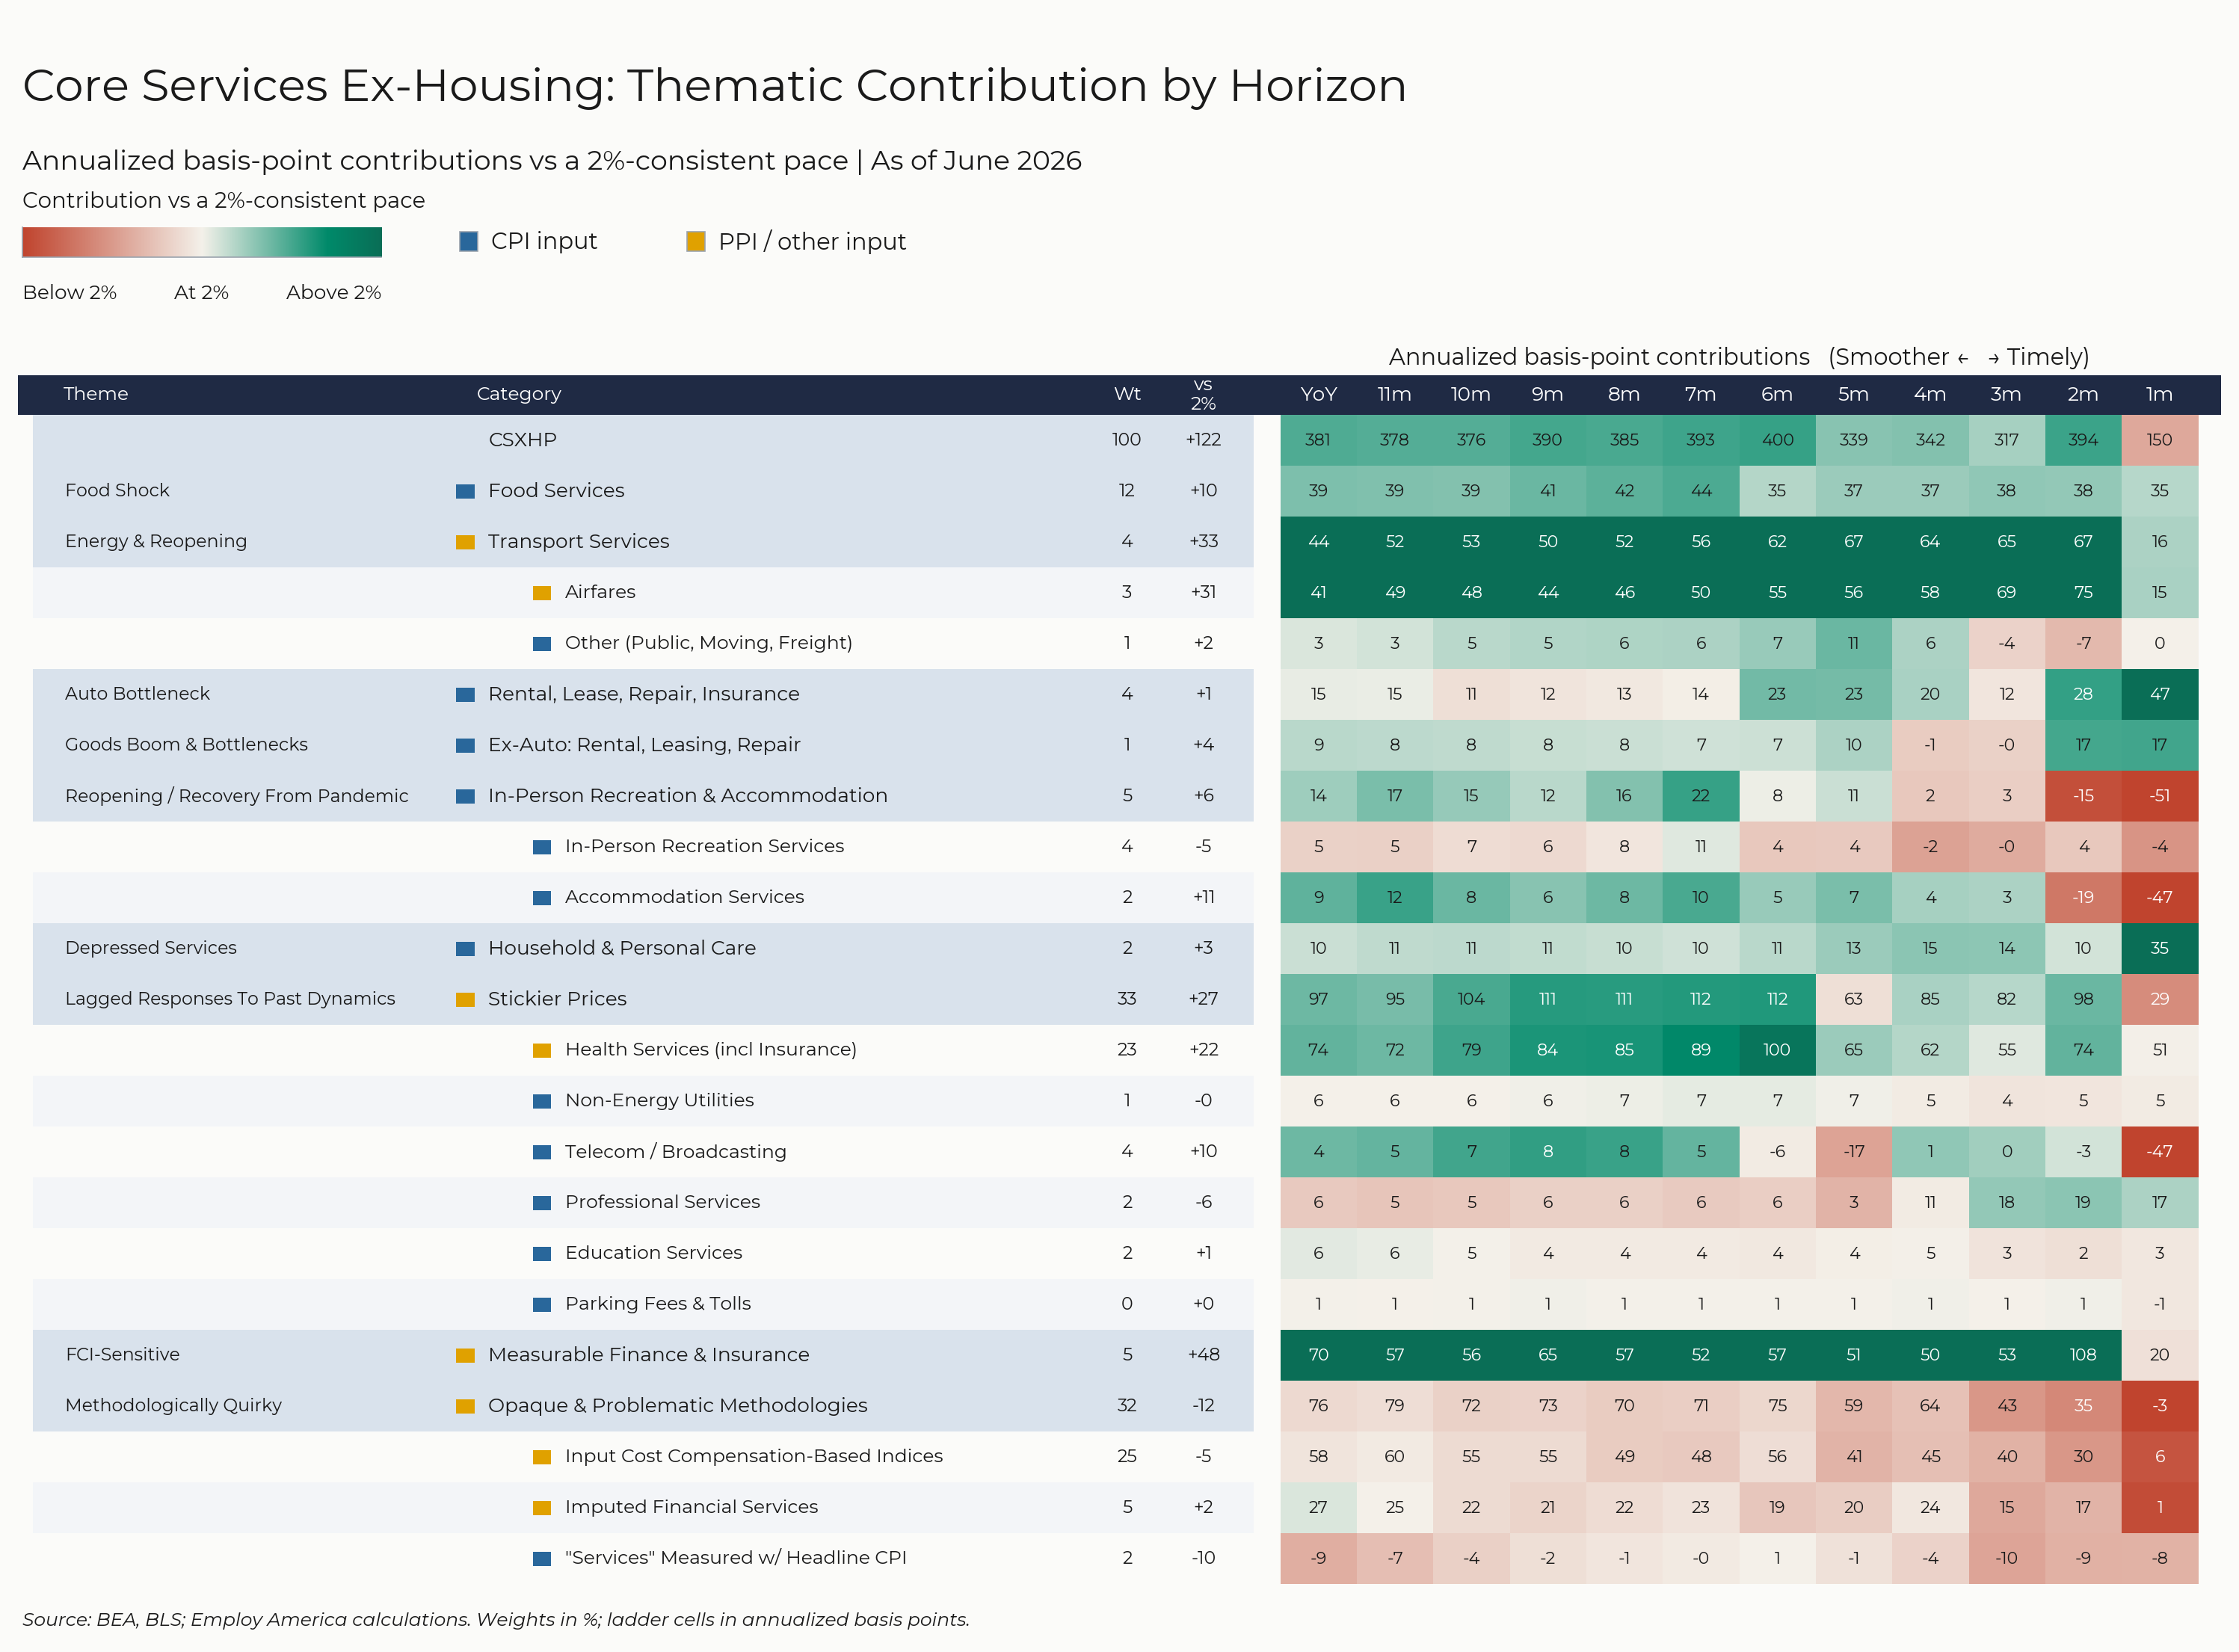
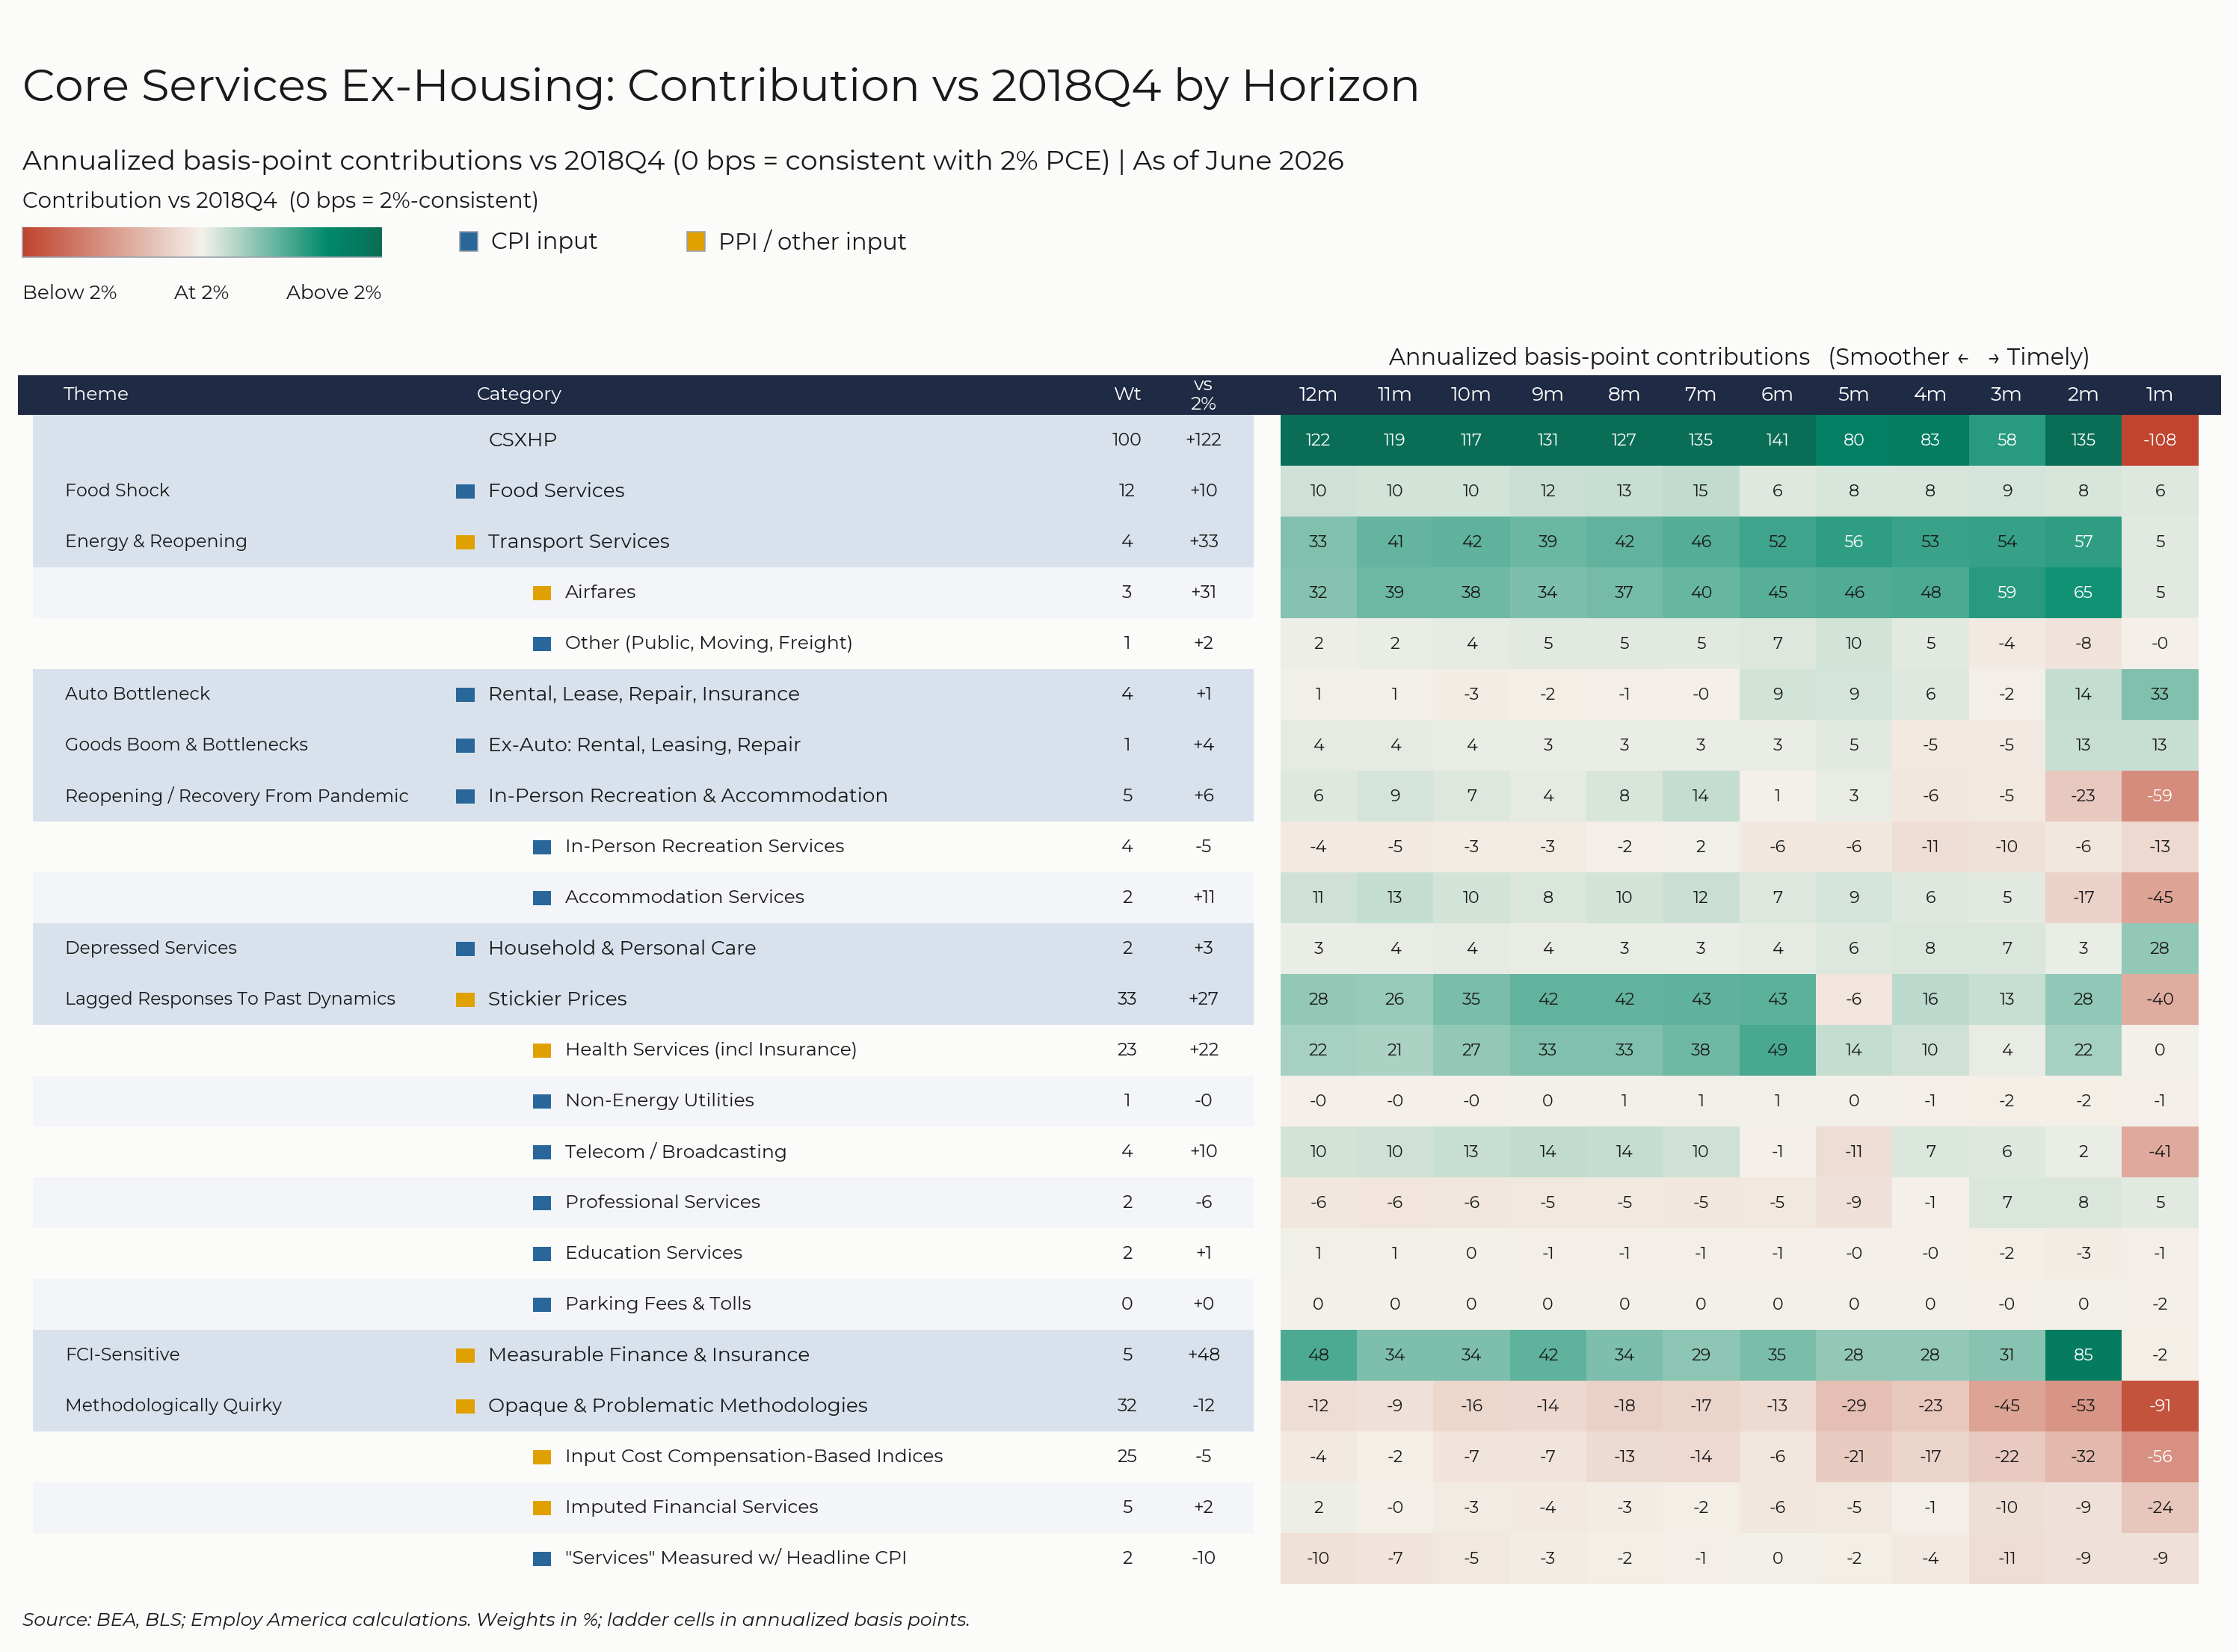
For the Detail-Oriented: Core Services Ex-Housing PCE Heatmaps
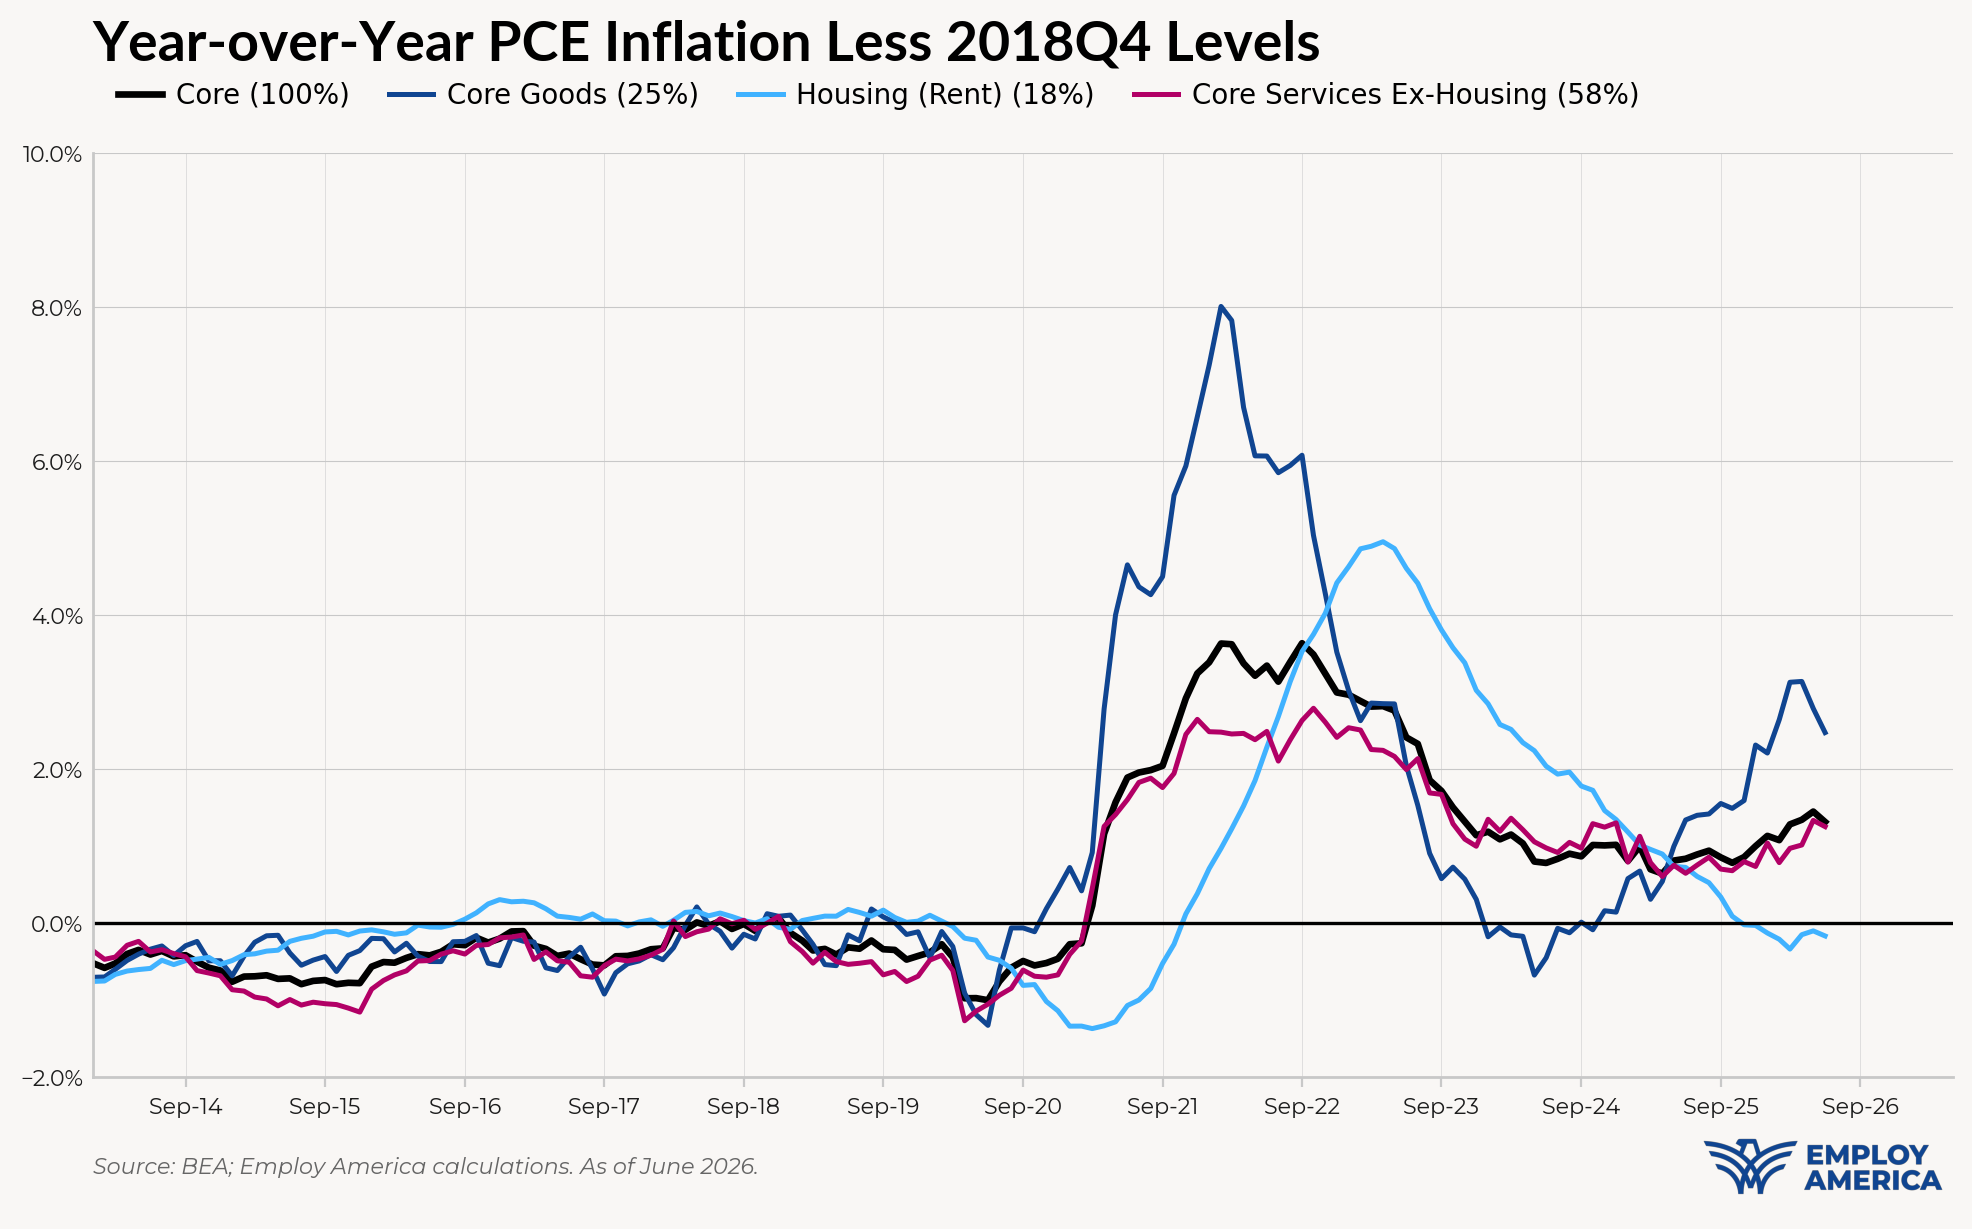
The June growth rate in "Core Services Ex-Housing" ('Supercore') PCE is running at a 3.81% year-over-year pace, a 122 basis point overshoot versus the ~2.59% run rate that coincided with ~2% Headline and Core PCE inflation.
The June monthly Supercore is running at a 1.50% annualized rate, a 109 basis point annualized undershoot of what would be consistent with 2% Headline and Core PCE. These estimates are subject to revision as more data gets released (IPI, GDP, PCE).
The link has been copied!
Your link has expired. Please request a new one.
Your link has expired. Please request a new one.
Your link has expired. Please request a new one.
Great! You've successfully signed up.
Great! You've successfully signed up.
Welcome back! You've successfully signed in.
Success! You now have access to additional content.