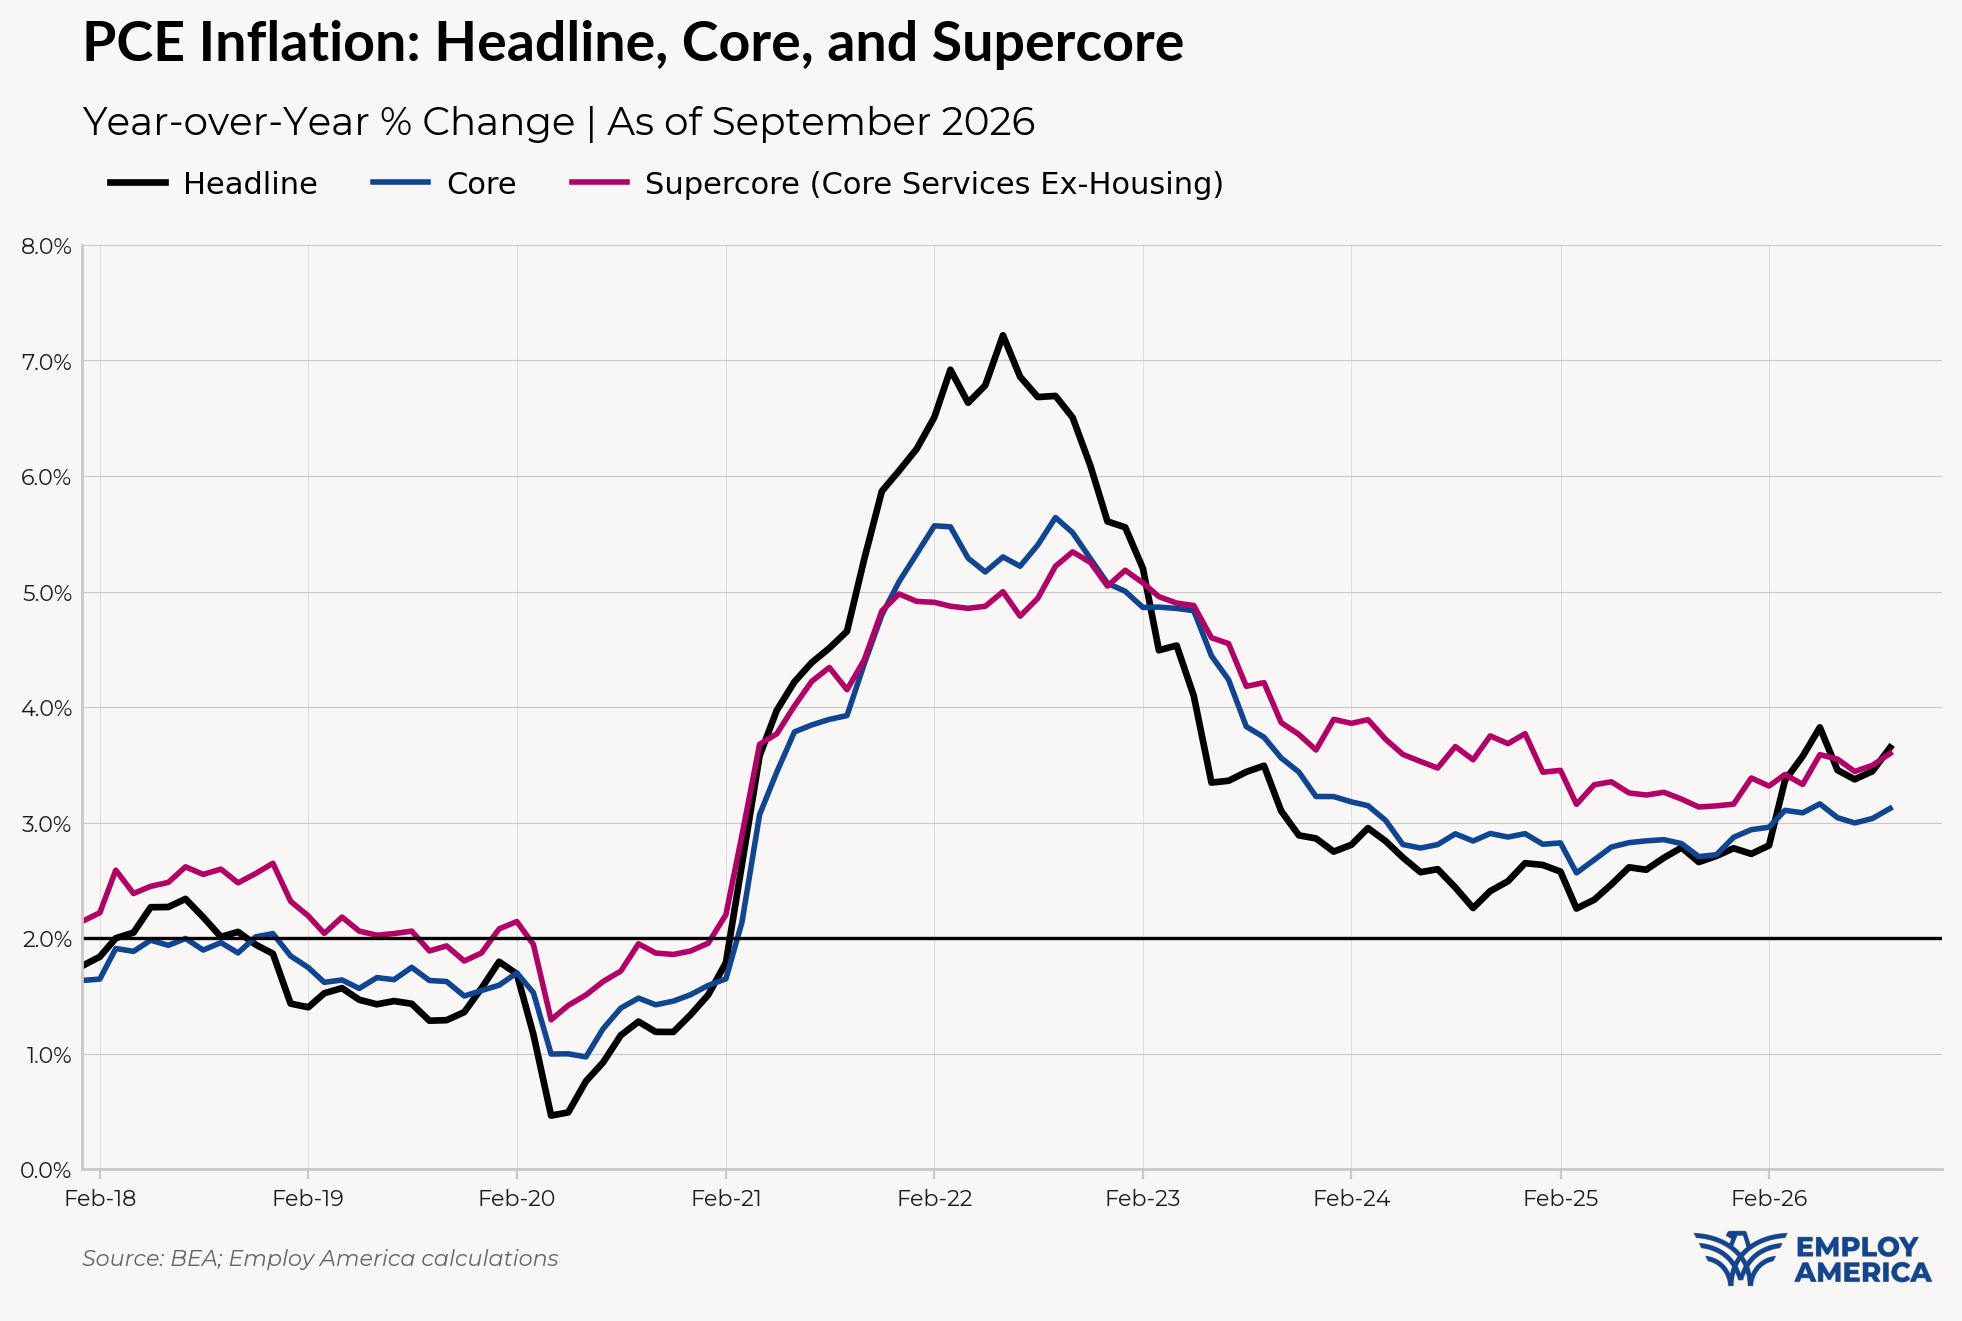
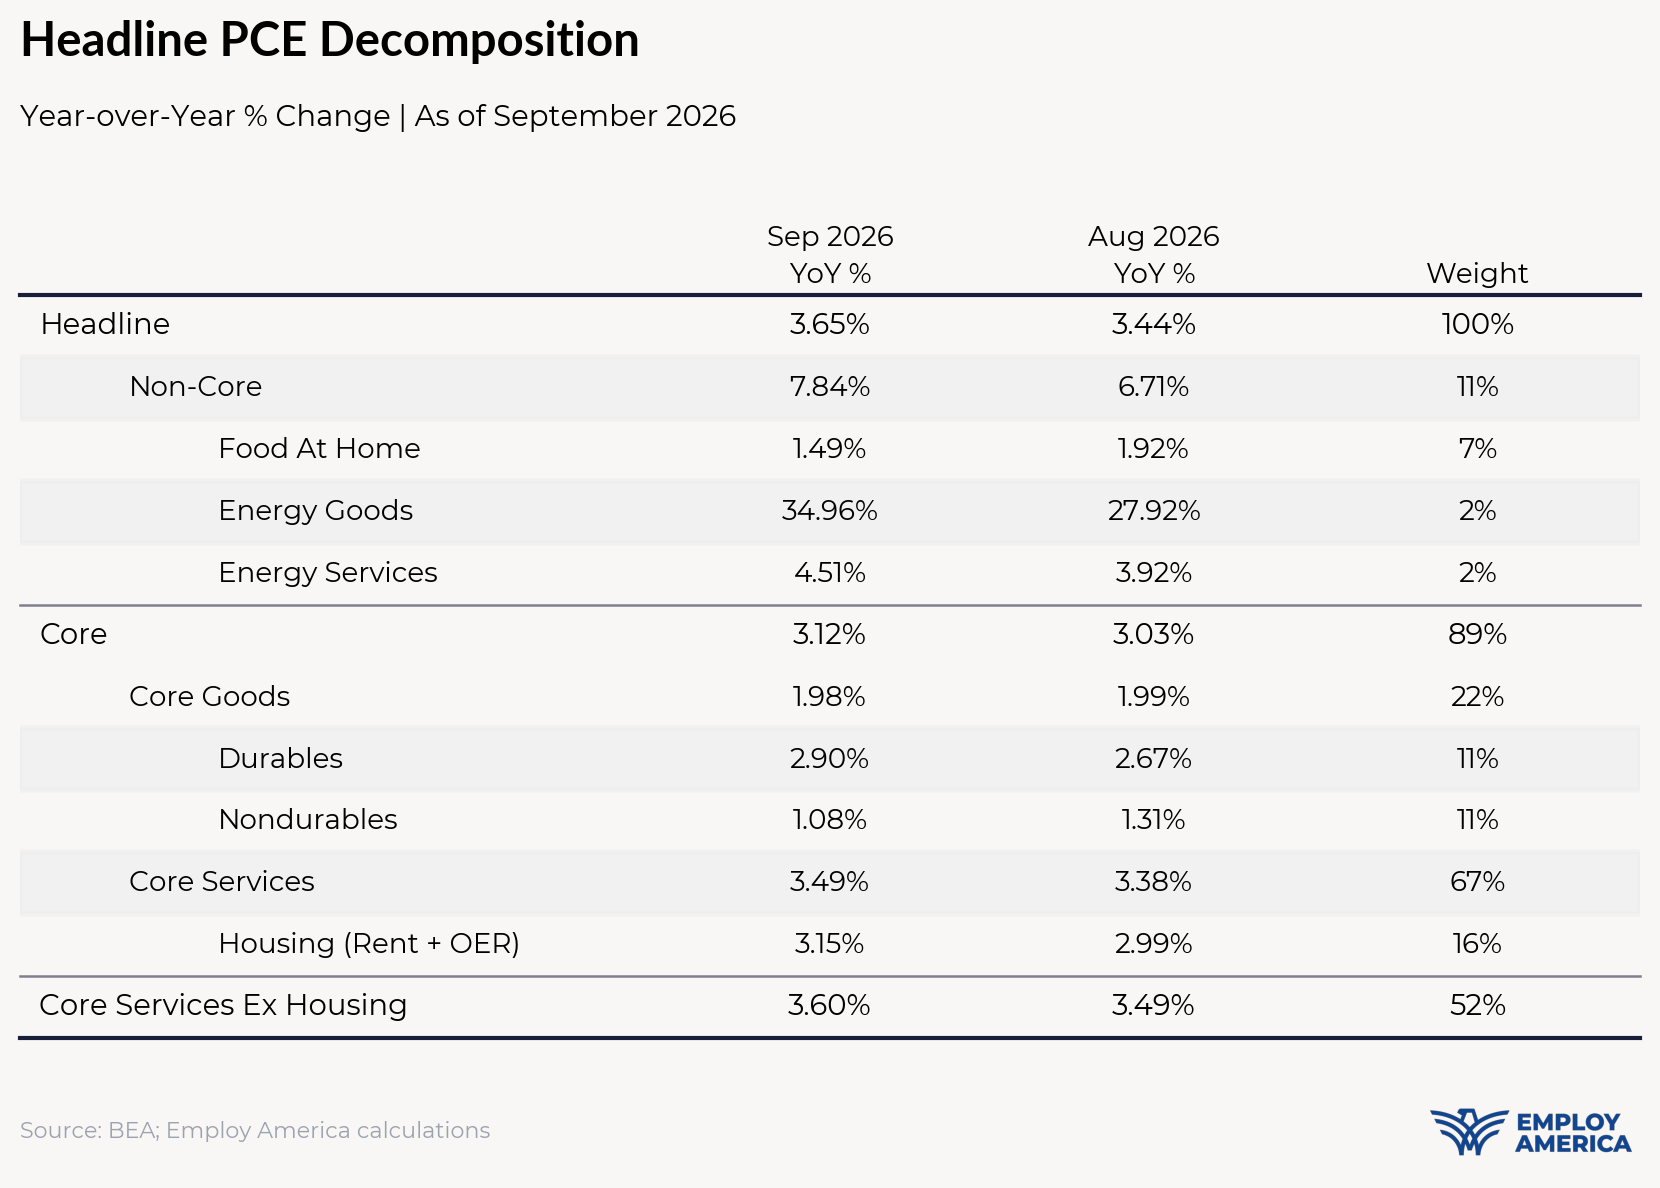
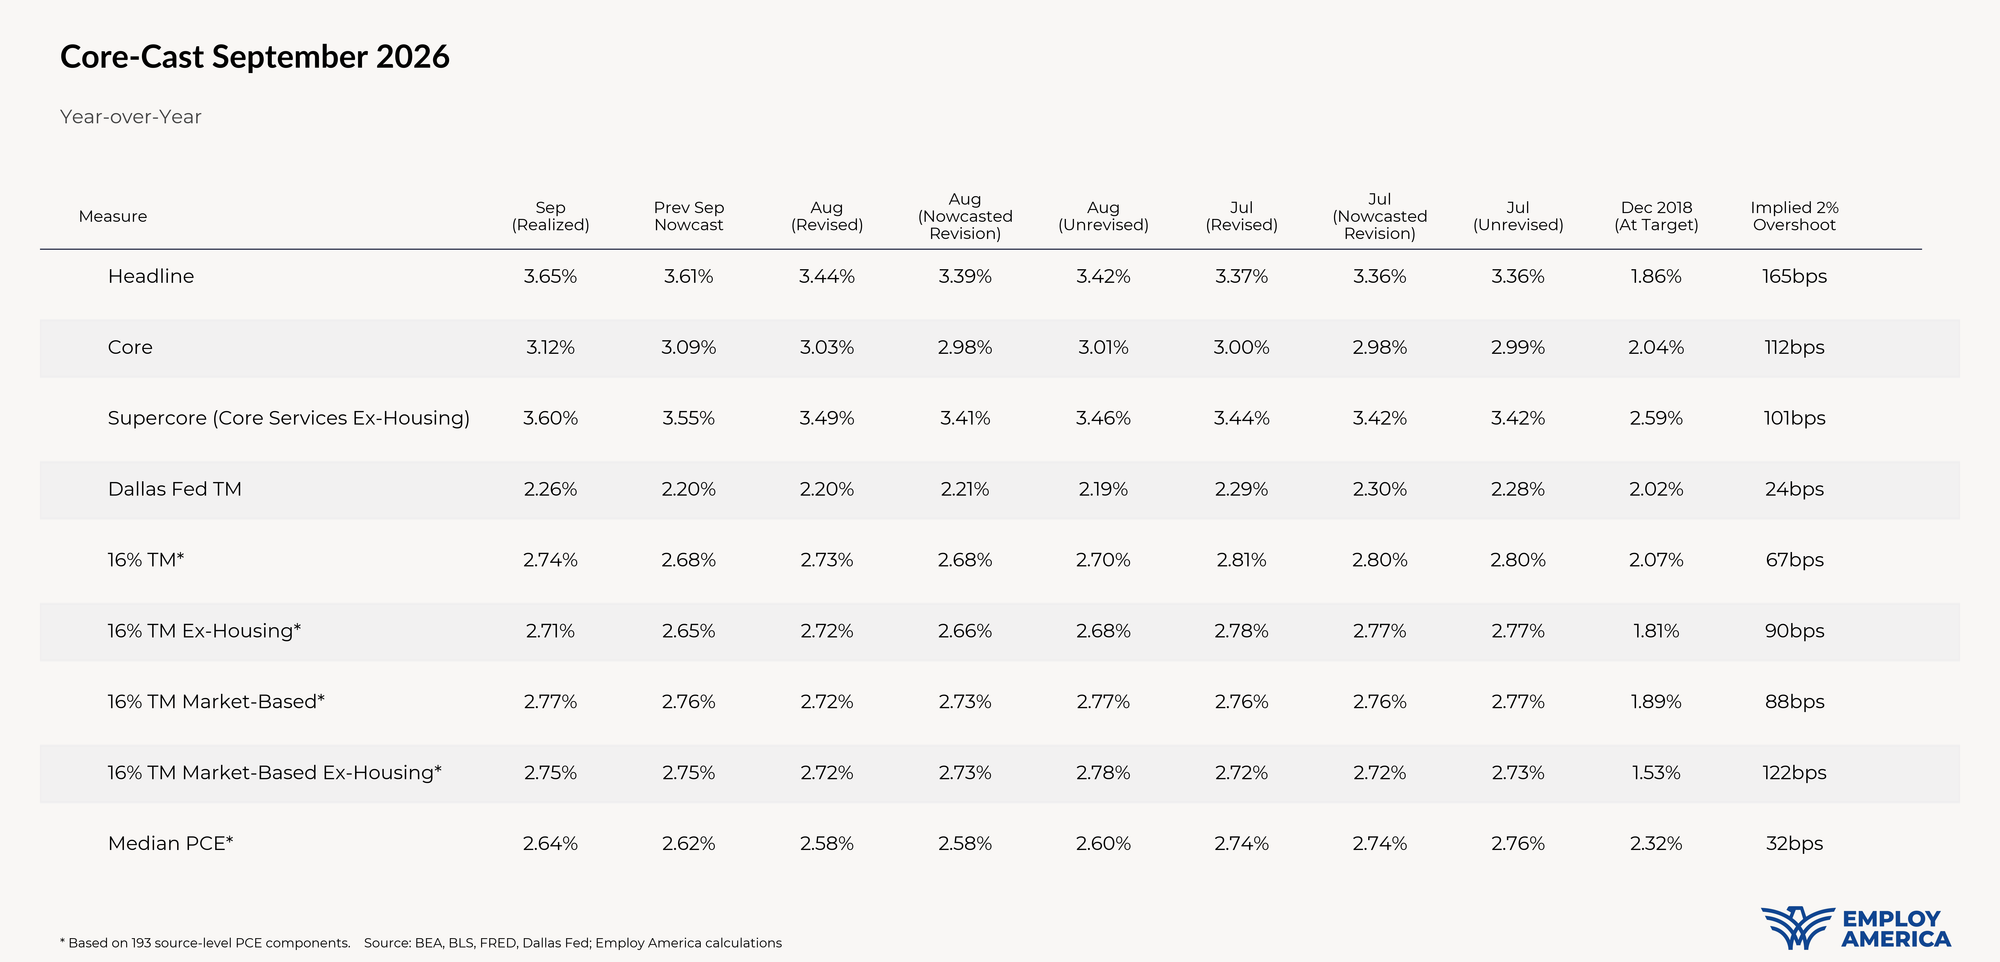
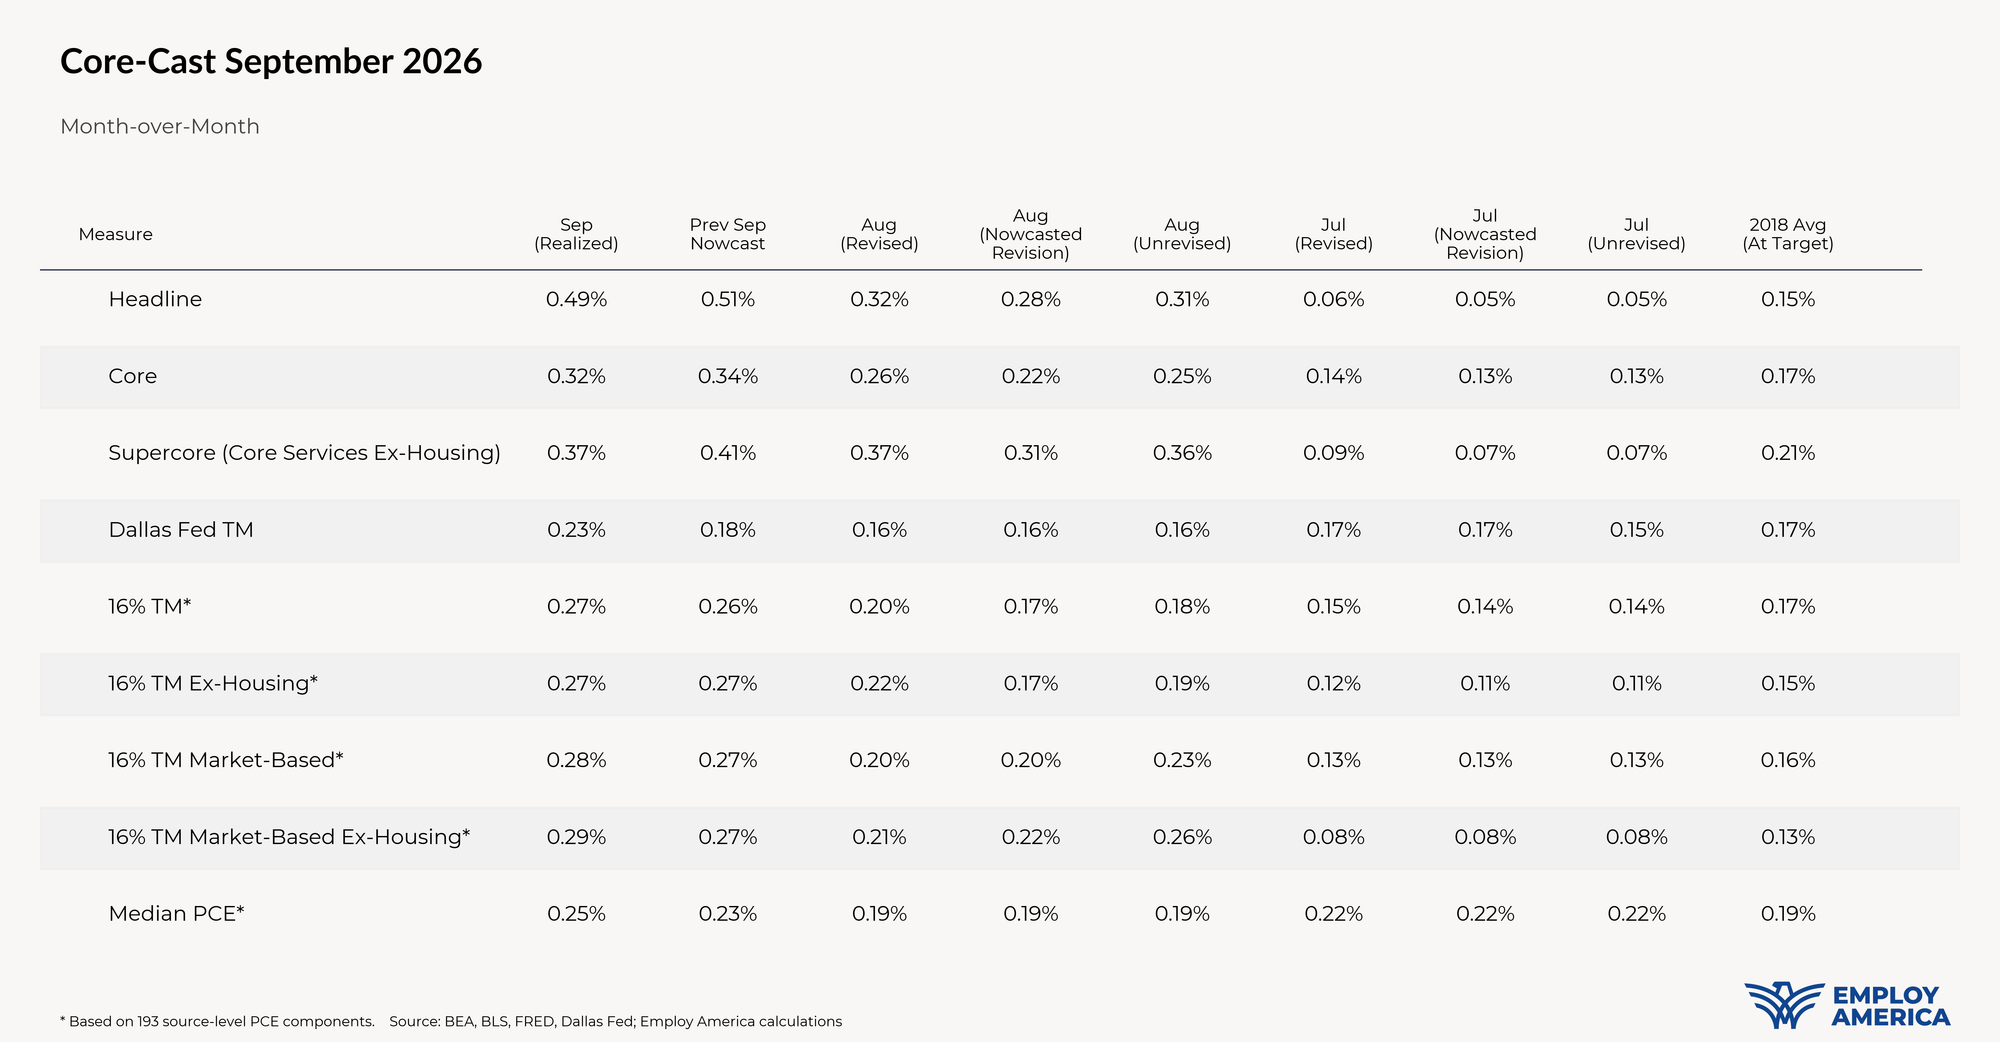
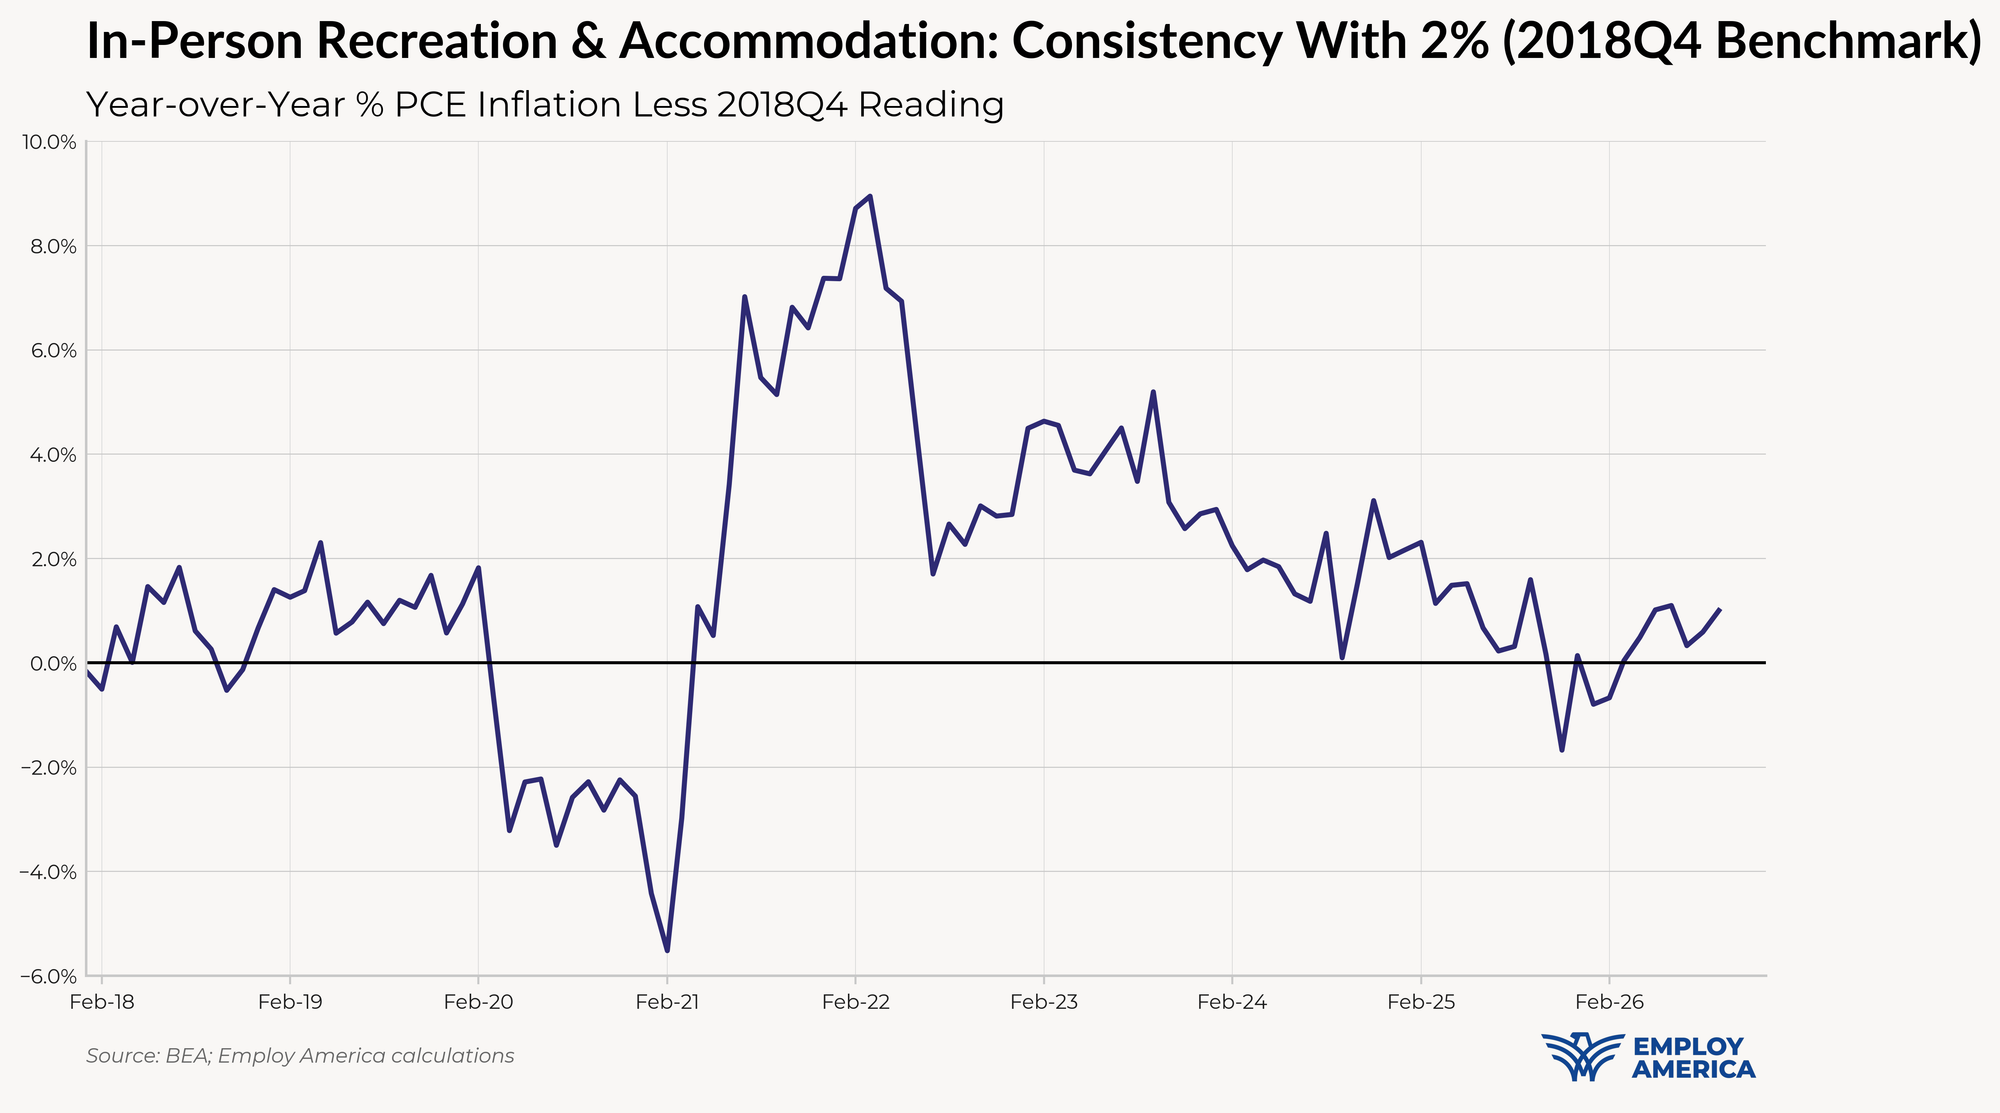
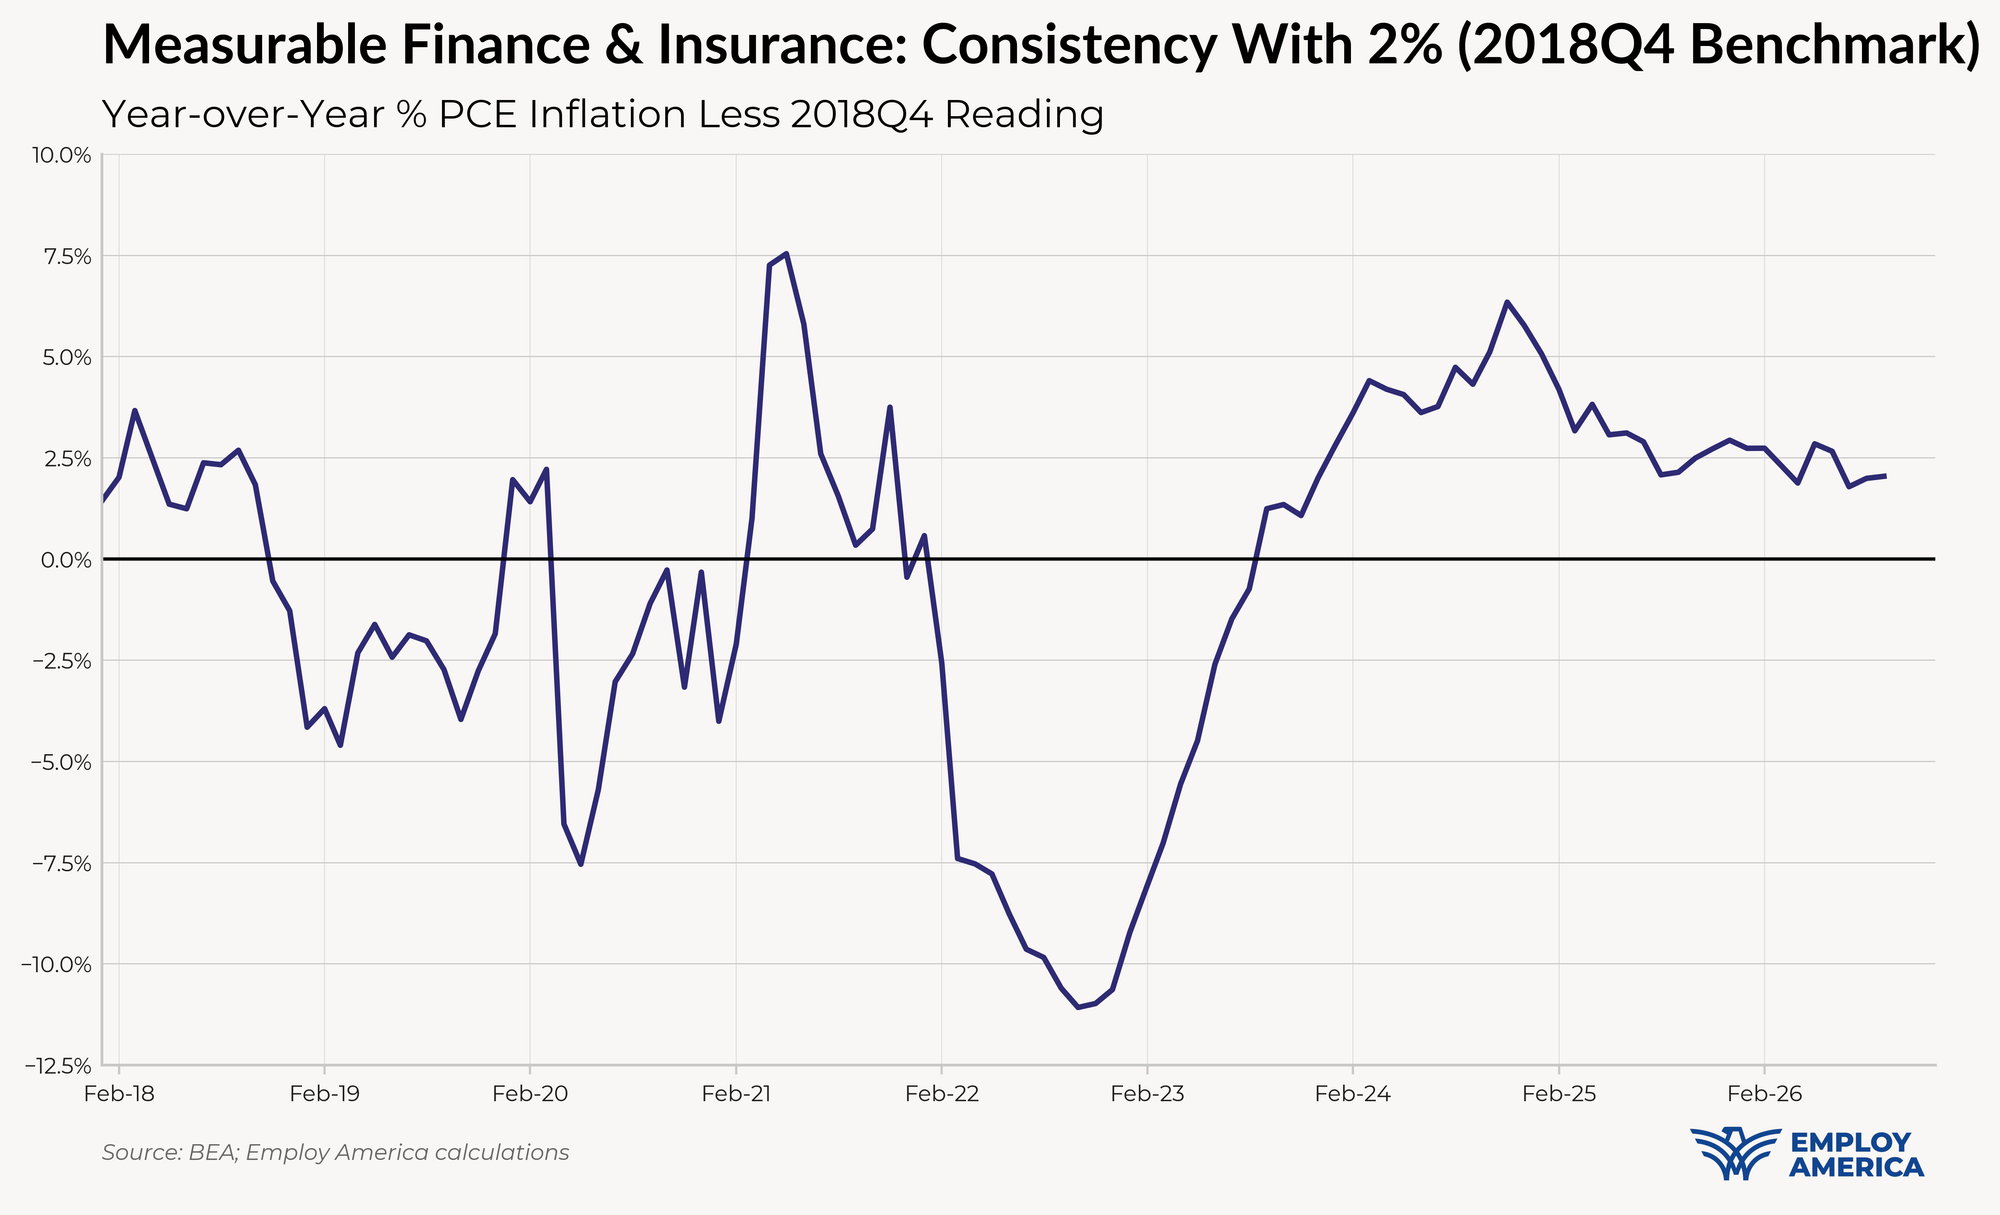
Month-over-month core PCE came in at +32bps (vs +34bps nowcast) while the year-over-year core PCE reading came in at +3.09% (vs +3.12% nowcast). Overall, this print firms up the odds of a December hike.
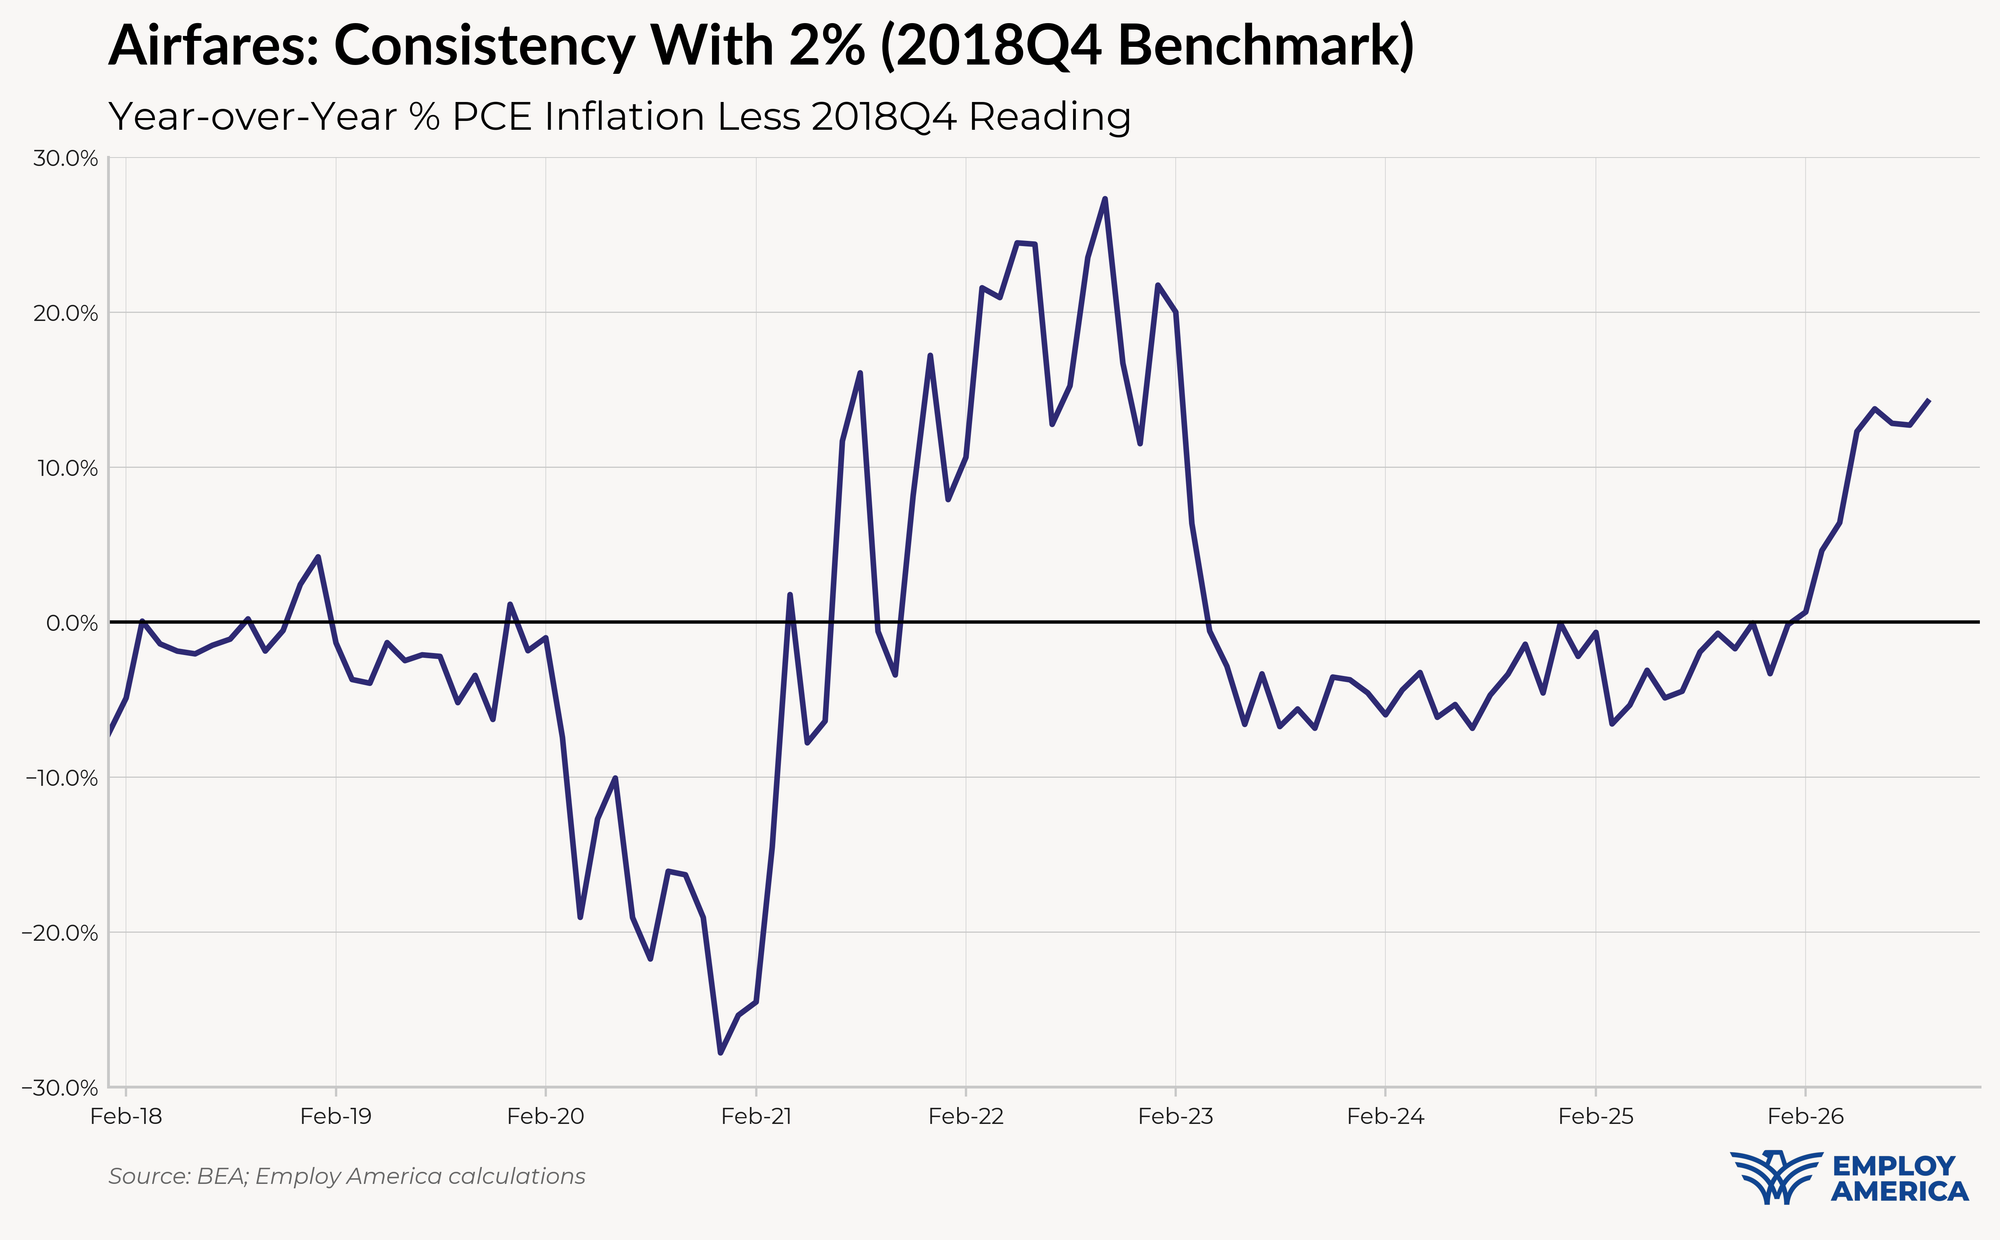
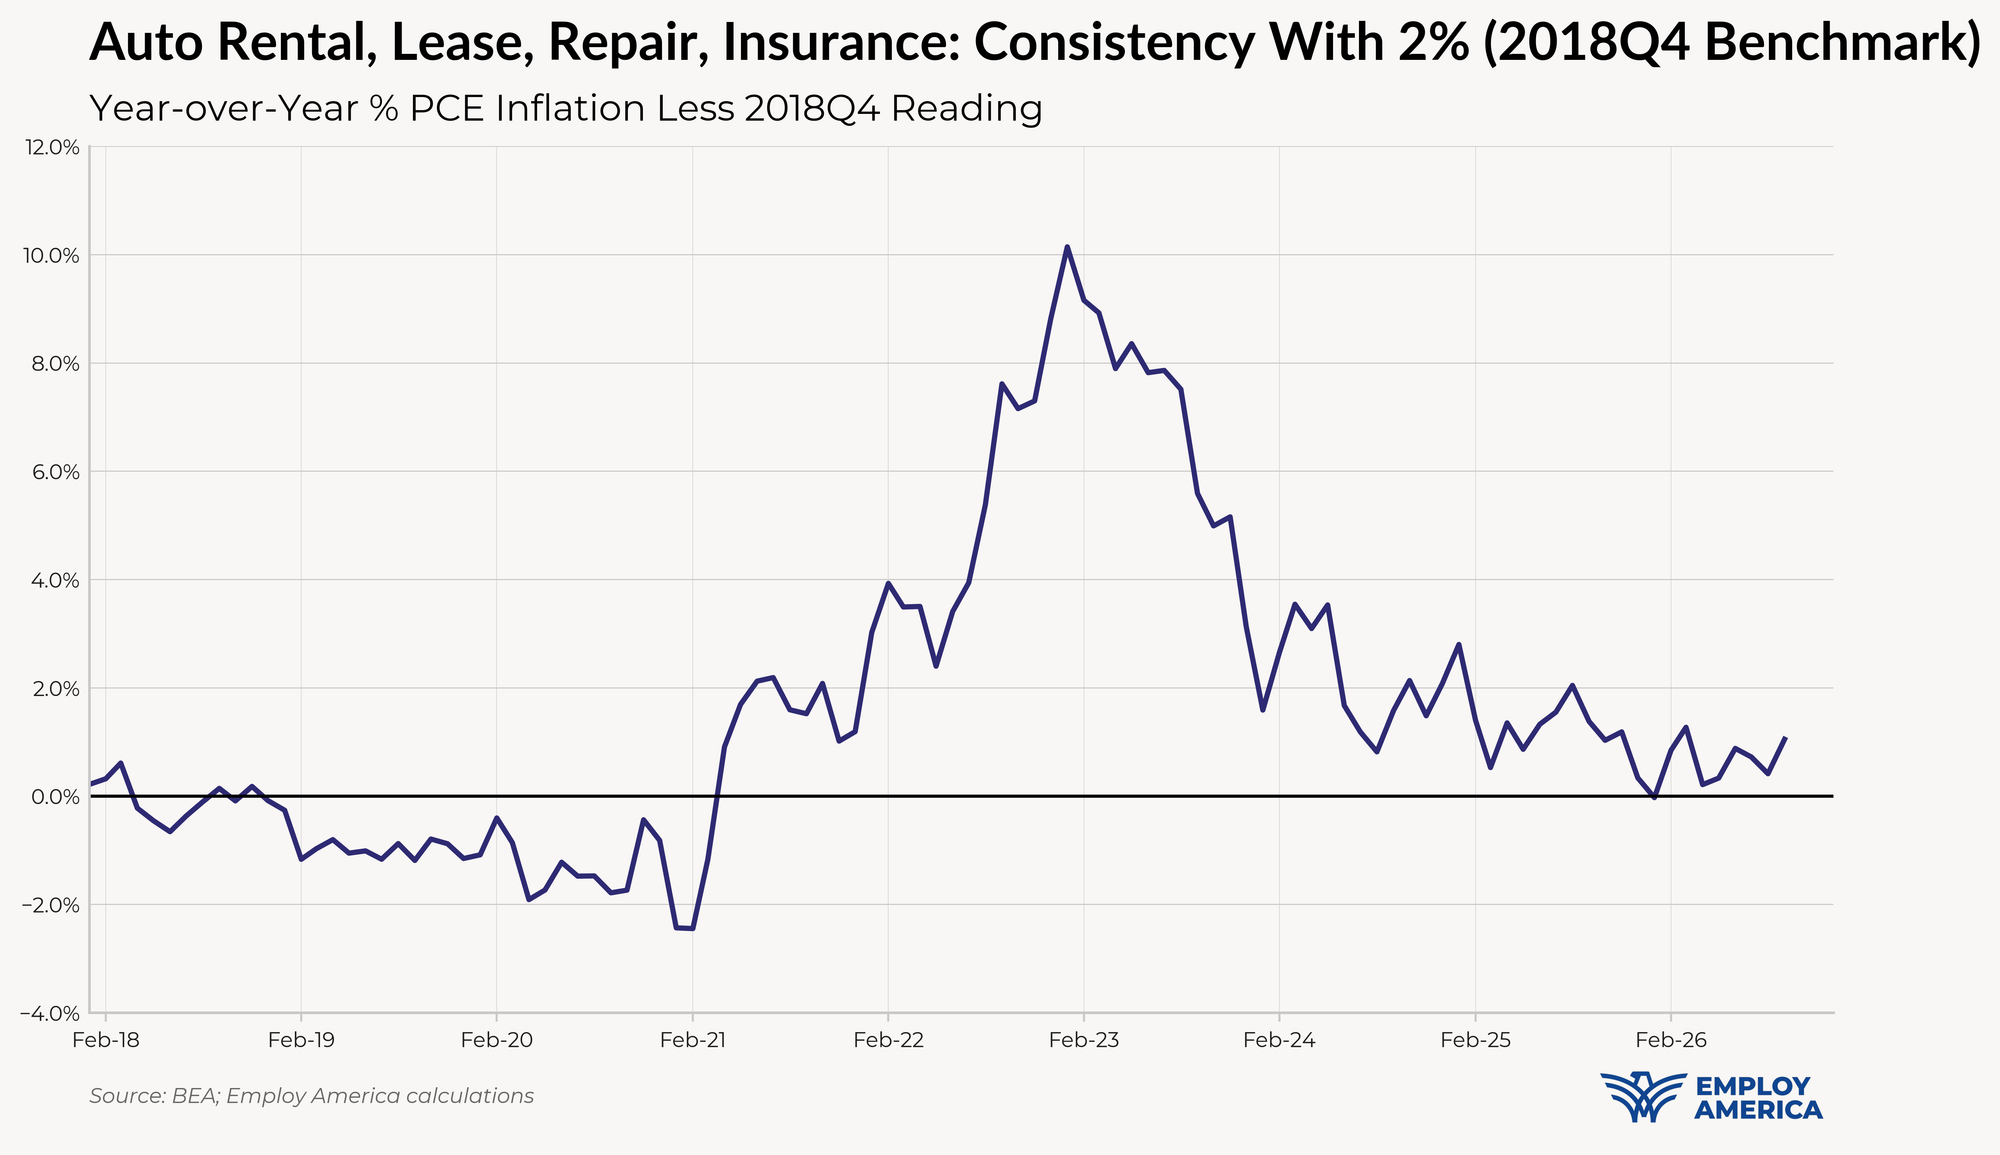
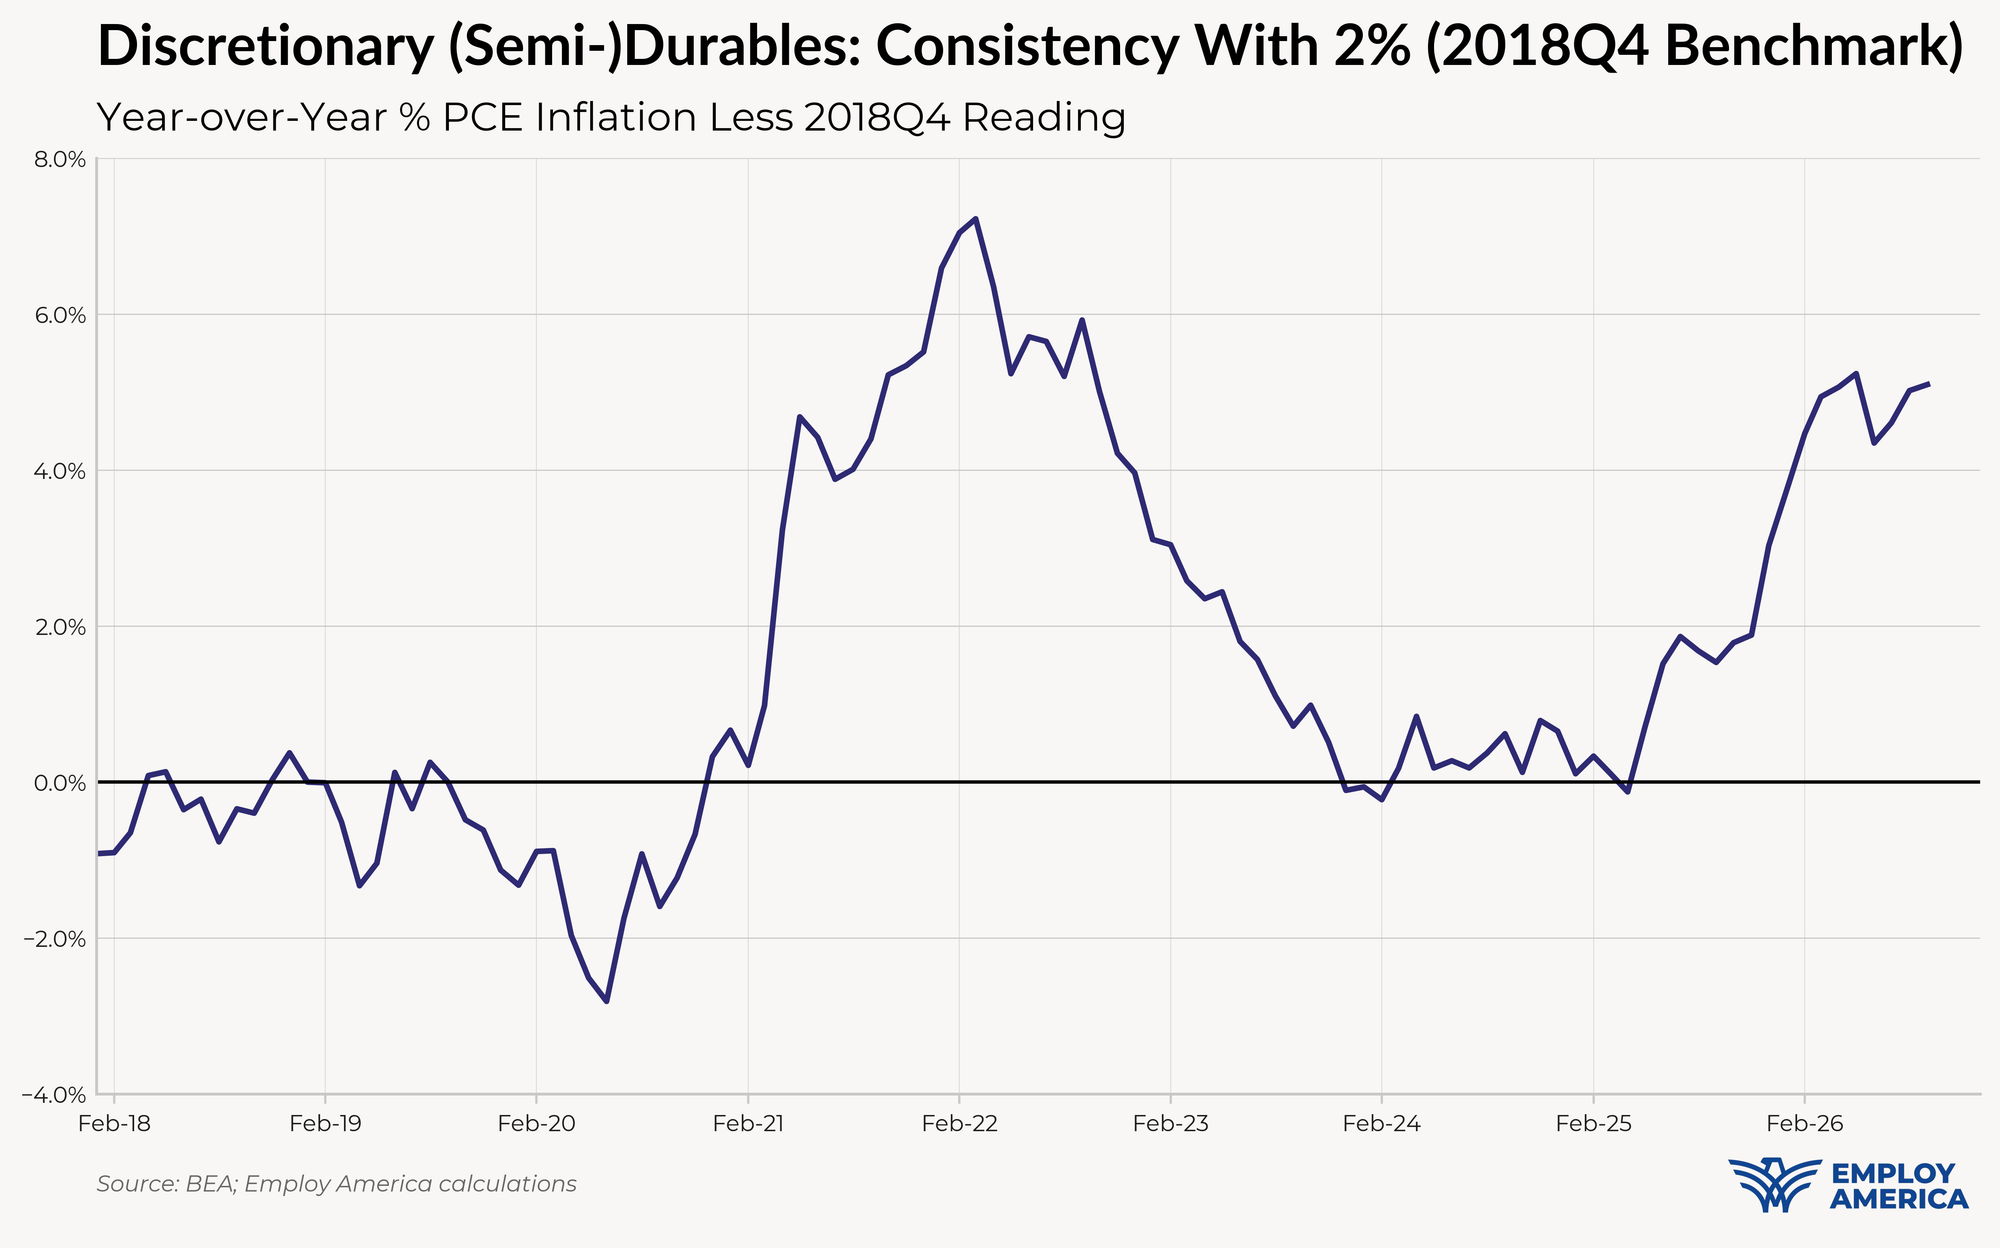
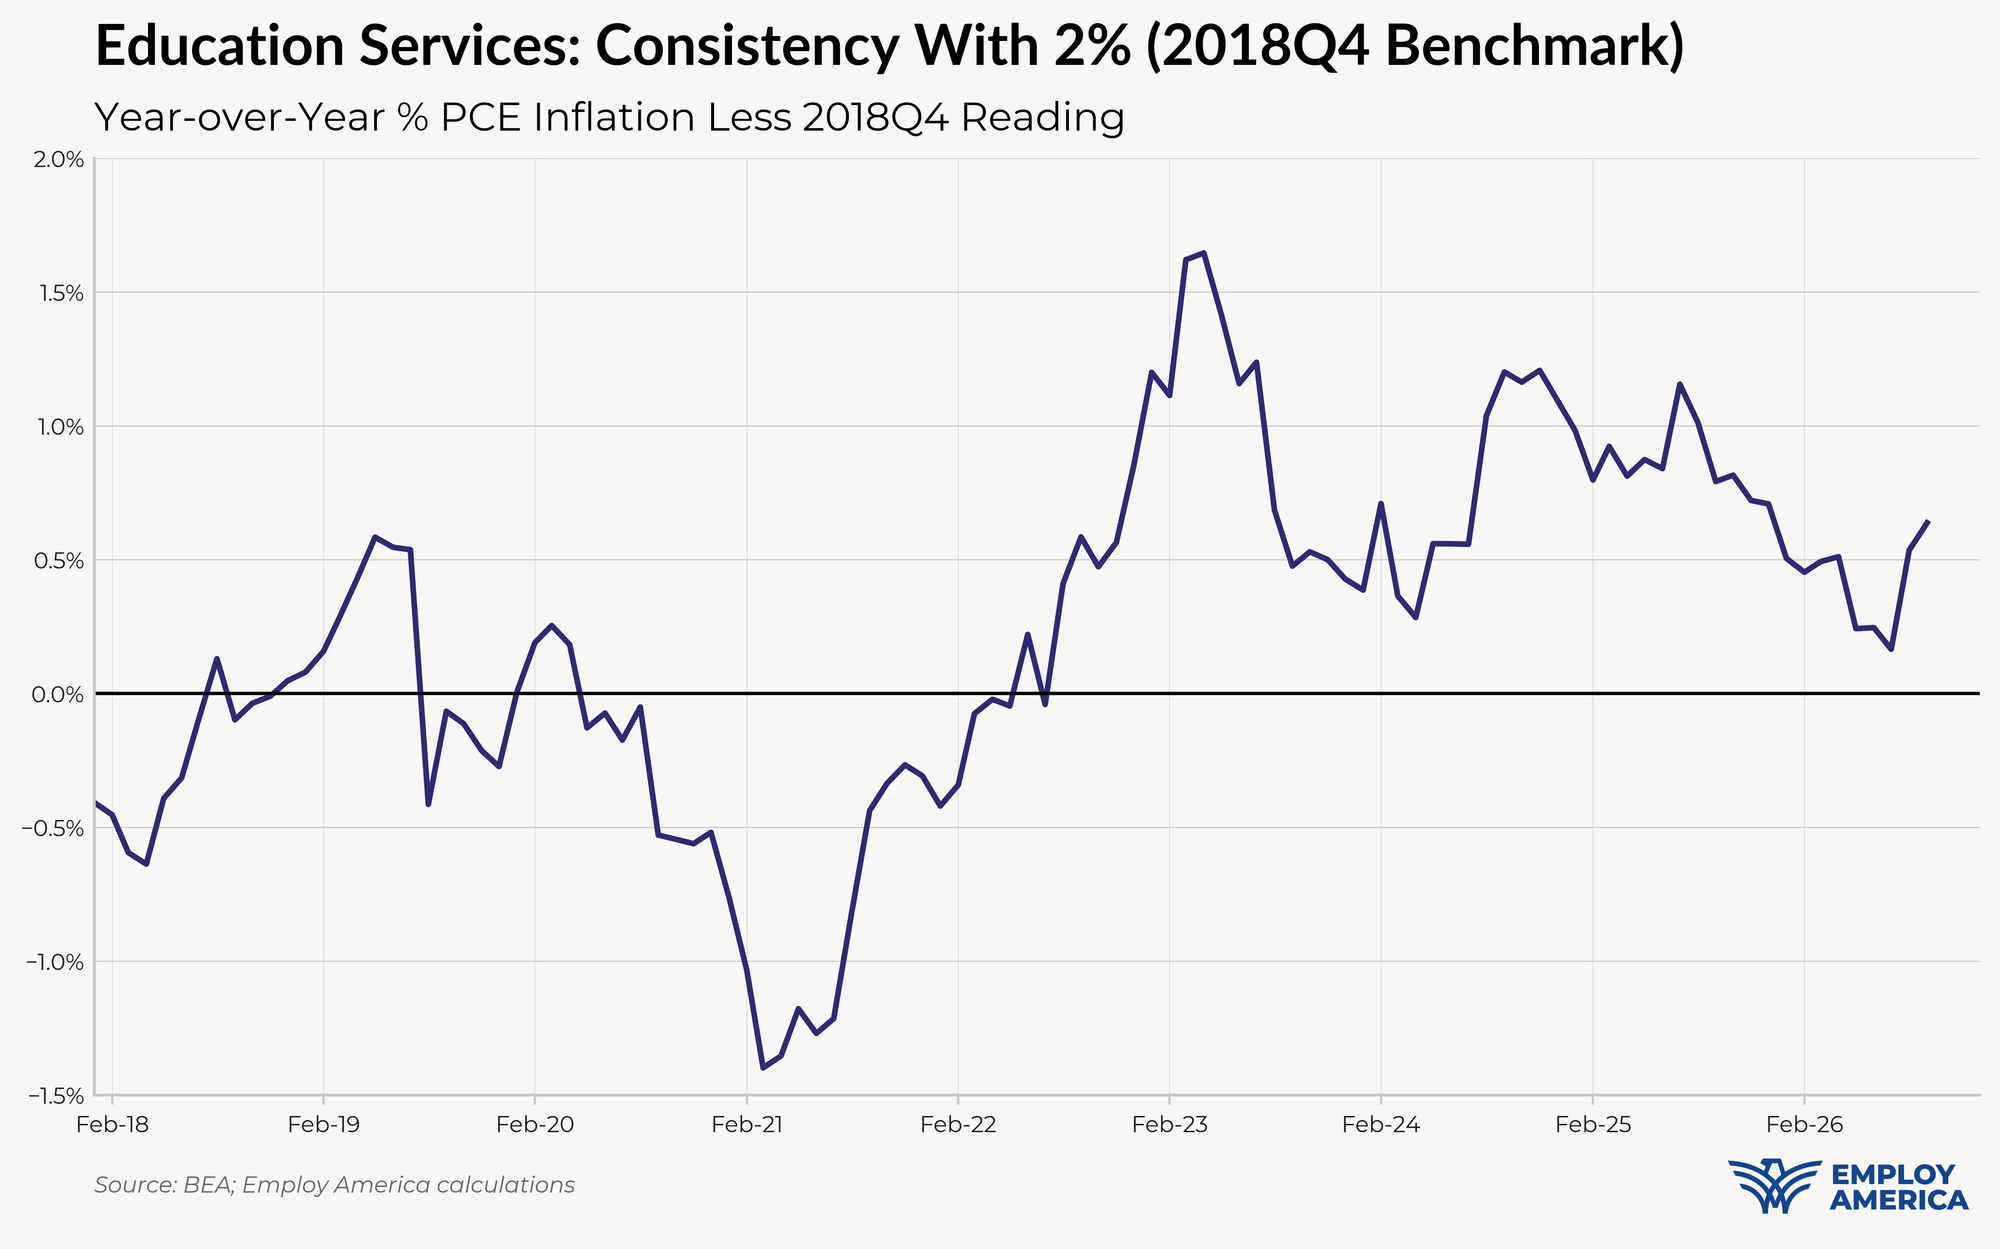
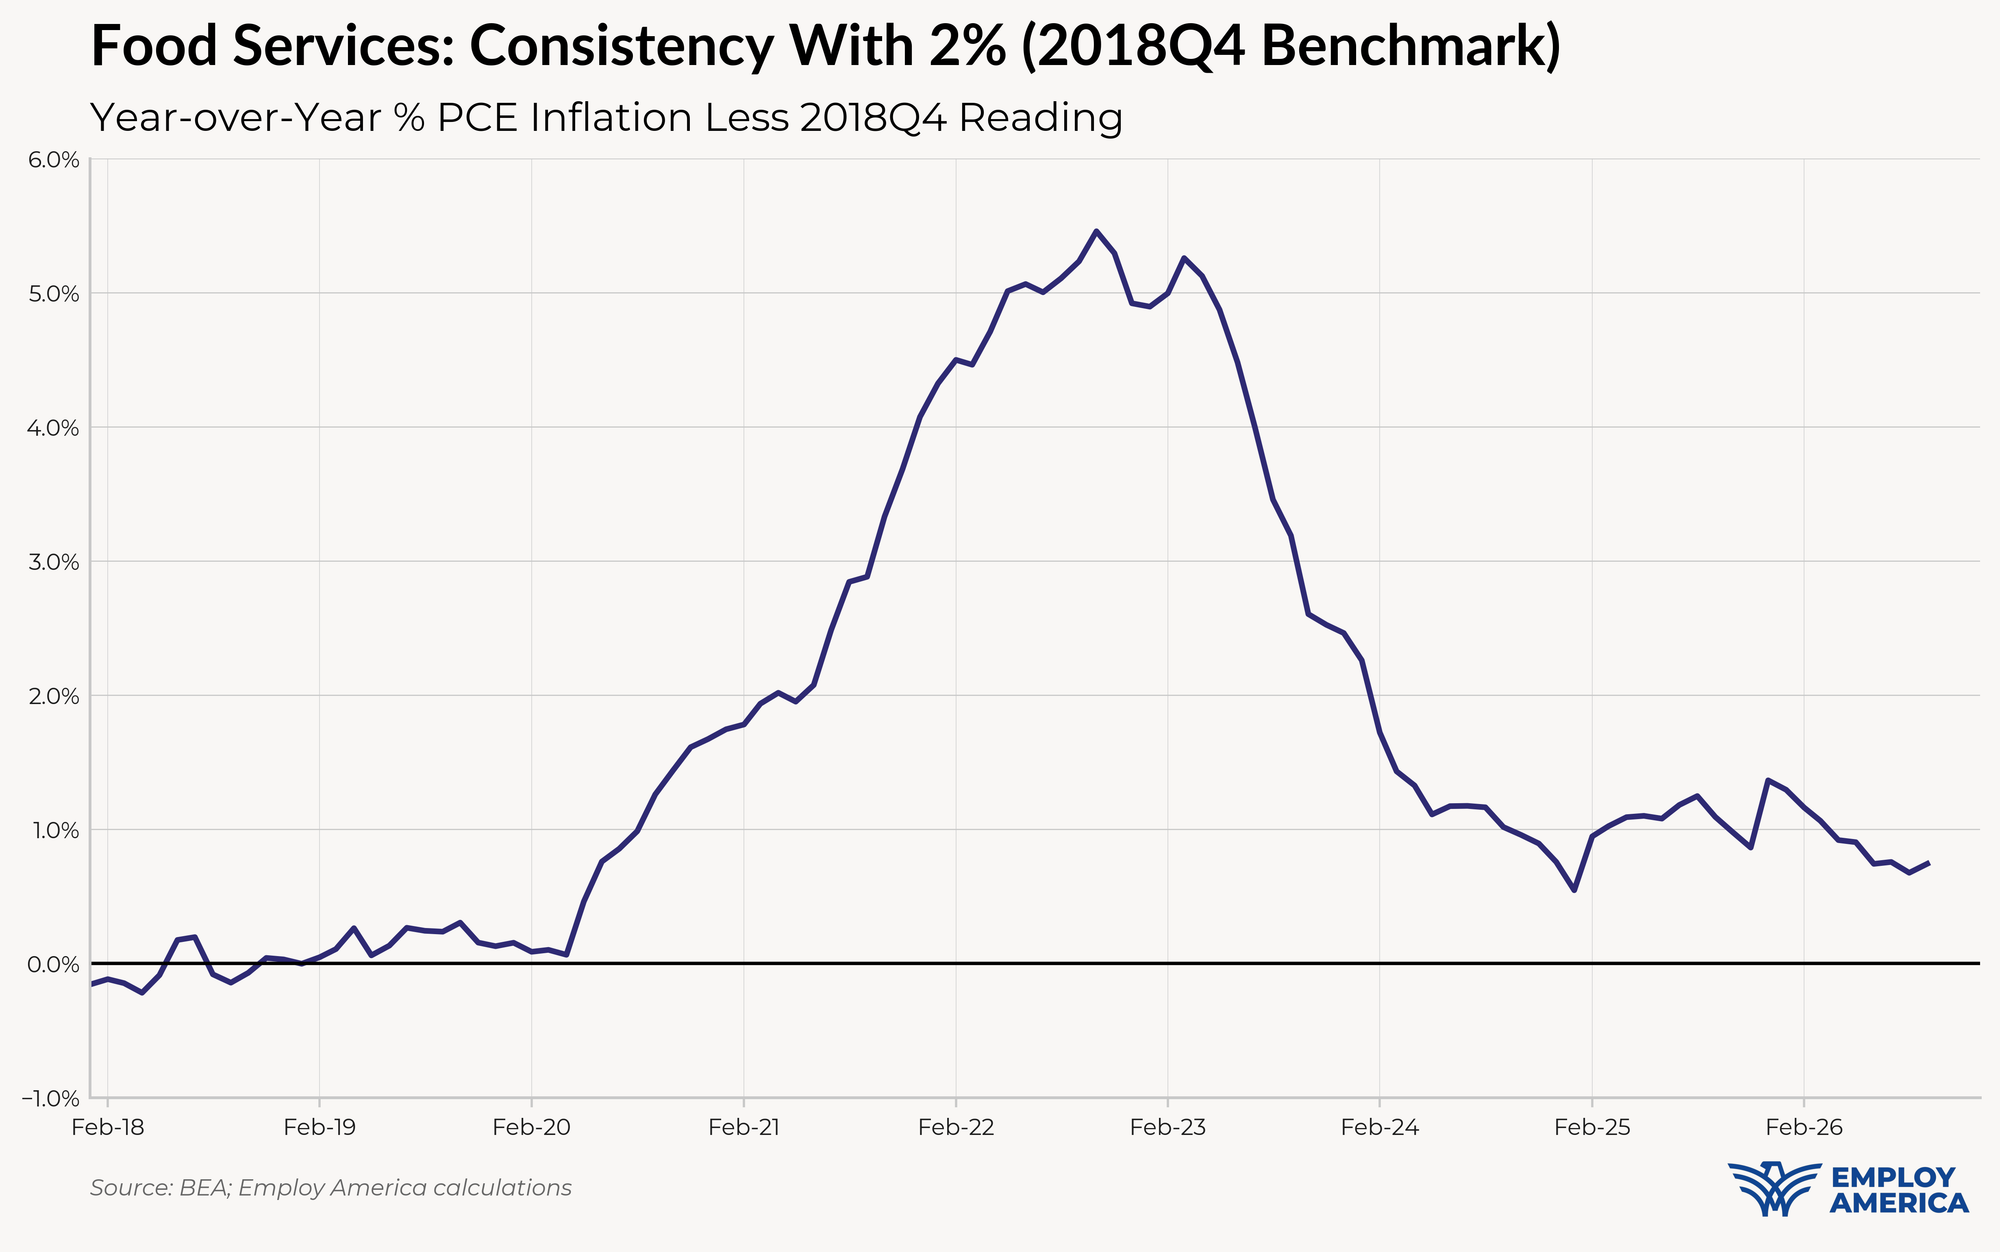
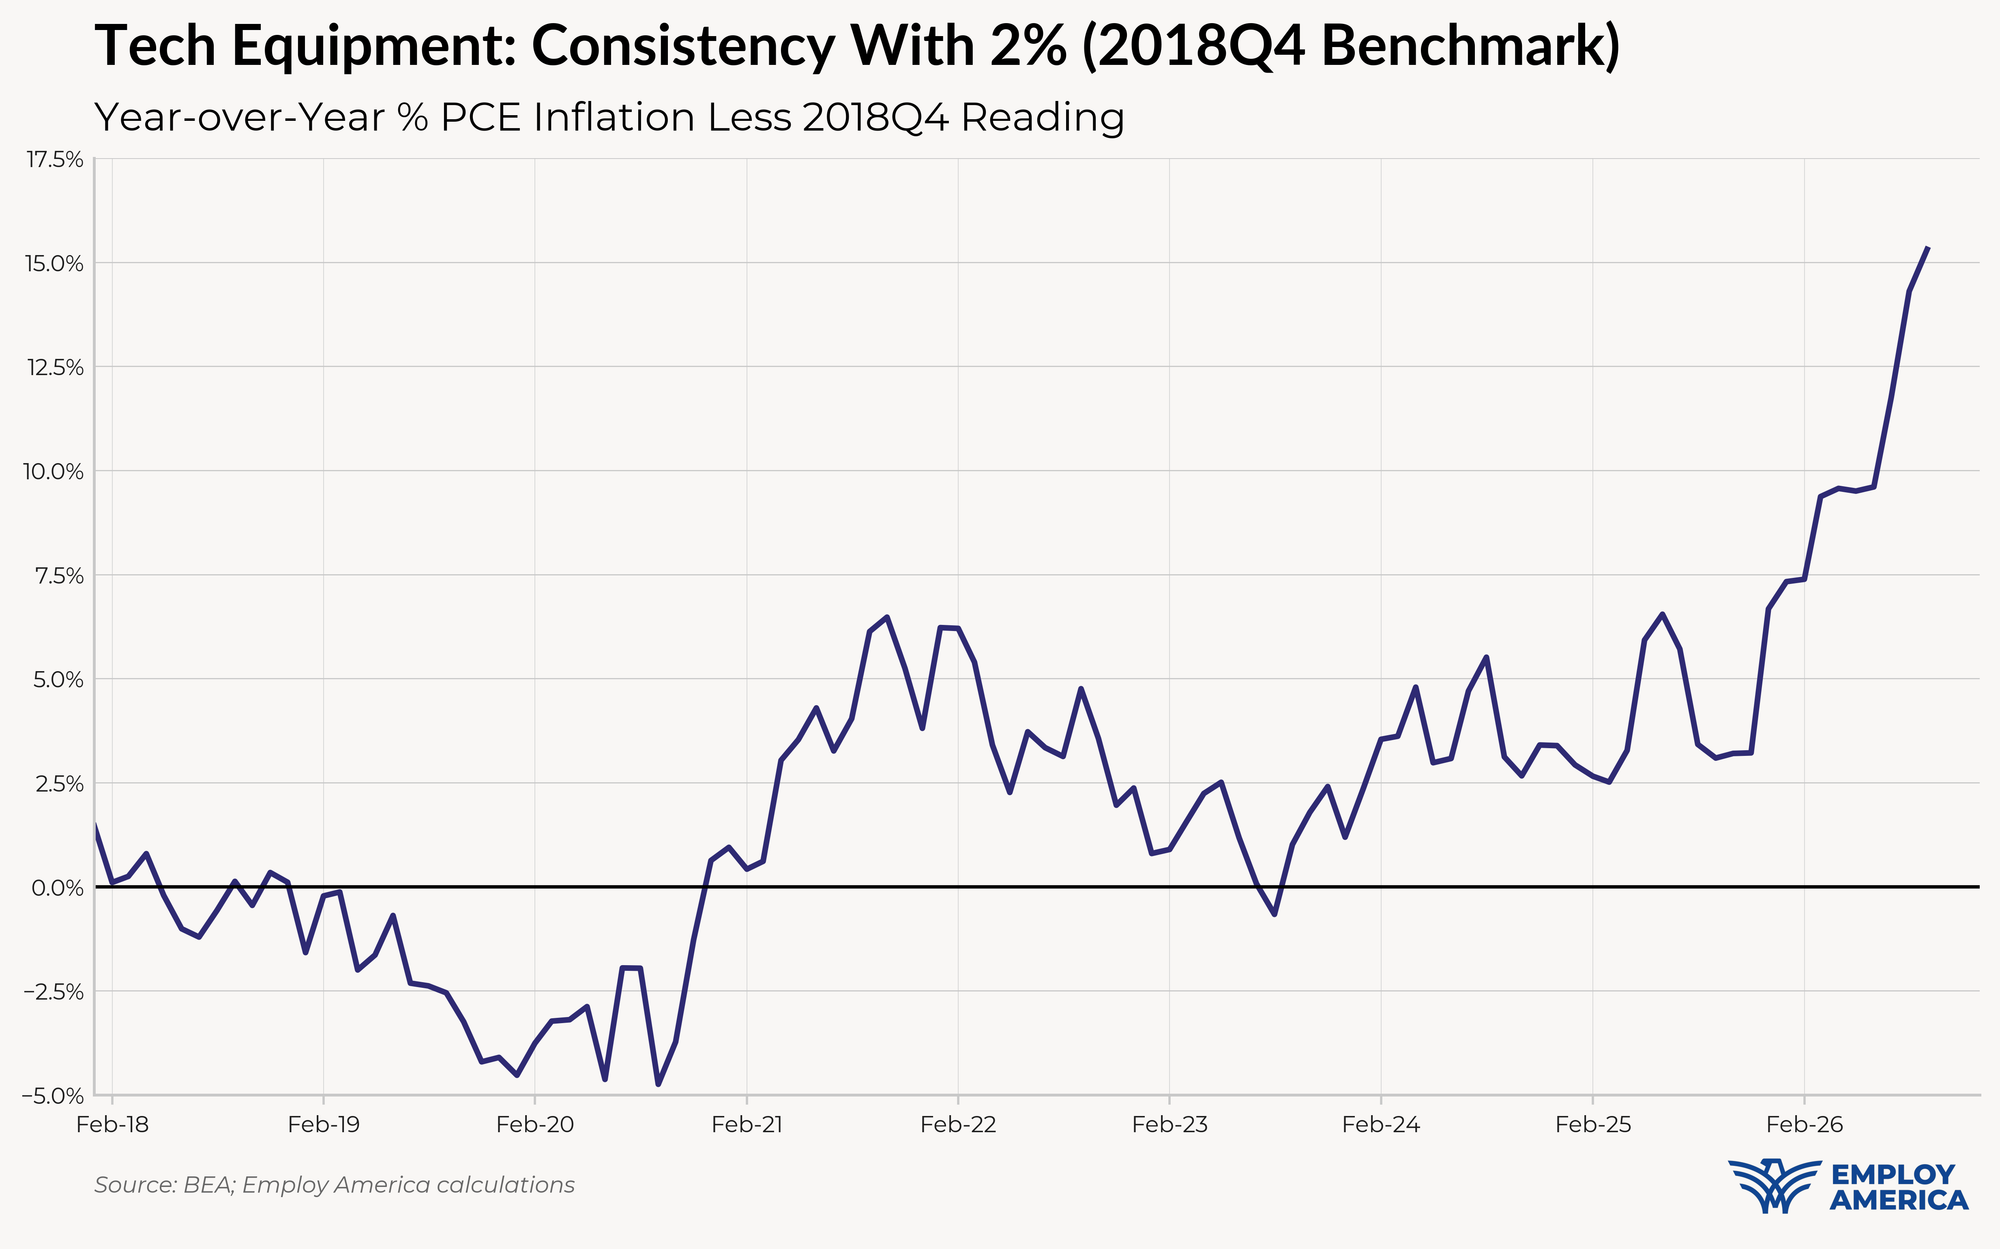
The upside we anticipated for airfares materialized. The smaller upside we flagged for apparel, vehicles, and recreational goods also materialized, with recreational goods coming in firmer than we expected. Tech equipment was mixed, but we expect more upside in October as price increases on legacy consumer electronic models show up in the CPI data. The upside we saw in food services and wireless services did not materialize, but that could change over the coming months. MacroSuite subscribers will receive a detailed October inflation preview next week.
Our miss on the August revision was driven by the opaque category "final consumption expenditures of nonprofit institutions serving households (NPISH)," due to a revision BEA made to nonprofit hospital prices. BEA's first August print held nonprofit health and hospital output prices flat. In the revised data, nonprofit hospital output prices rose 0.38% m/m. That added about 3bps to m/m core and 5bps to m/m supercore, more than offsetting the downward revisions we had anticipated.
Trimmed Mean & Other Summary Gauges
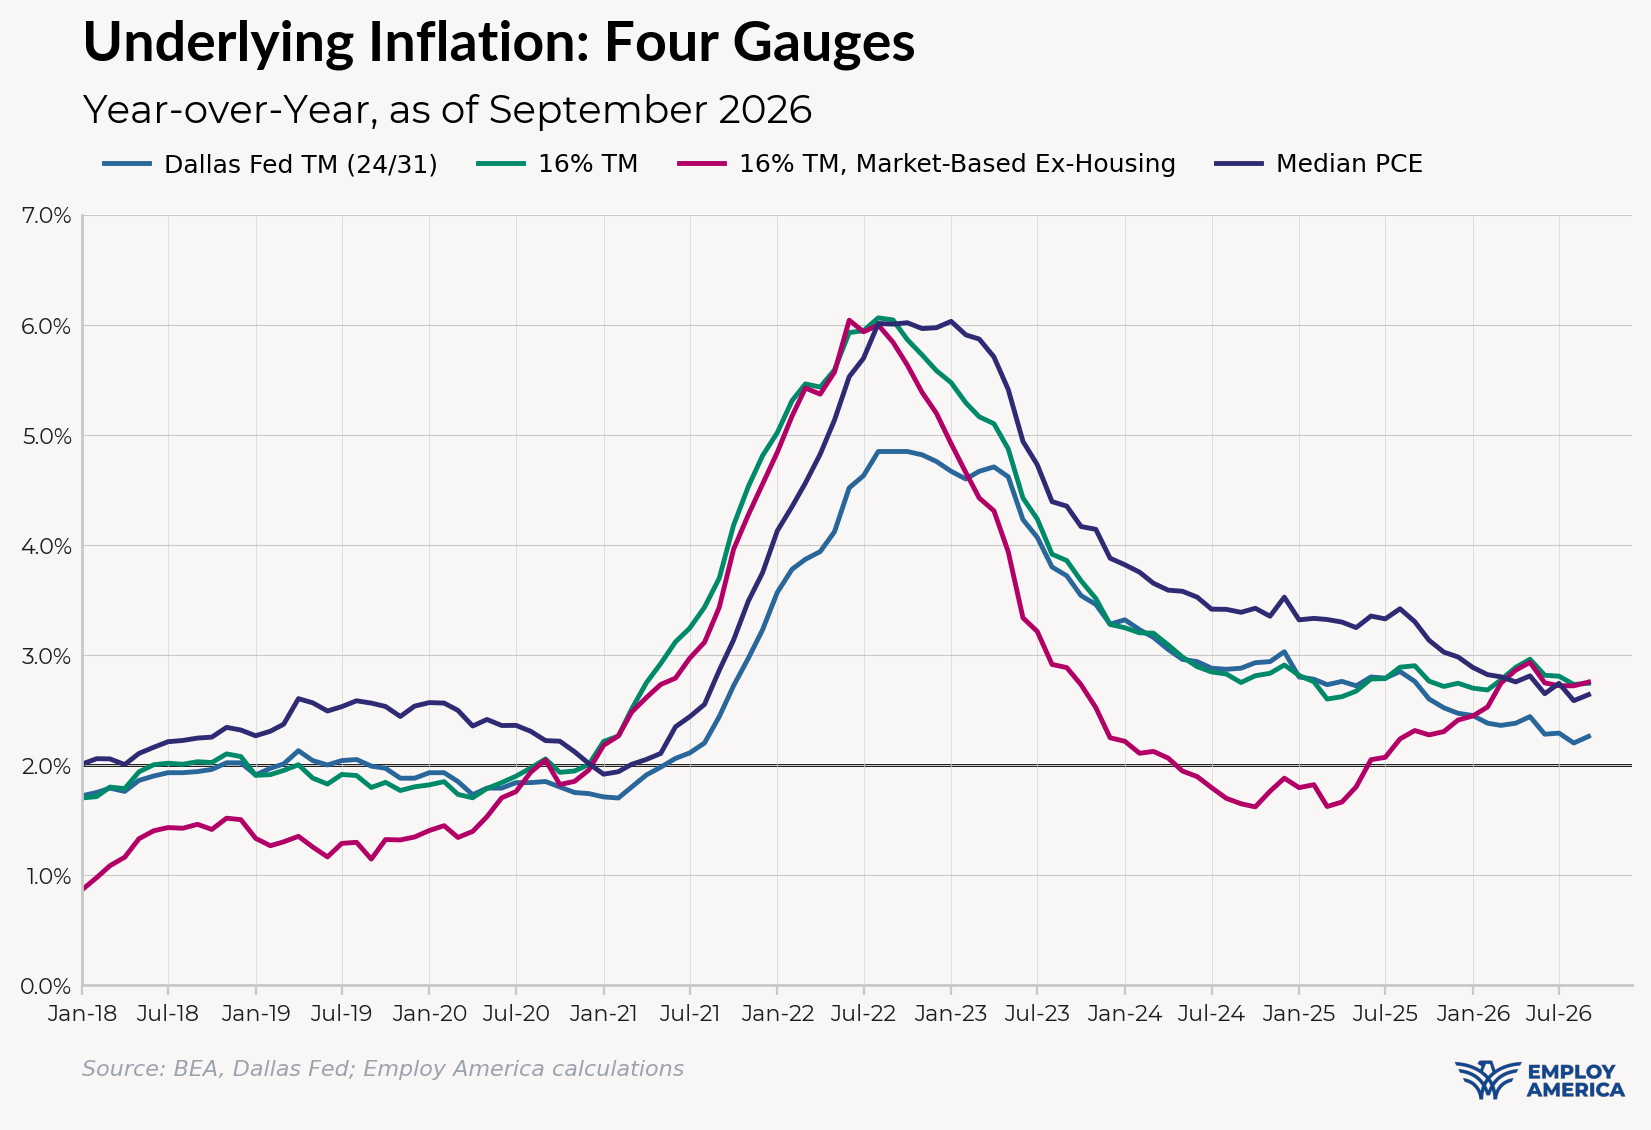
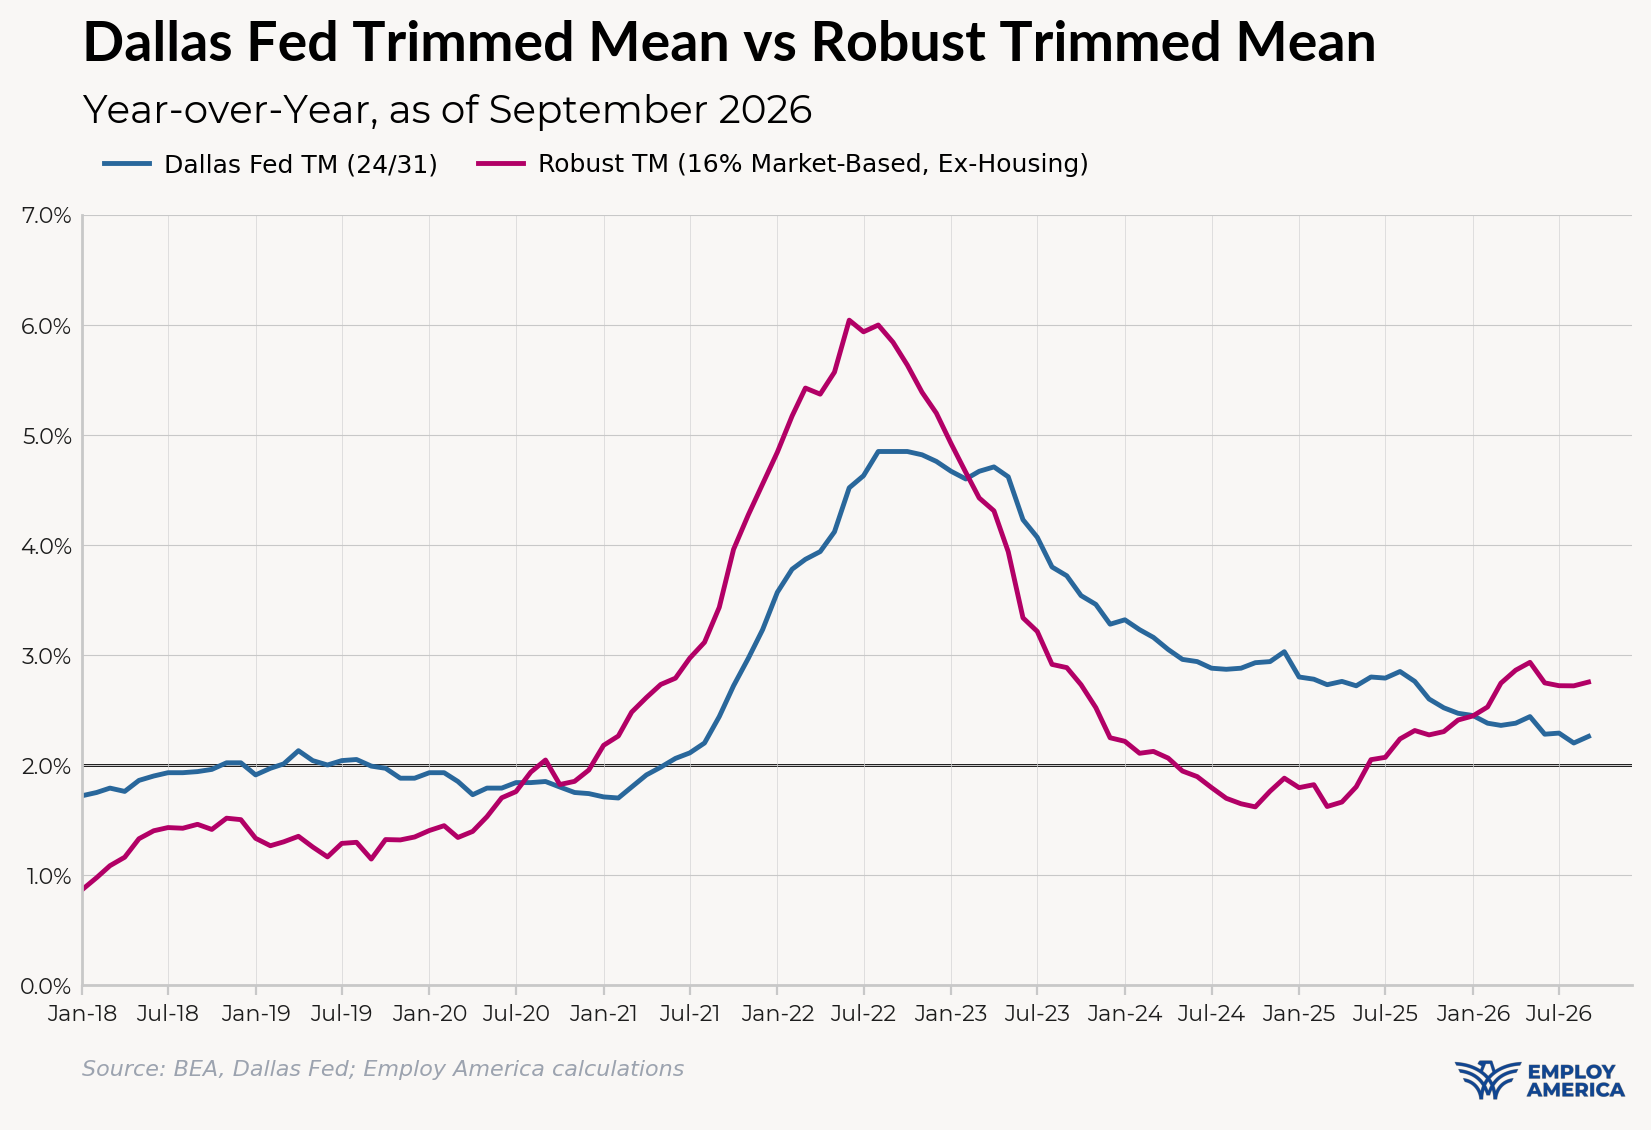
With the exception of the Dallas Fed's gauge, trimmed mean measures are running below core PCE (2.71–2.77% vs 3.12%), but still above the Fed's 2% target. Our Robust Trimmed Mean gauge, which excludes housing (which lags market rents) and imputed prices not observed in market transactions, came in at 2.75% for September. On a m/m basis, Robust TM came in at 29bps, up from 21bps (revised) in August.
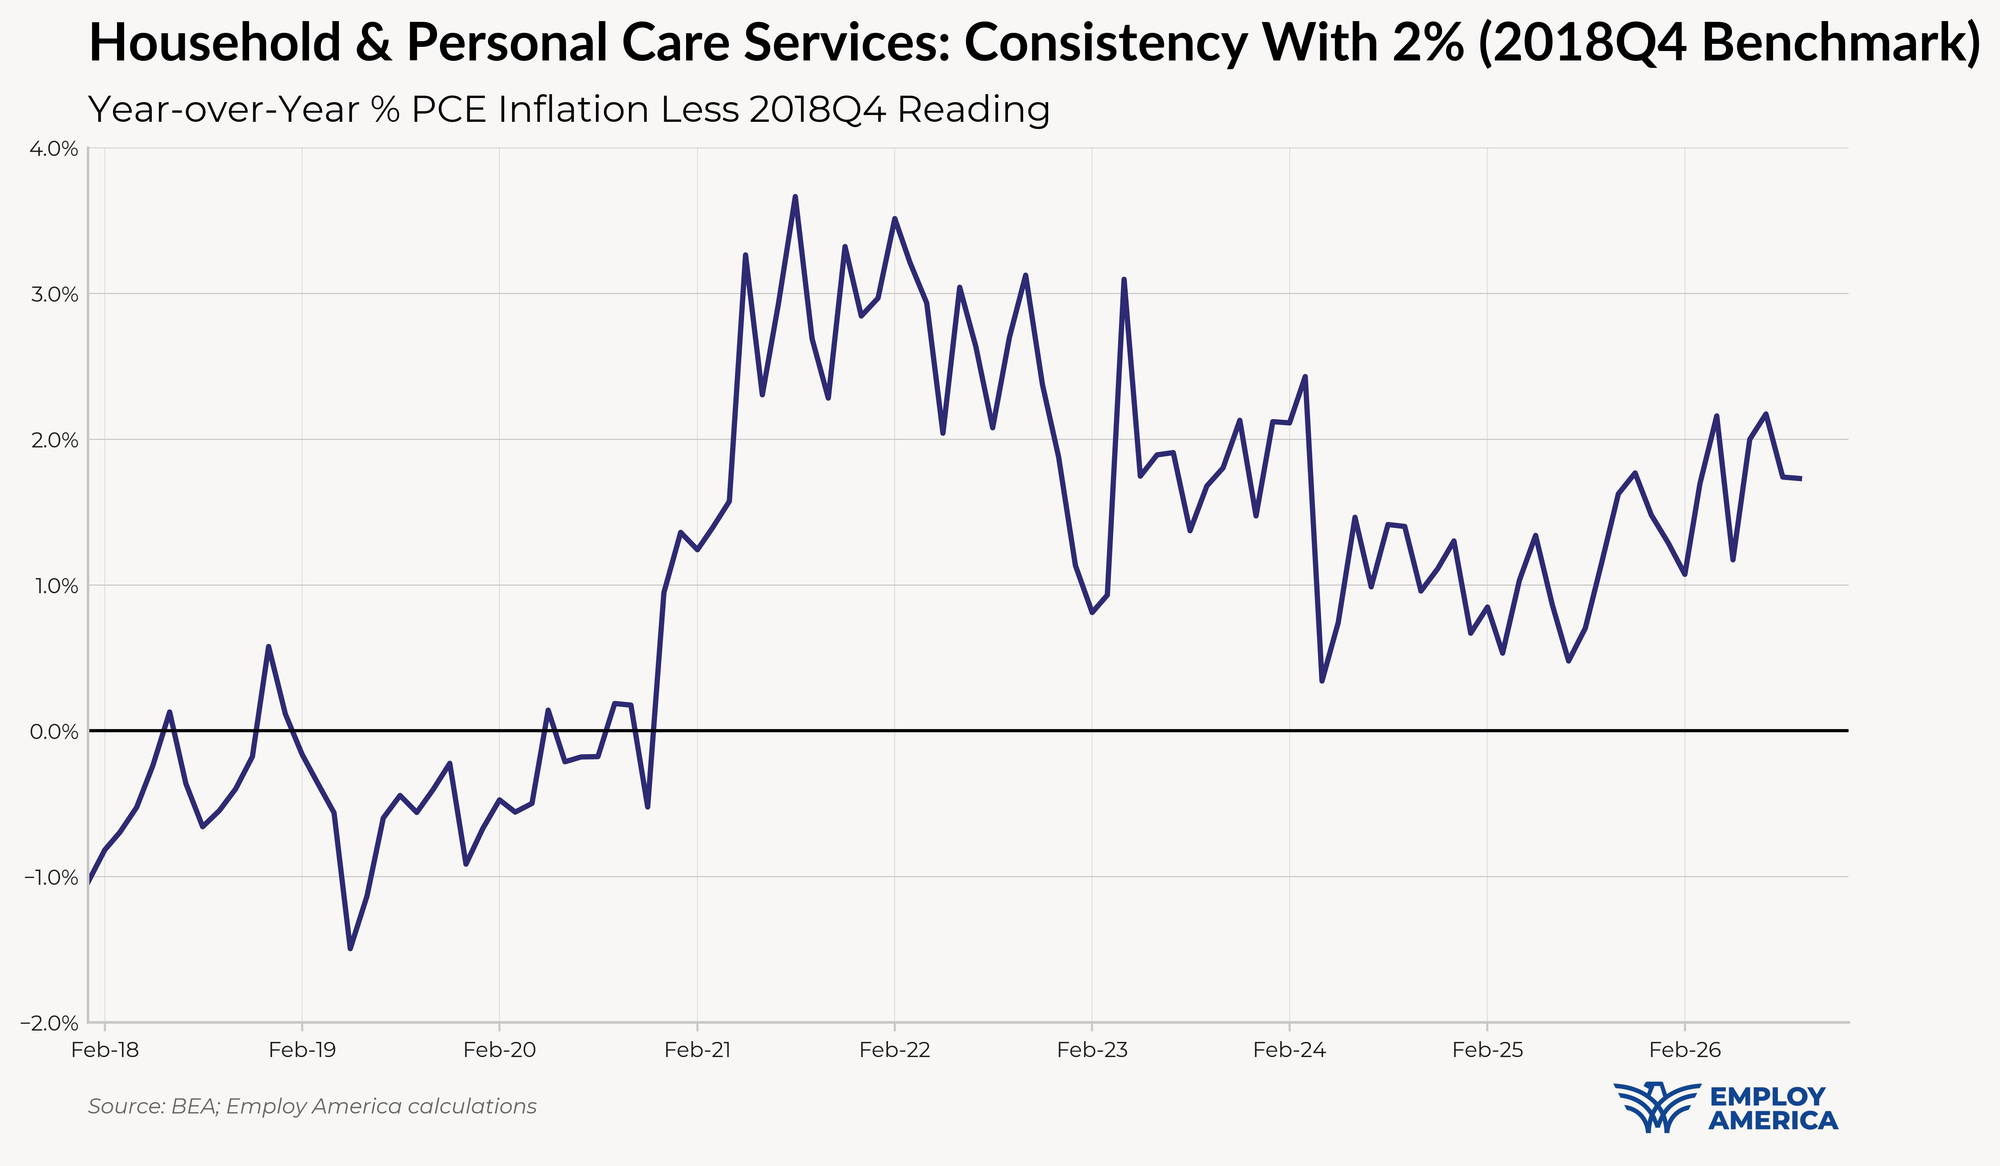
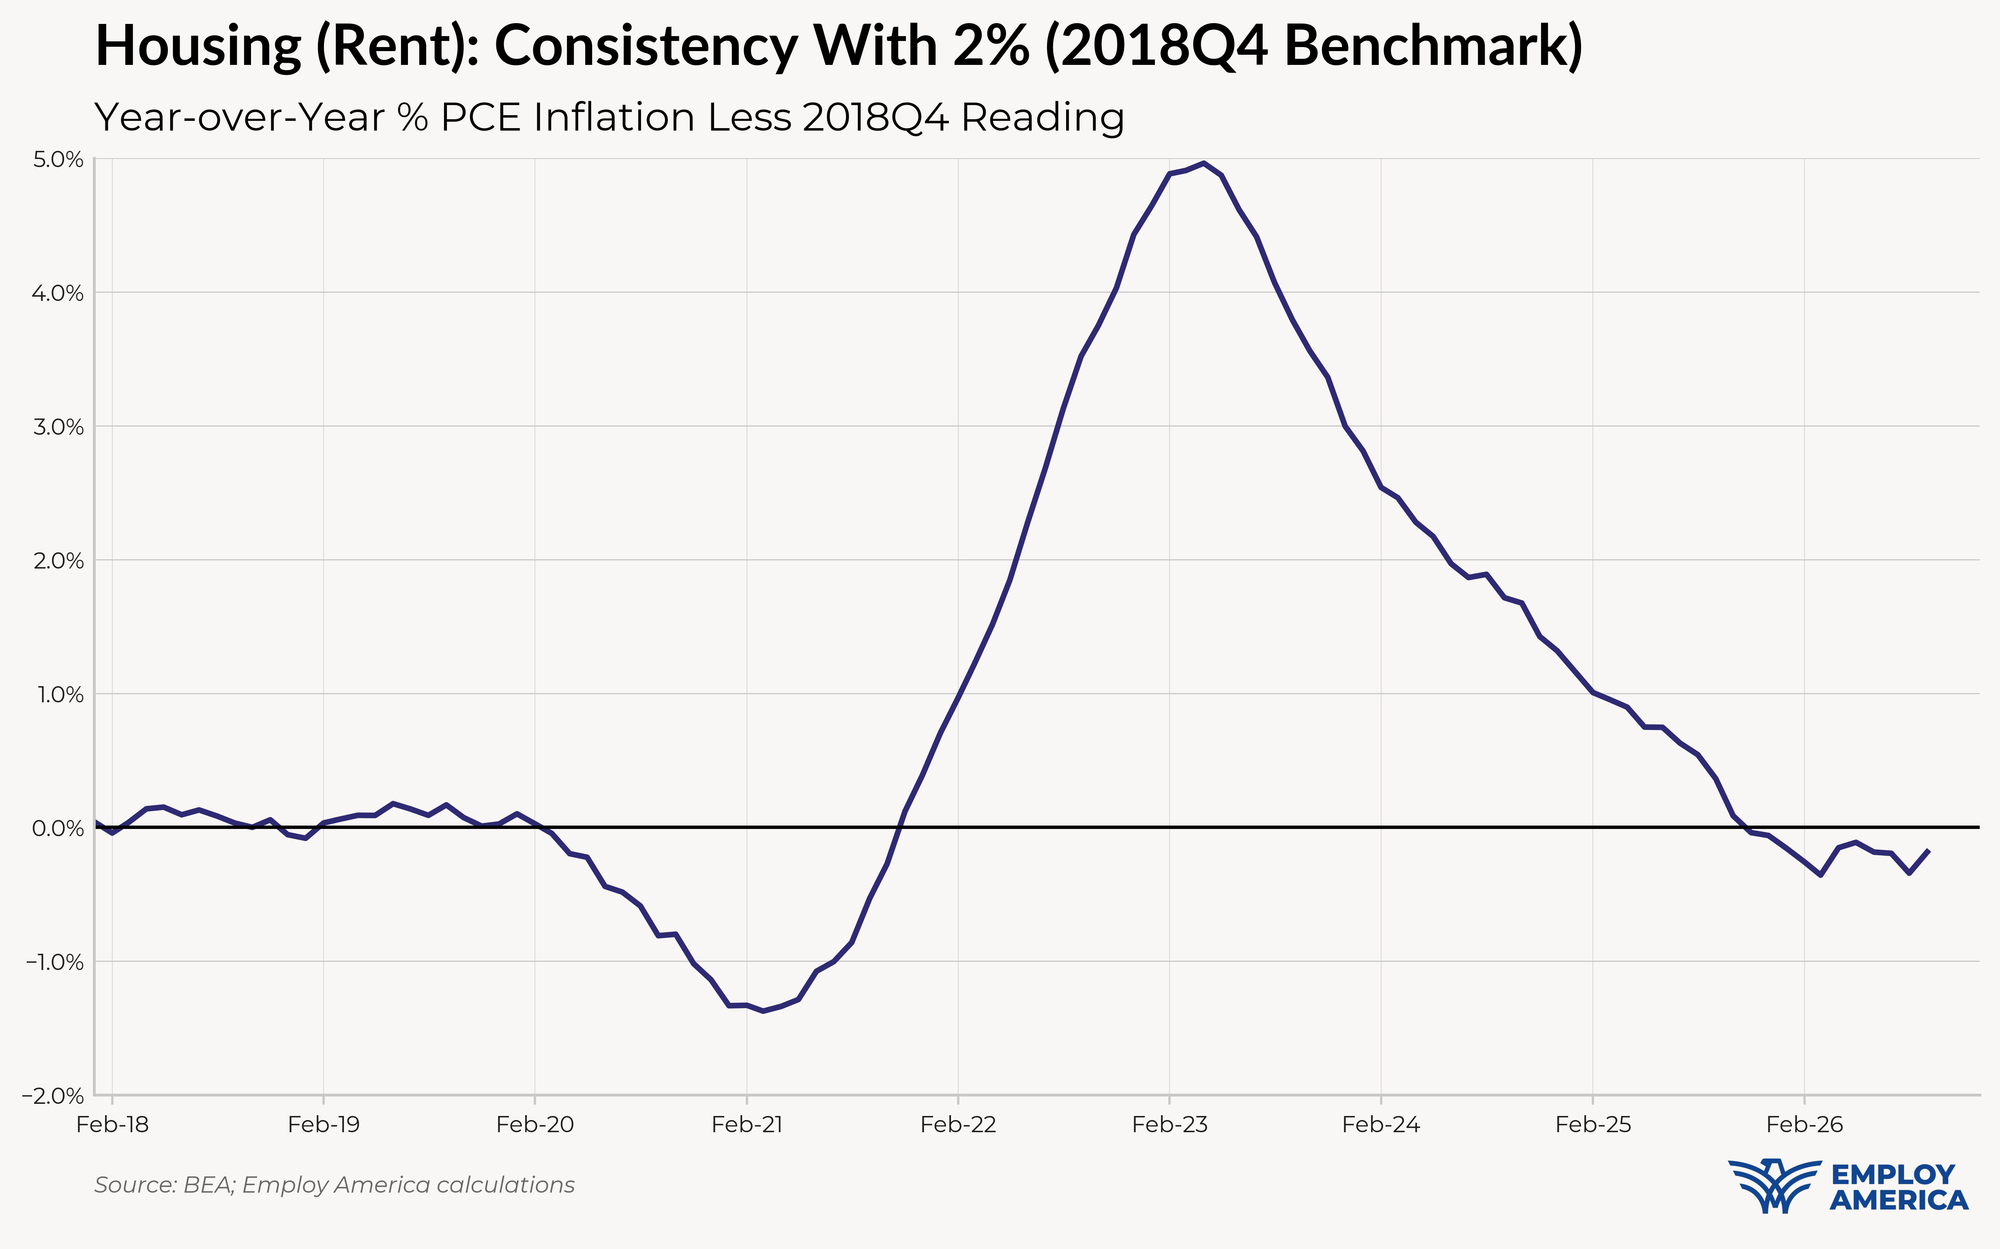
Inflation Overshoots At The Component Level
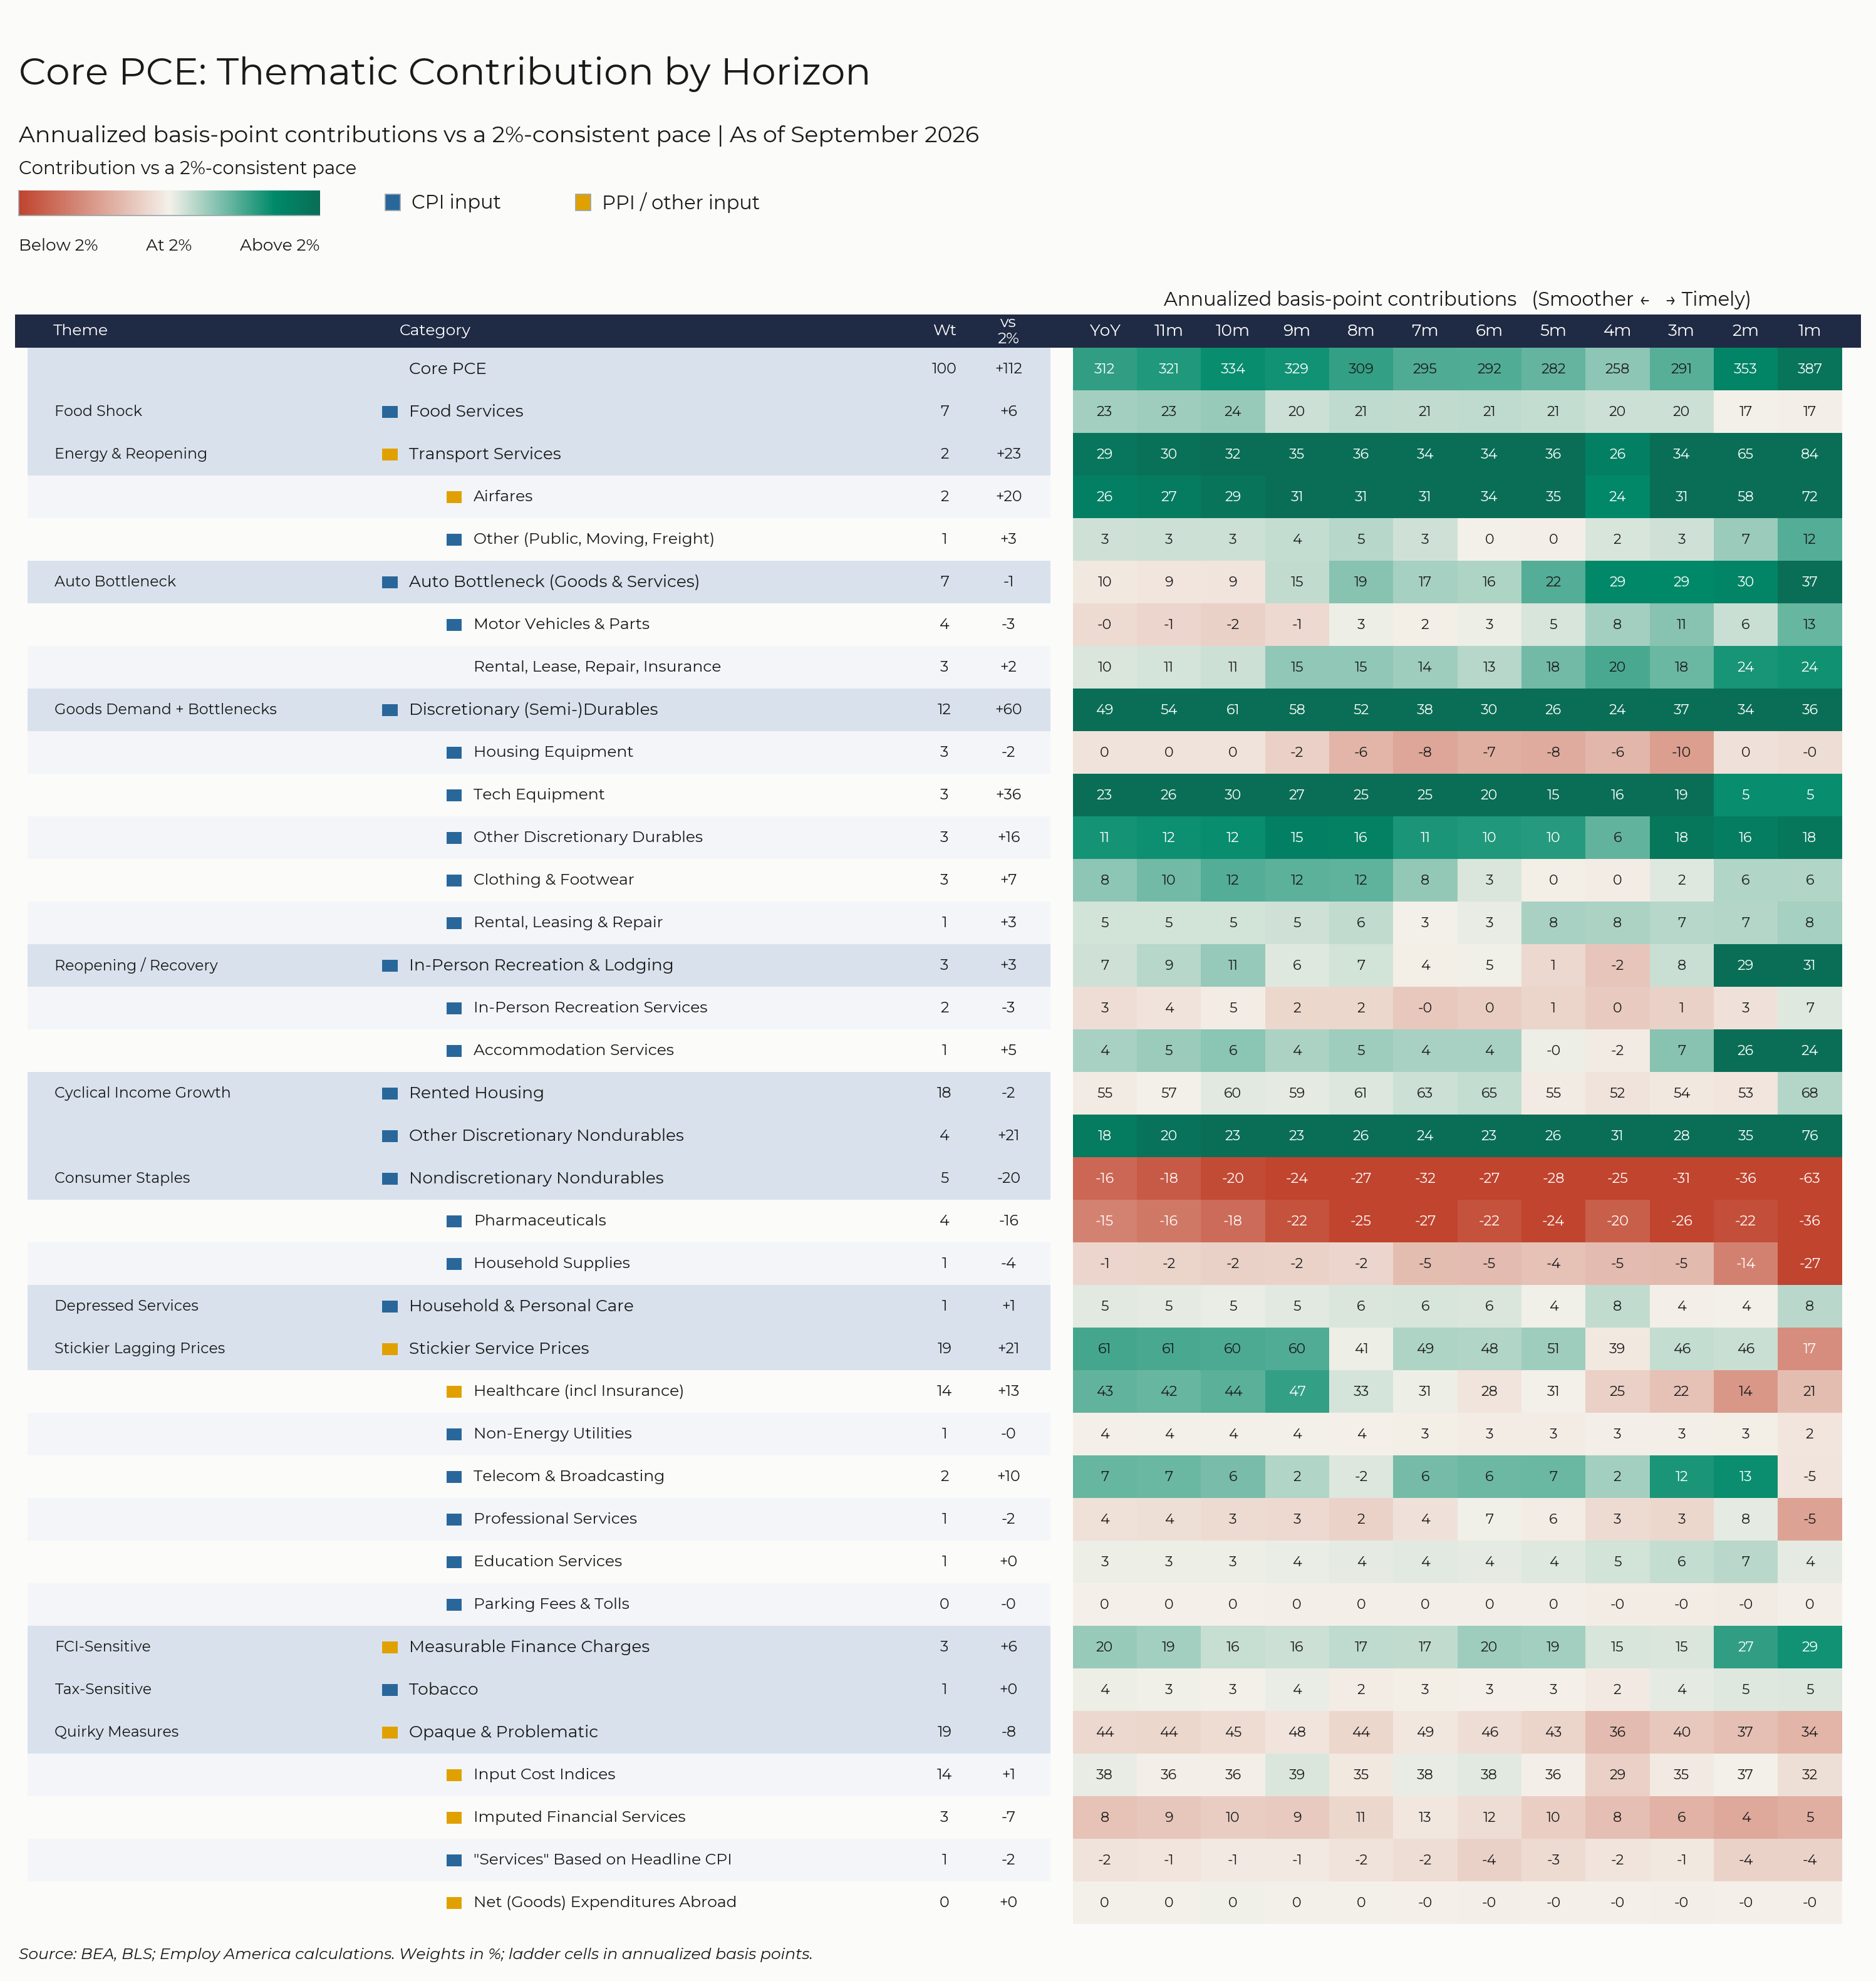
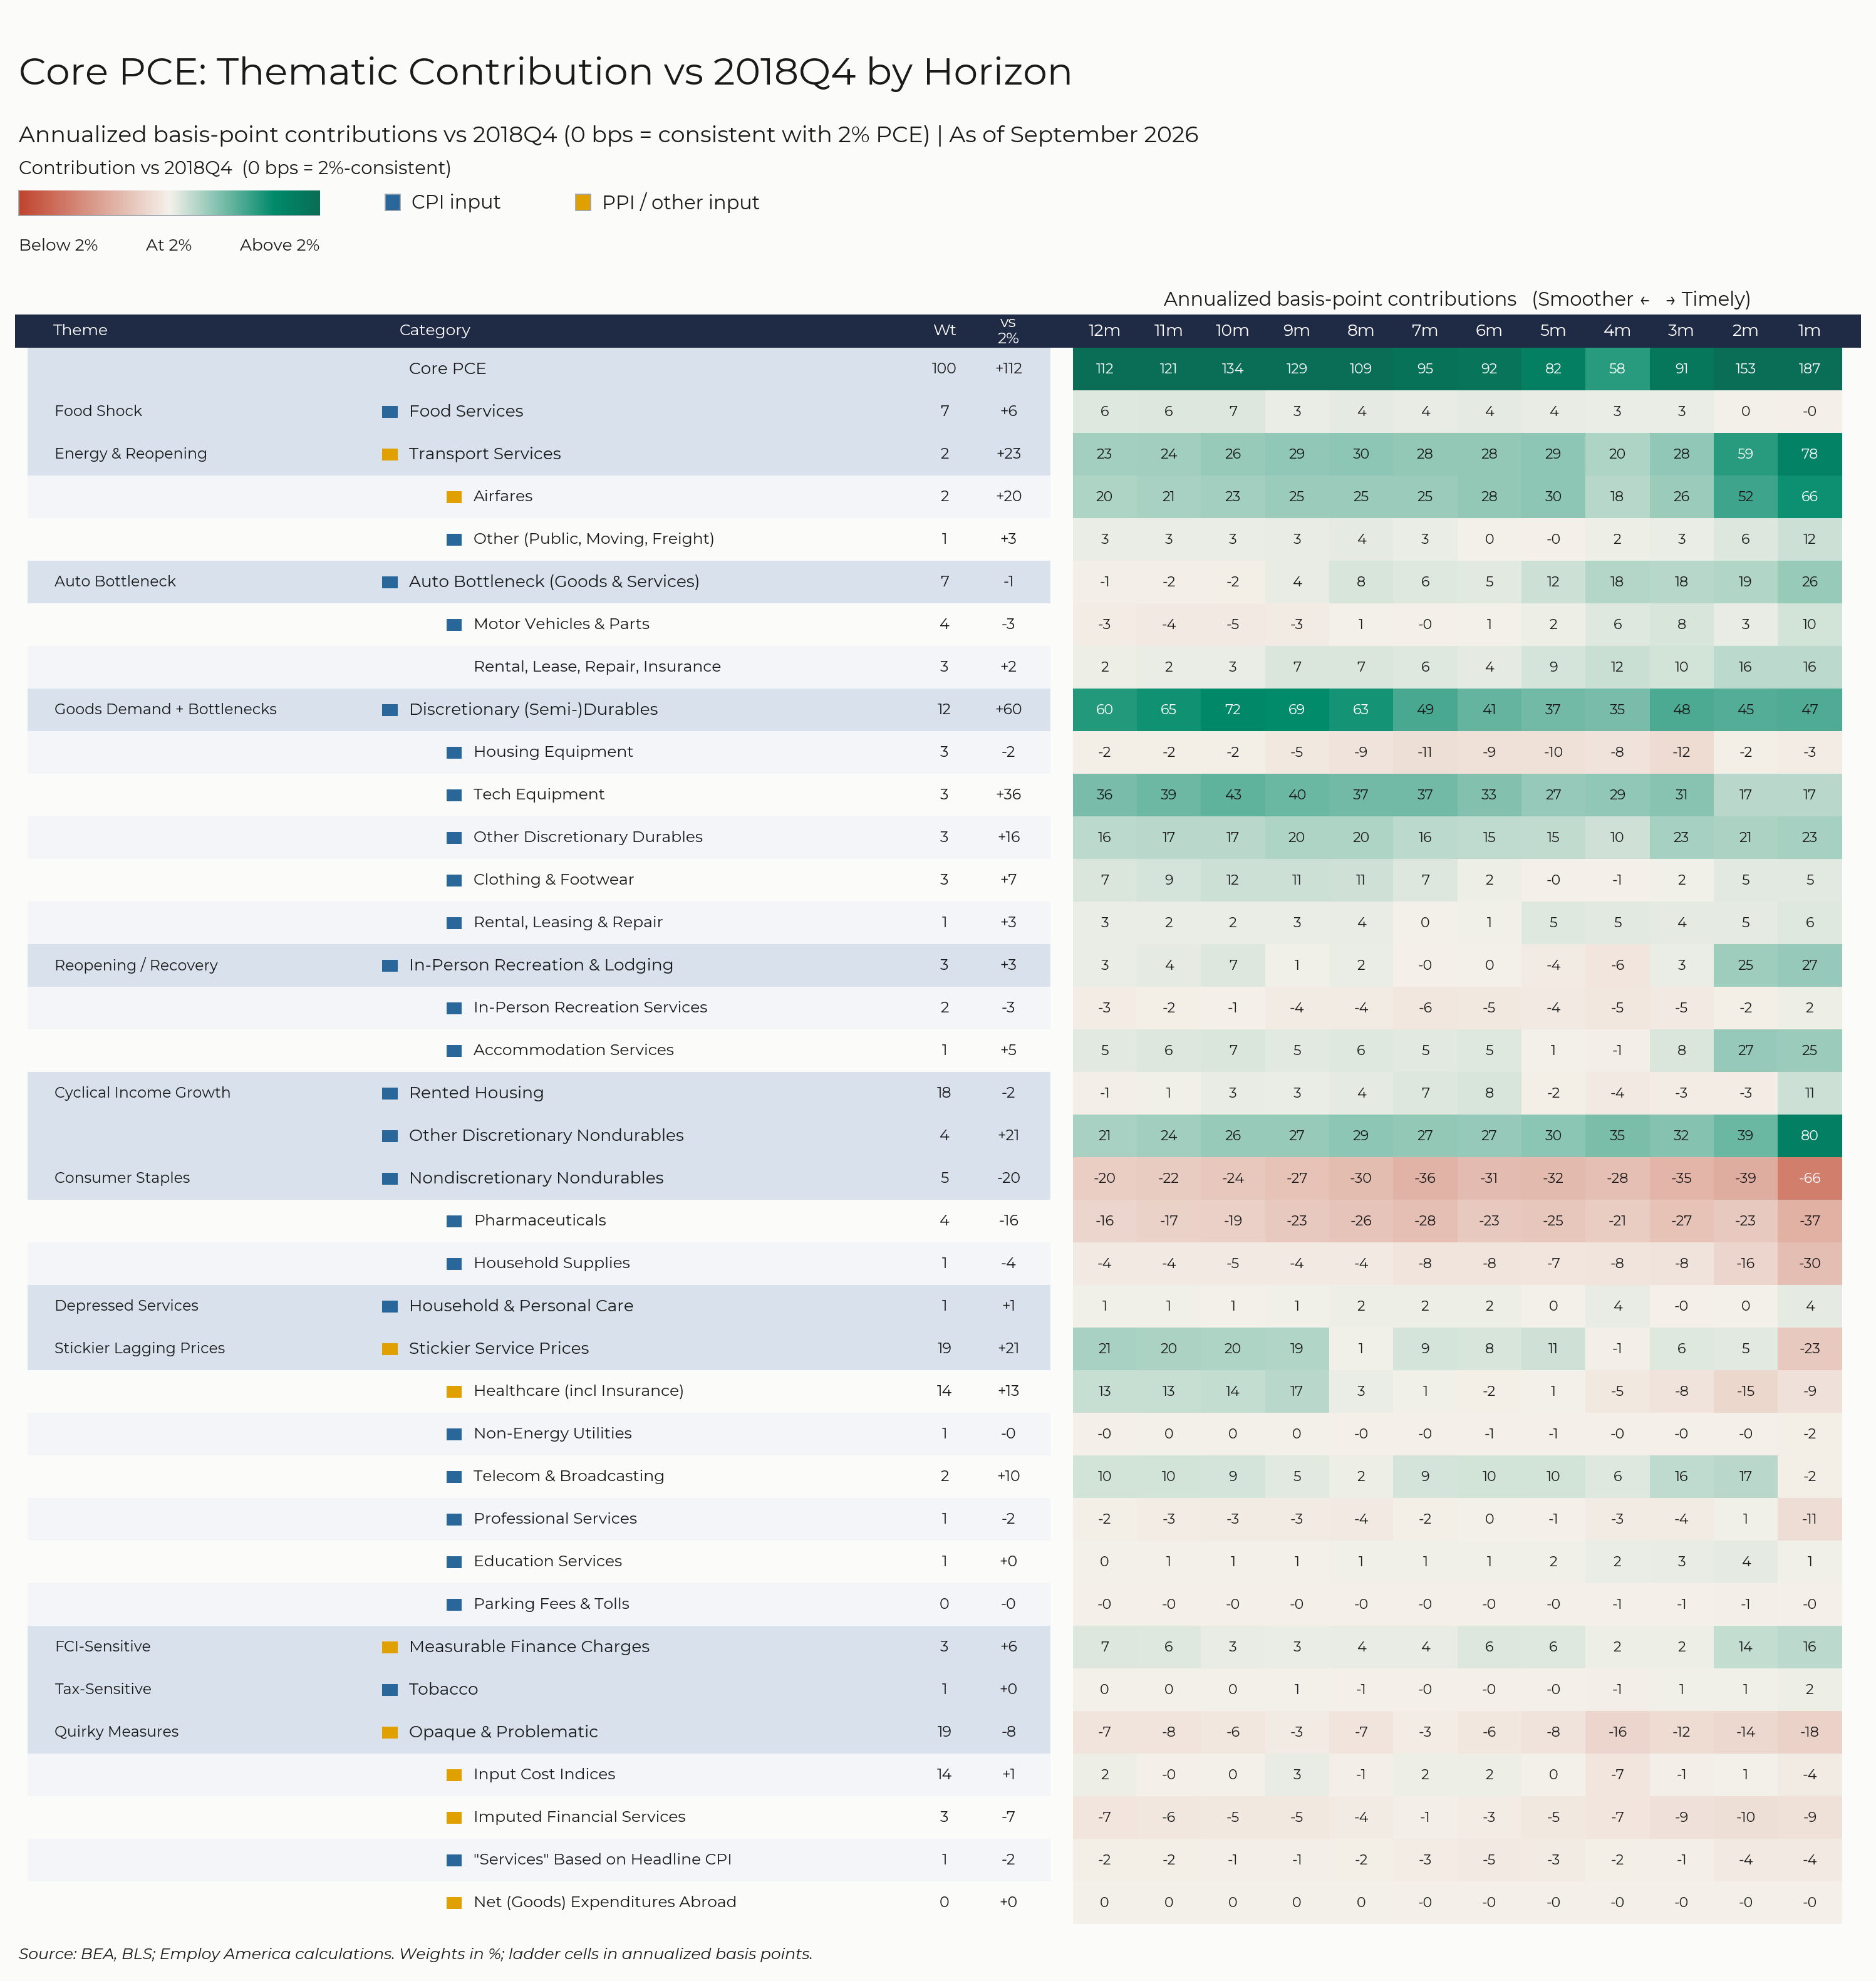
For the Detail-Oriented: Core PCE Heatmaps
Core PCE (PCE less food products and energy) ran at a 3.12% year-over-year pace in September, 112 basis points above the Fed's 2% inflation target for PCE.
Within this bucket, Tech equipment is adding 36 basis points.
Other discretionary nondurables are adding 21 basis points.
Airfares are adding 20 basis points.
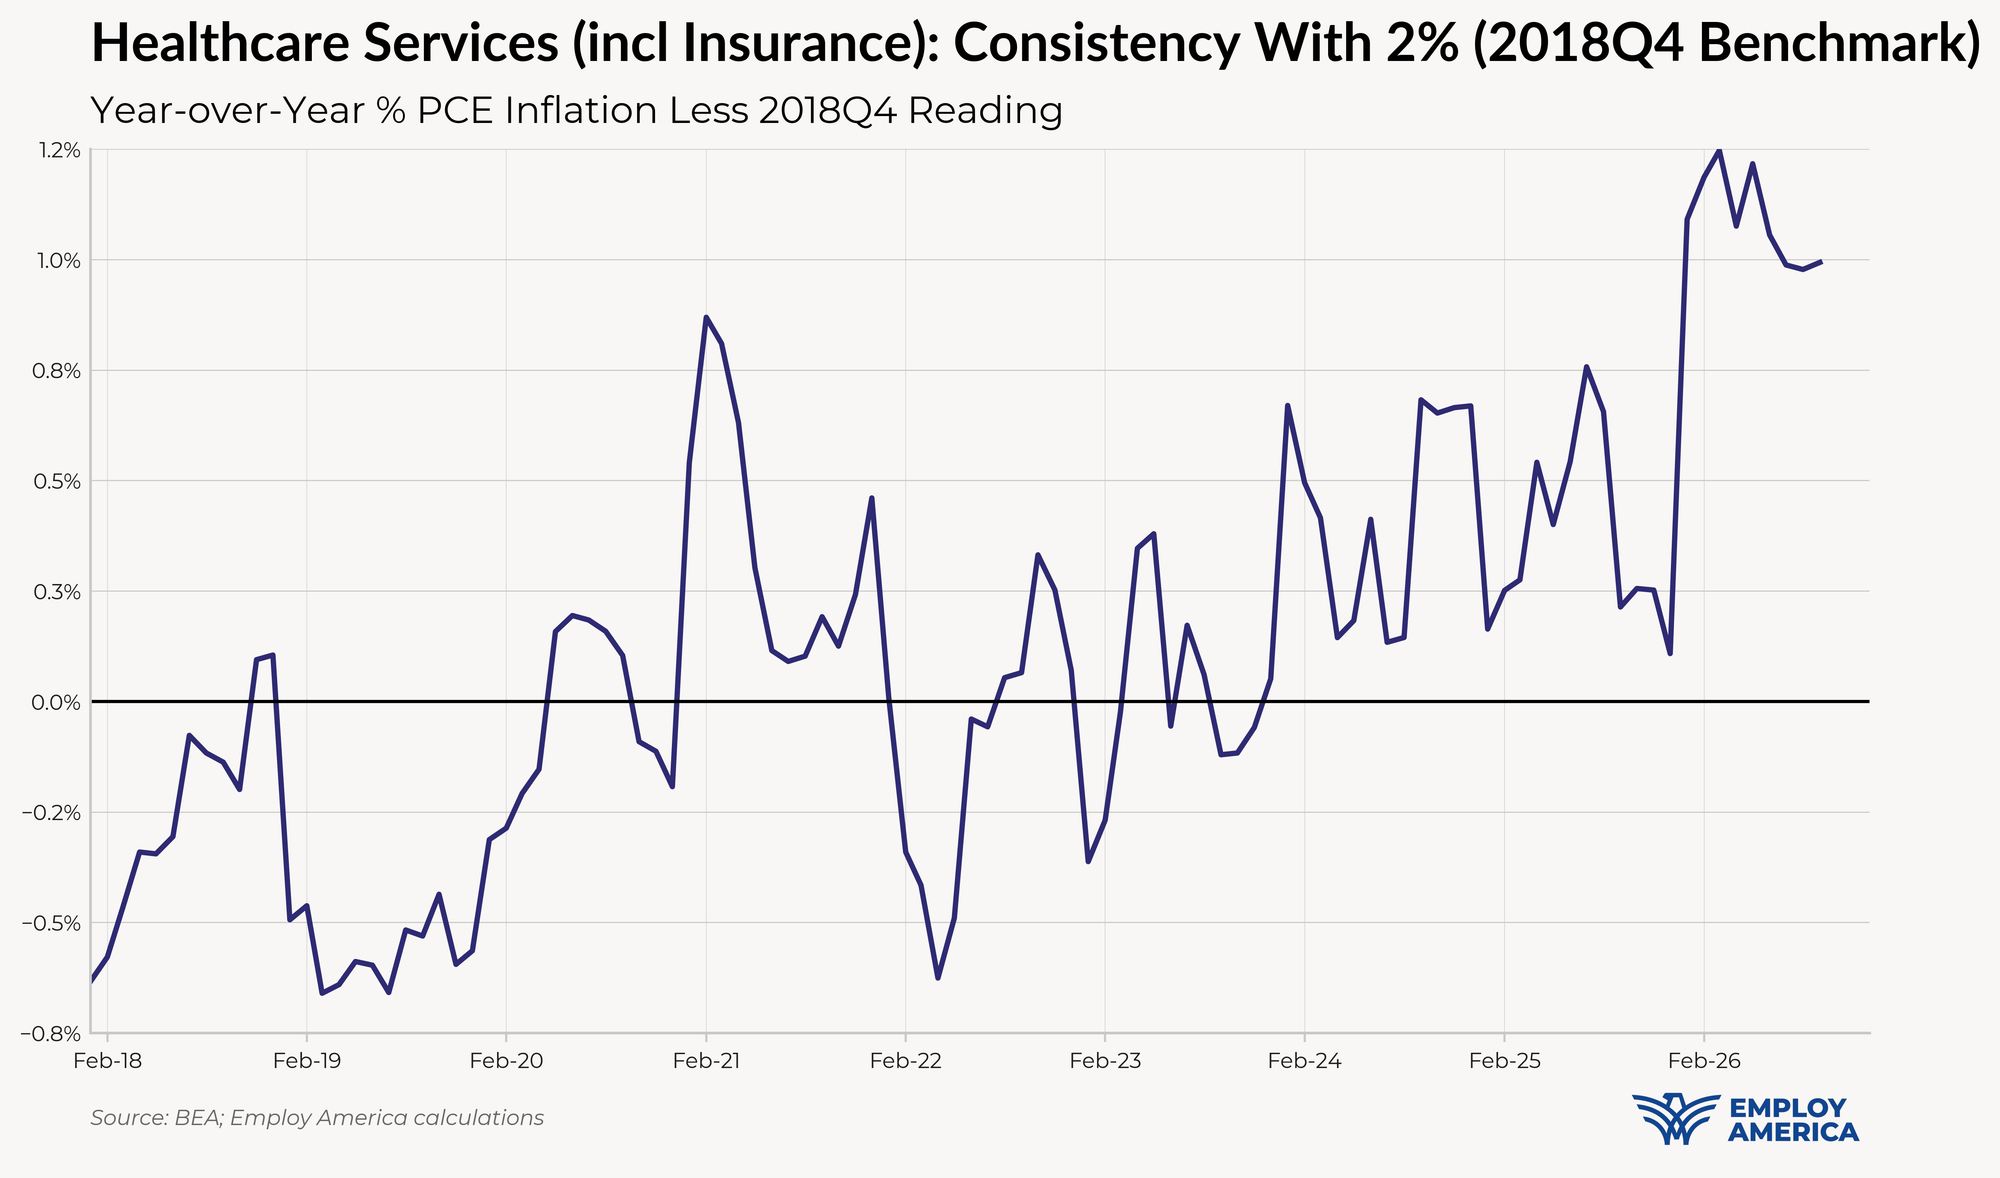
Healthcare services are adding 13 basis points.
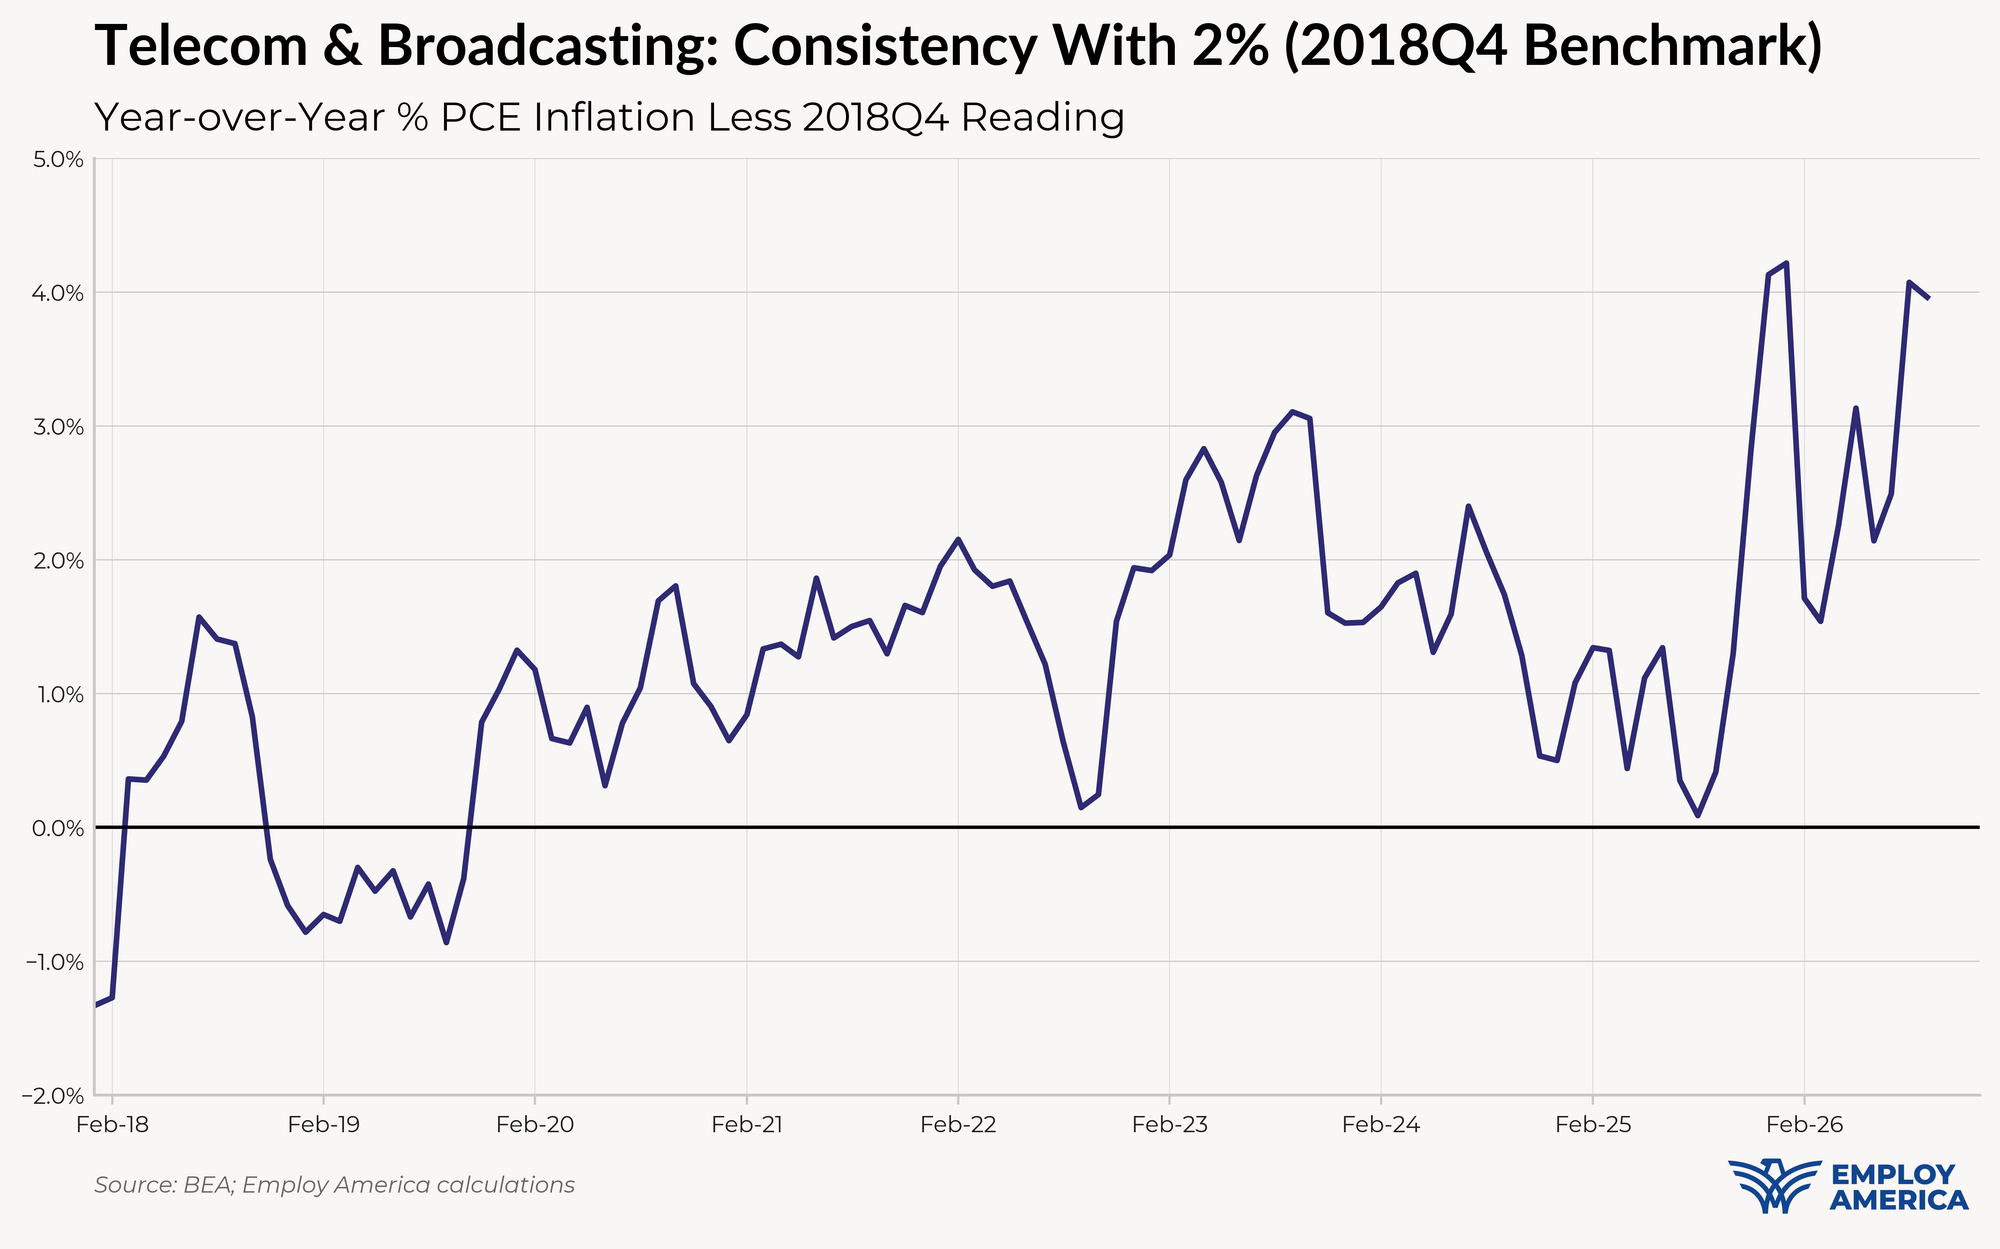
Telecommunications and broadcasting are adding 10 basis points.
Measurable finance charges are adding 6 basis points.
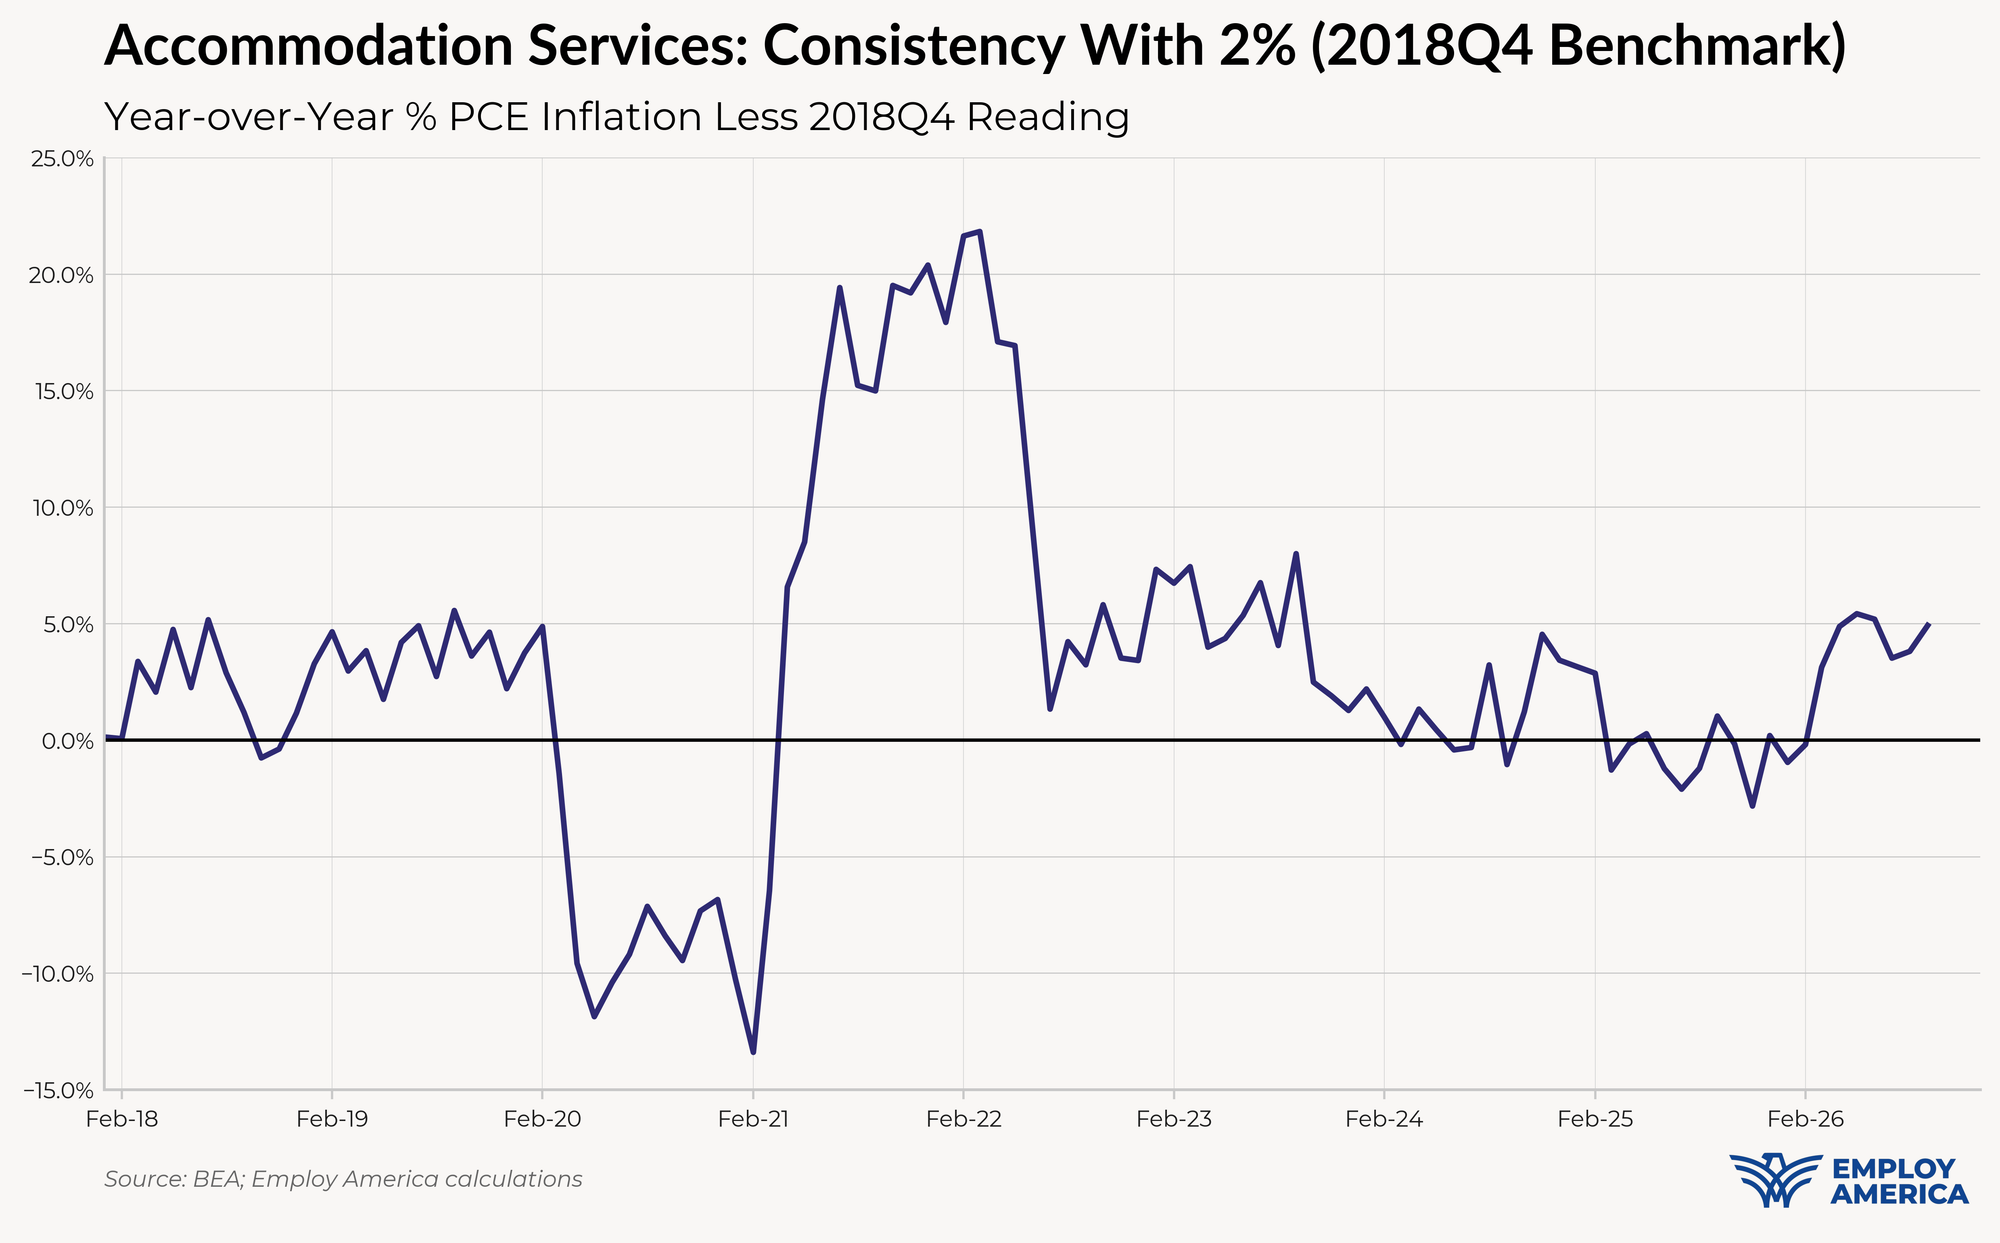
Food services are adding 6 basis points to the overshoot.
The final heatmap below gives you a sense of the overshoot on shorter annualized run-rates. September monthly annualized core PCE ran at a 3.87% annualized pace, a 187 basis point overshoot vs 2% target inflation.
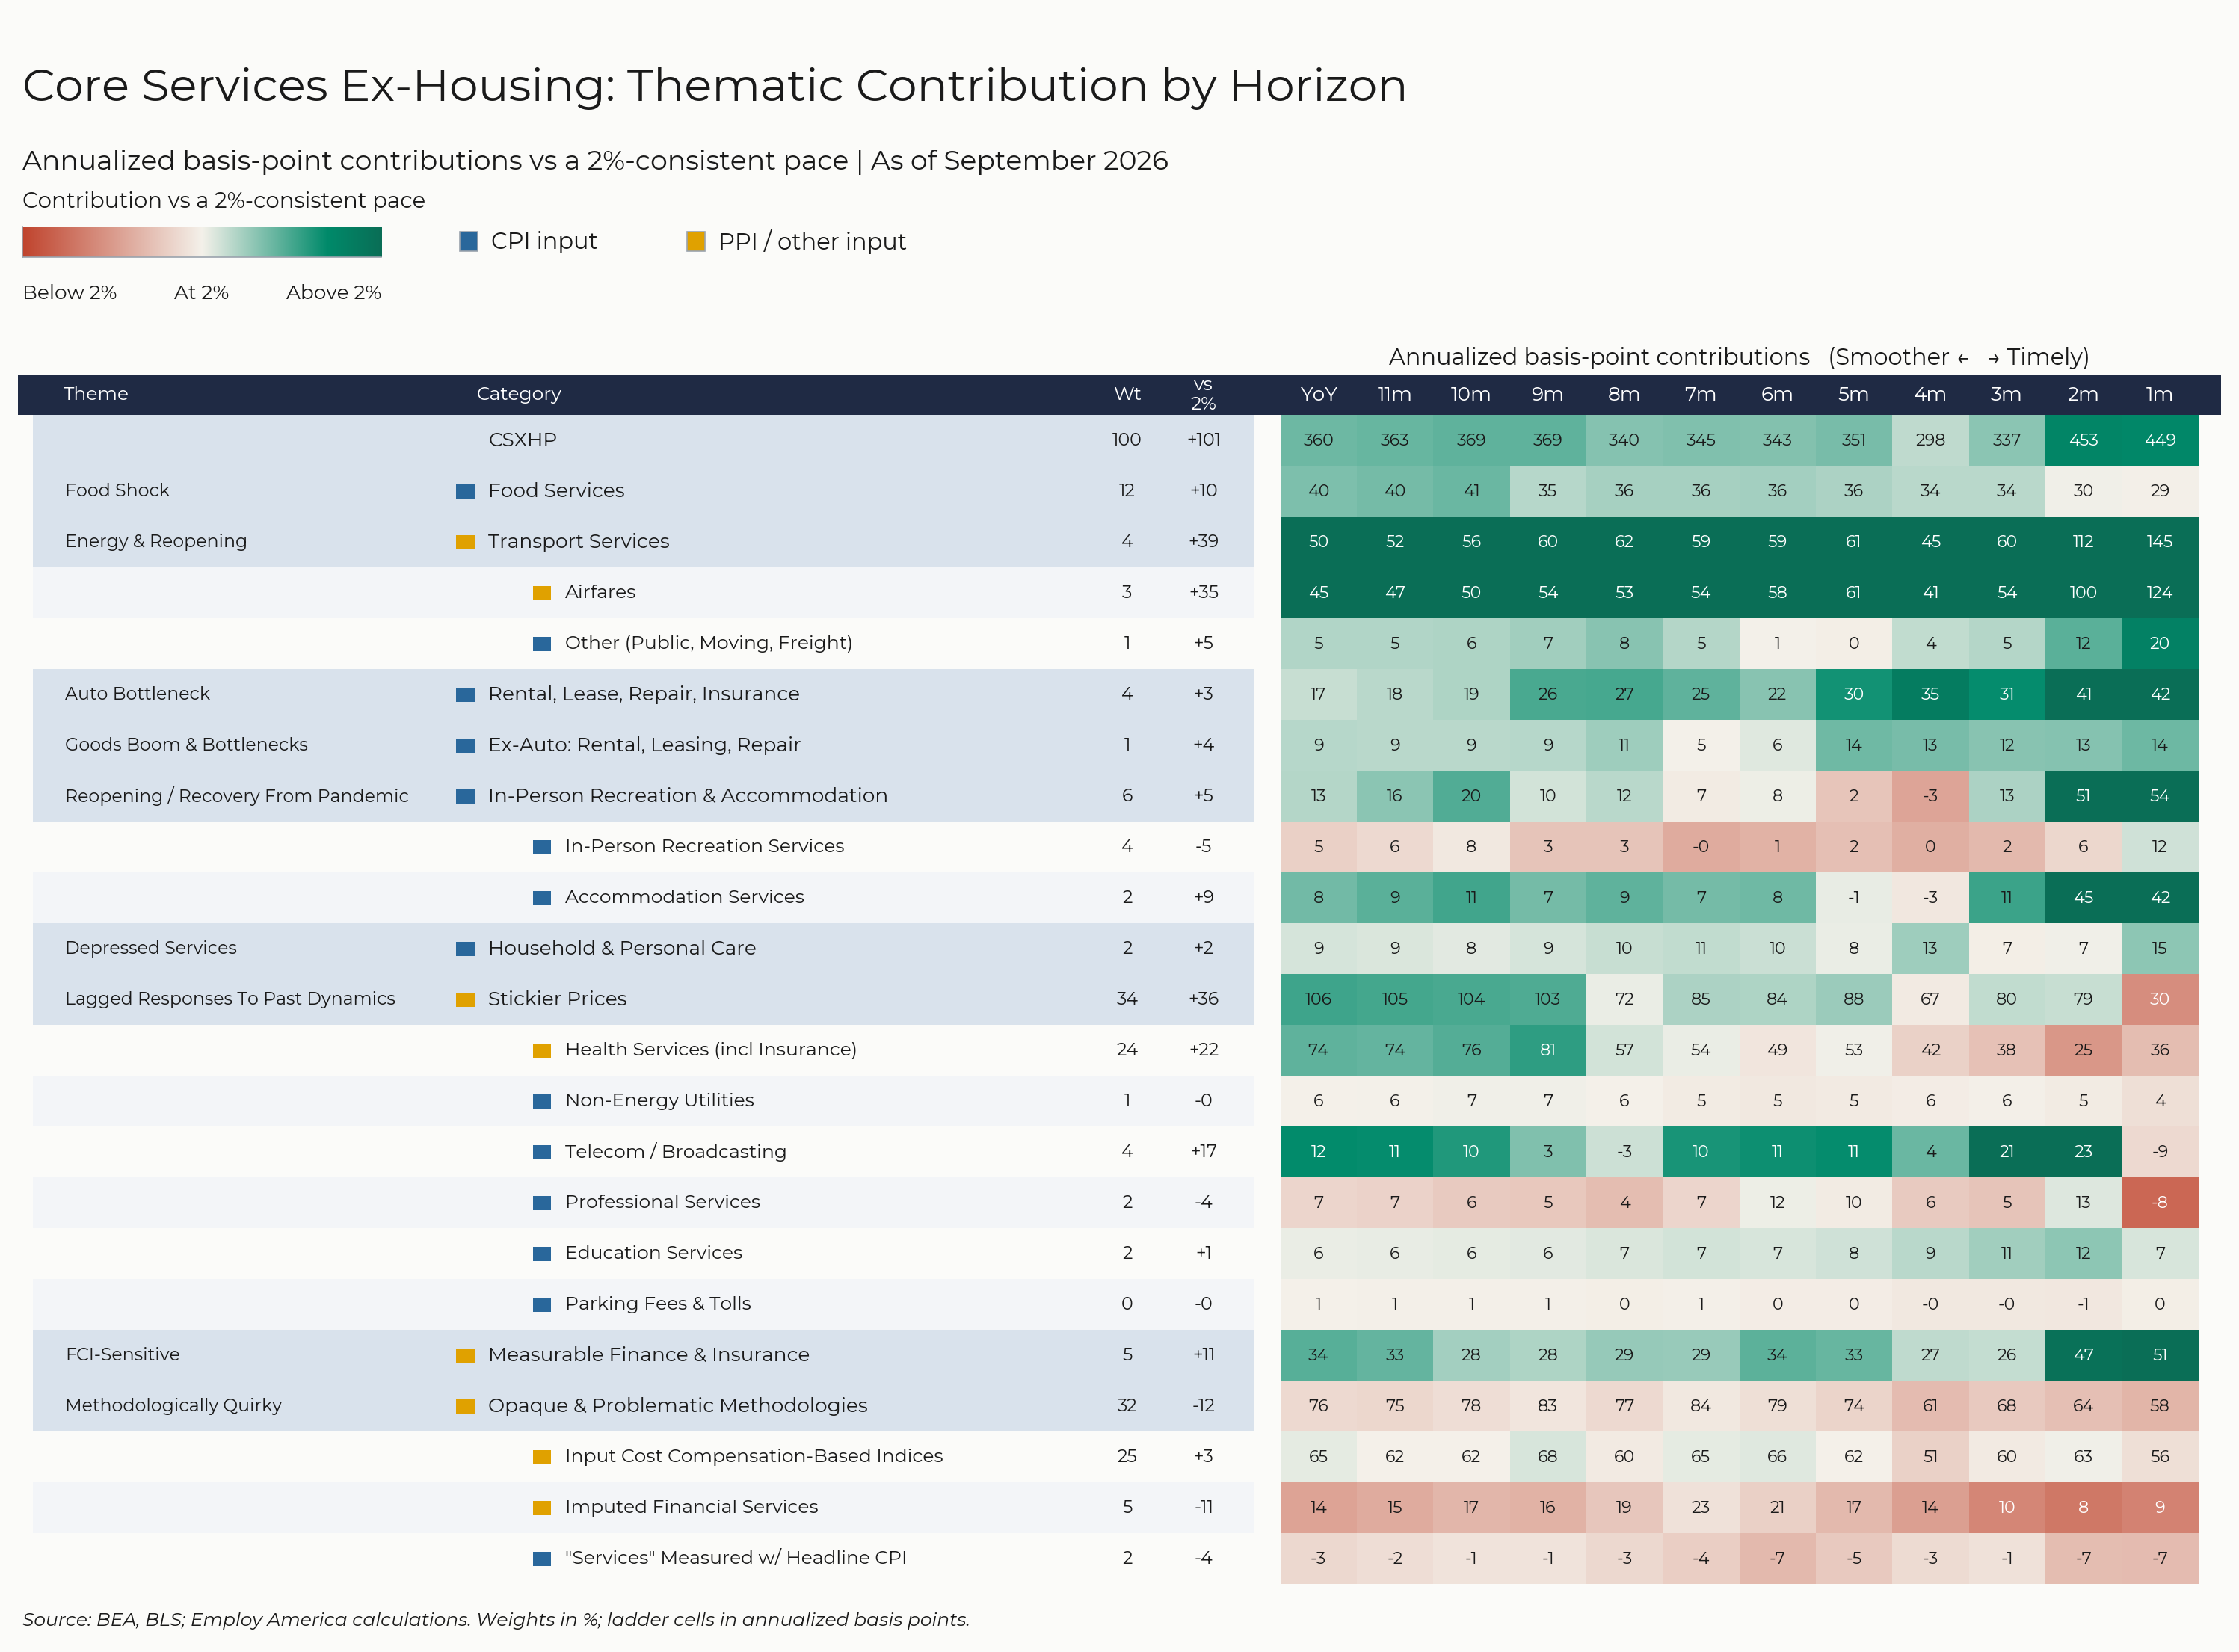
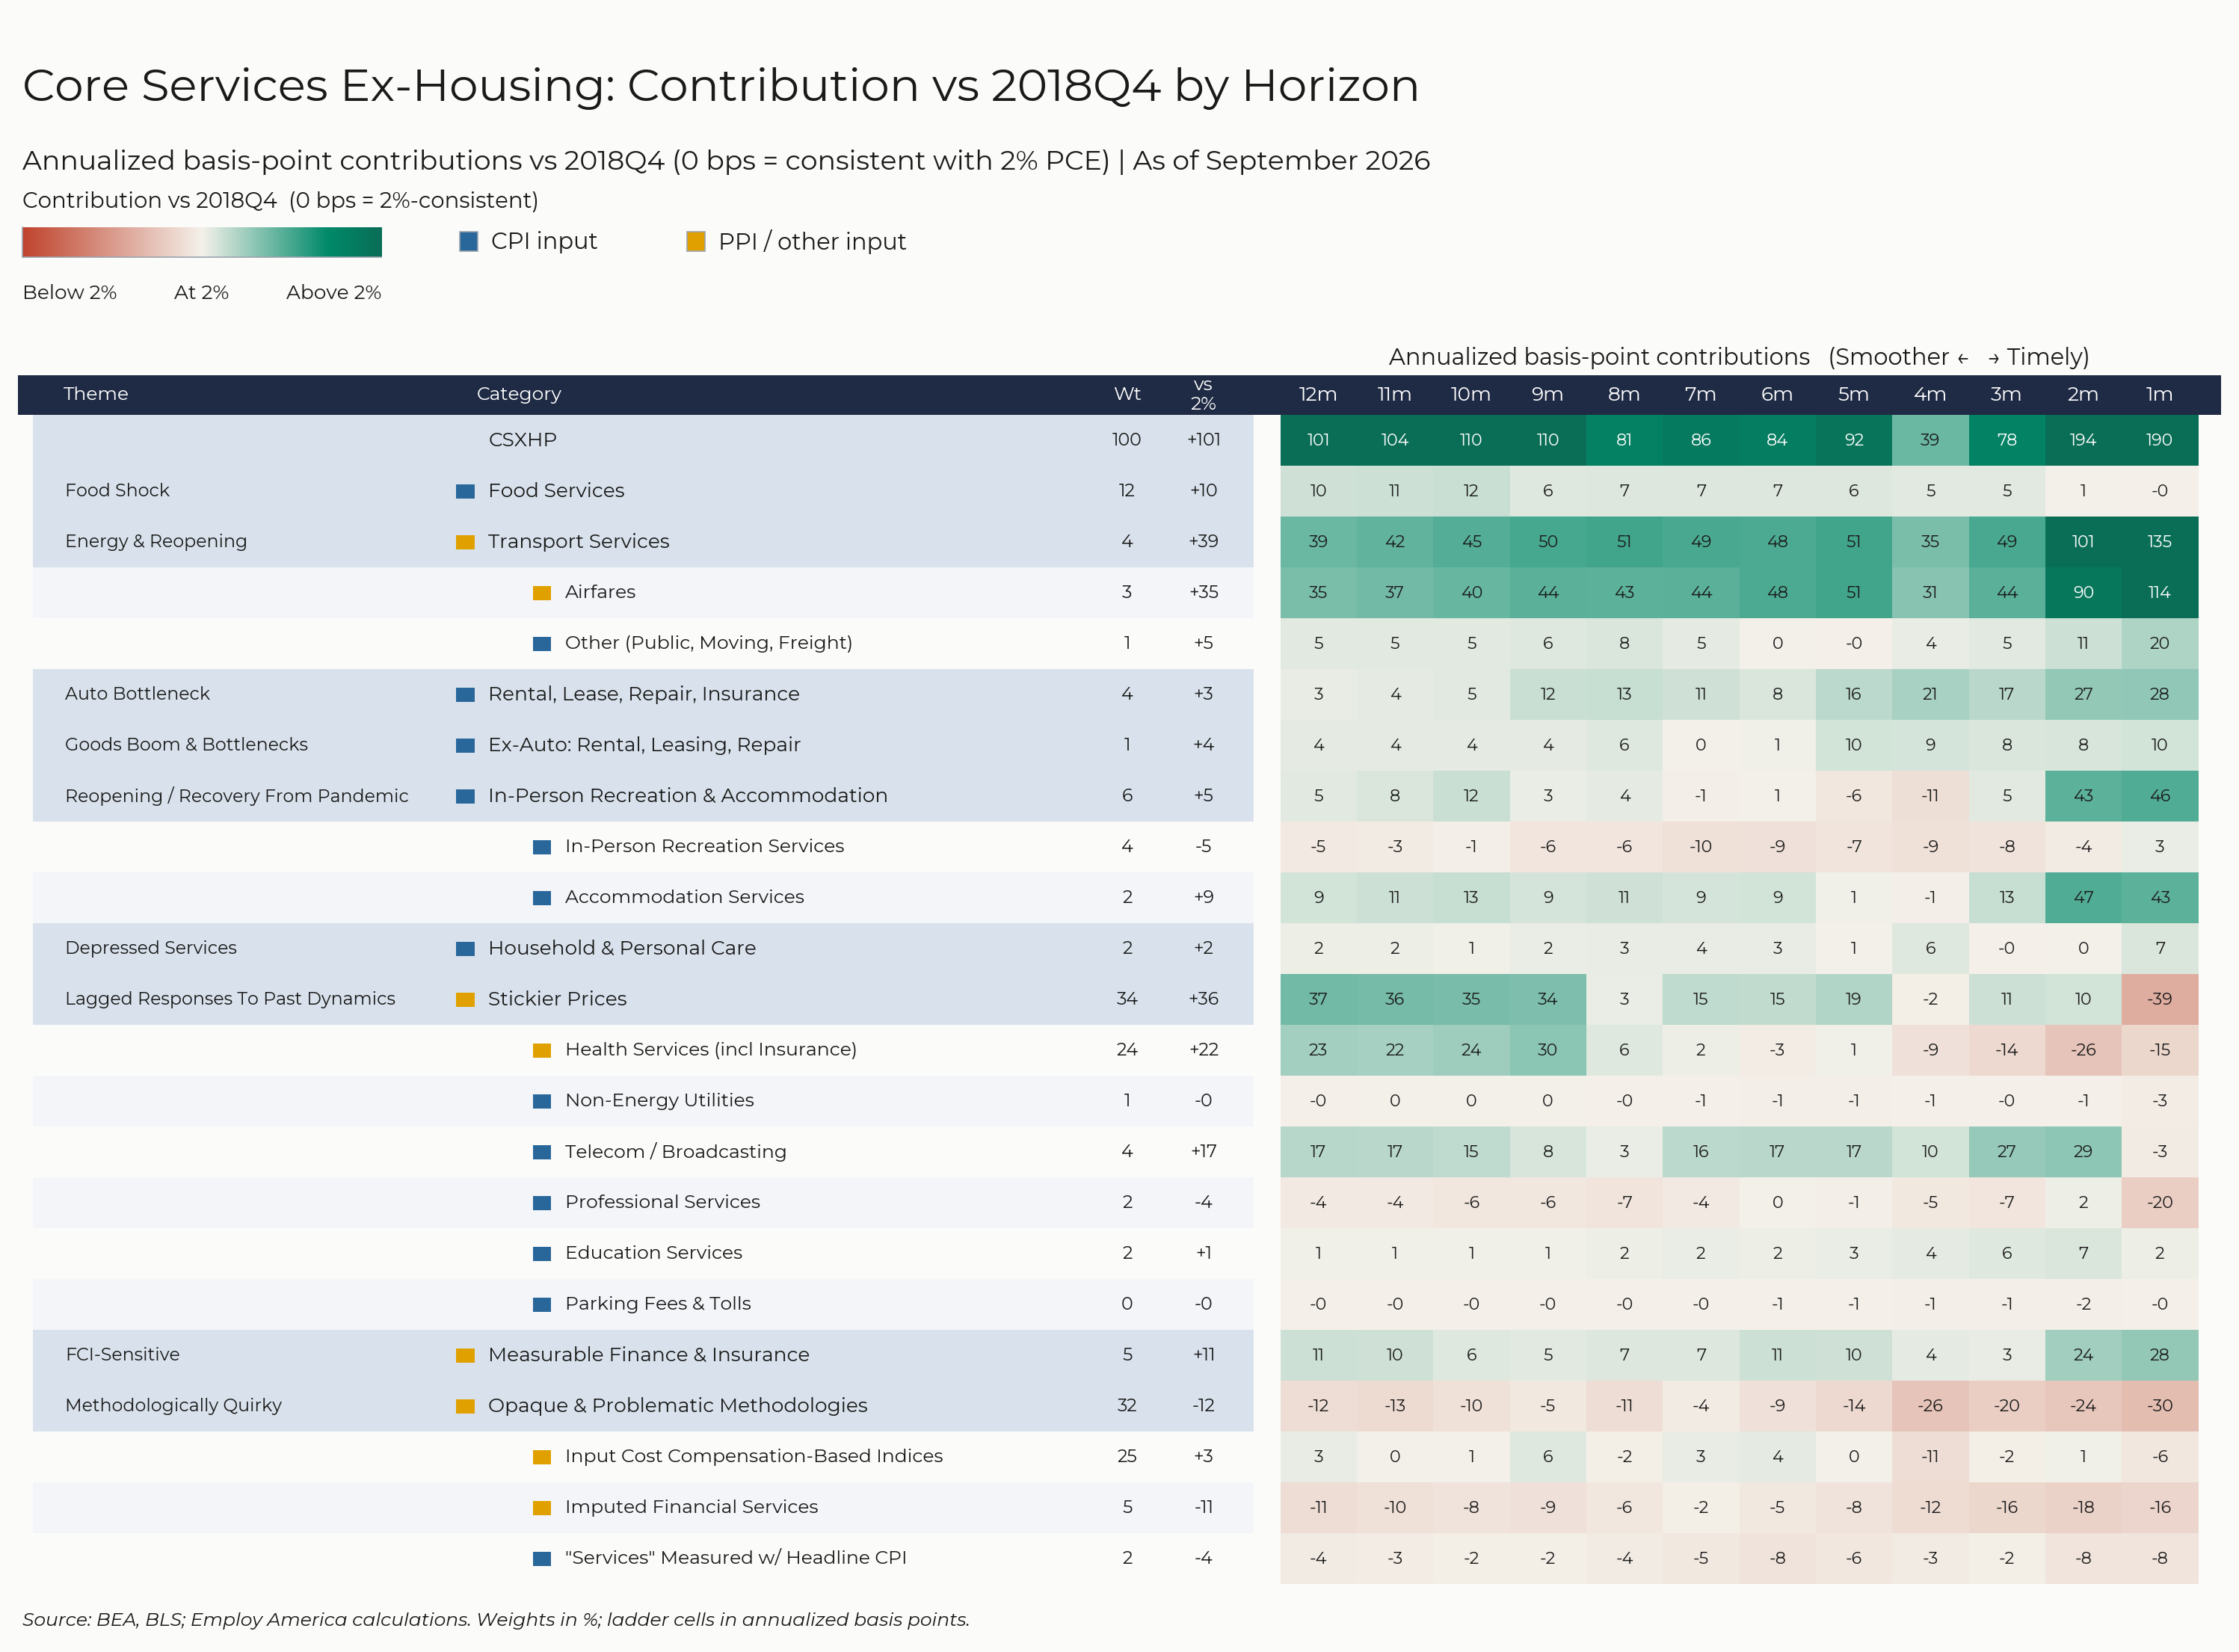
For the Detail-Oriented: Core Services Ex-Housing PCE Heatmaps
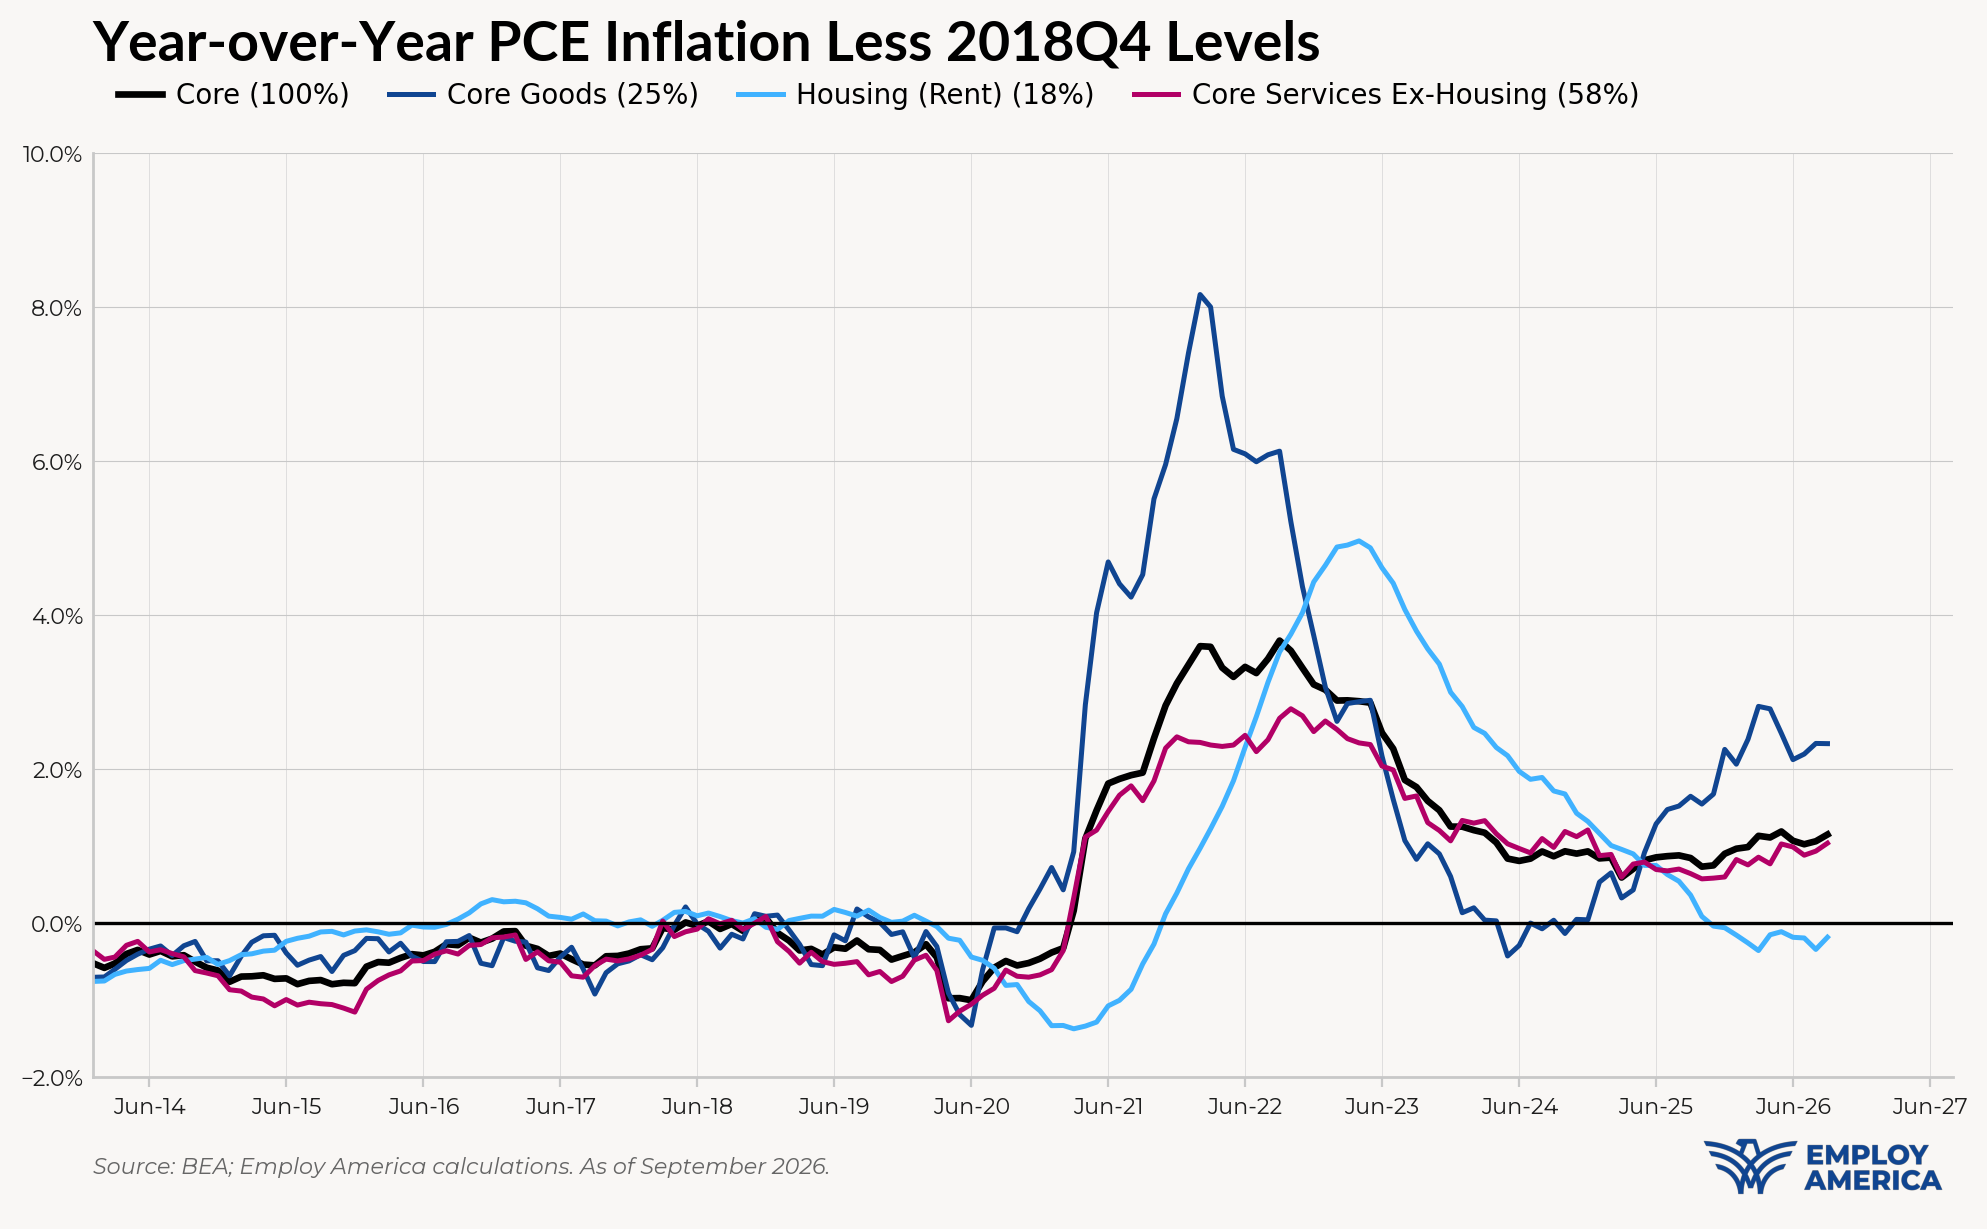
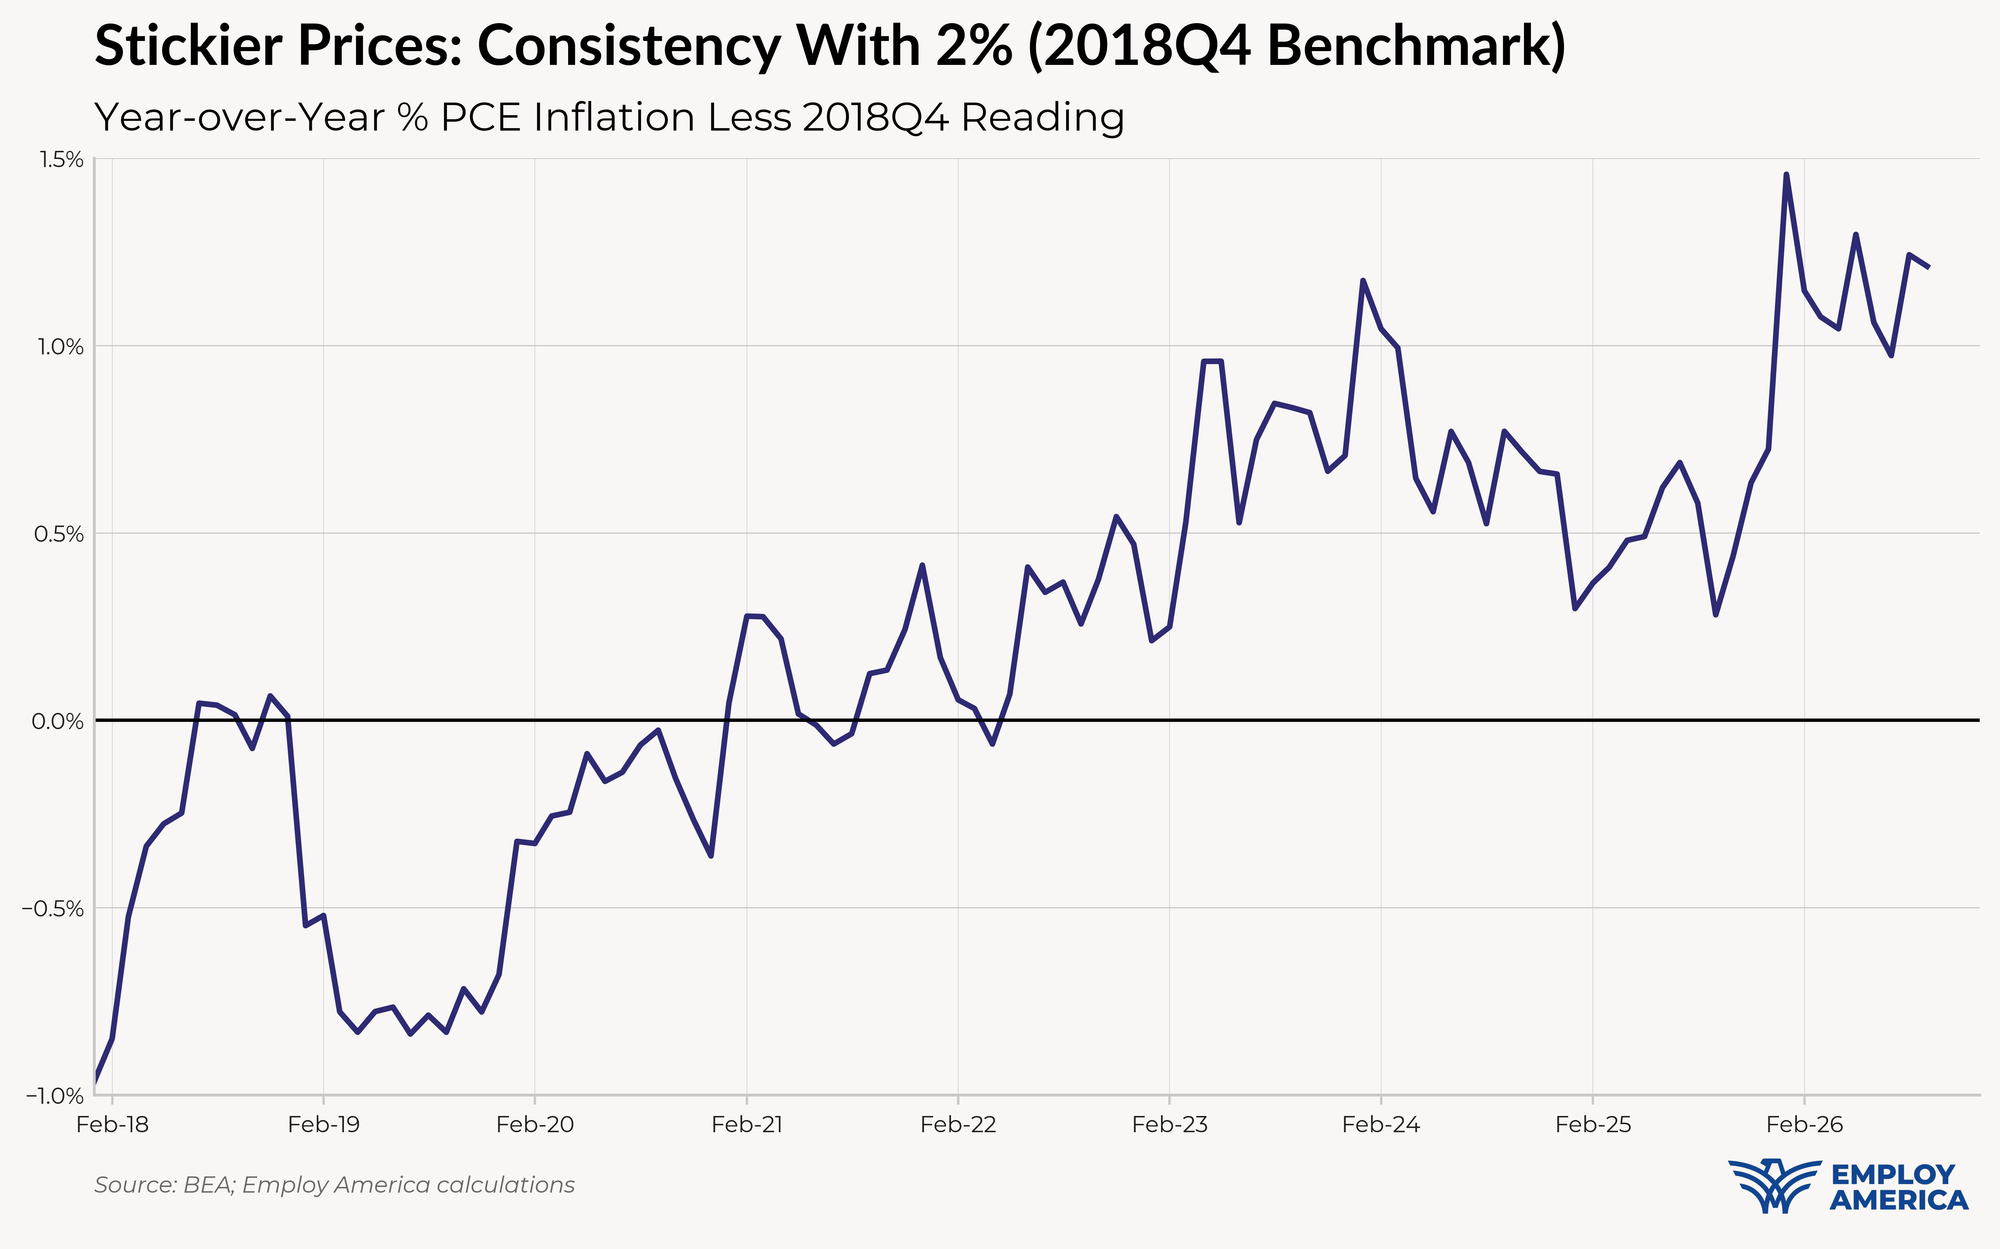
The September growth rate in "Core Services Ex-Housing" ('supercore') PCE ran at a 3.60% year-over-year pace, a 101 basis point overshoot versus the ~2.59% run rate that coincided with ~2% headline and core PCE inflation.
September monthly supercore ran at a 4.49% annualized rate, a 190 basis point annualized overshoot of what would be consistent with 2% headline and core PCE.
The link has been copied!
Your link has expired. Please request a new one.
Your link has expired. Please request a new one.
Your link has expired. Please request a new one.
Great! You've successfully signed up.
Great! You've successfully signed up.
Welcome back! You've successfully signed in.
Success! You now have access to additional content.