It's About The Supply-Side: How The Phillips Curve 'Motte-and-Bailey' Misses and Misspecifies Inflation Dynamics

Inflation and interest rates remain high enough that now is not a time for 'soft landing' victory laps, but the growing and broadening evidence of price deceleration warrants a deeper dive. If the Fed's role in achieving disinflation runs through "cooling real demand," which is at the thrust of all Phillips Curve model specifications, recently realized disinflation is particularly vexing.
The Phillips Curve is most commonly and reductively understood to be a hard tradeoff between the level of the unemployment rate and the rate of consumer price inflation (or wage growth). The lower the level of unemployment, the higher the rate of inflation. The higher the level of unemployment, the lower the rate of inflation. The Phillips Curve can also be meant to imply something more flexible and less controversial: a positive pro-cyclical relationship between real economic activity and inflation. Other intervening factors, like inflation expectations and supply-side dynamics, are said to constrain the ability to observe this relationship.
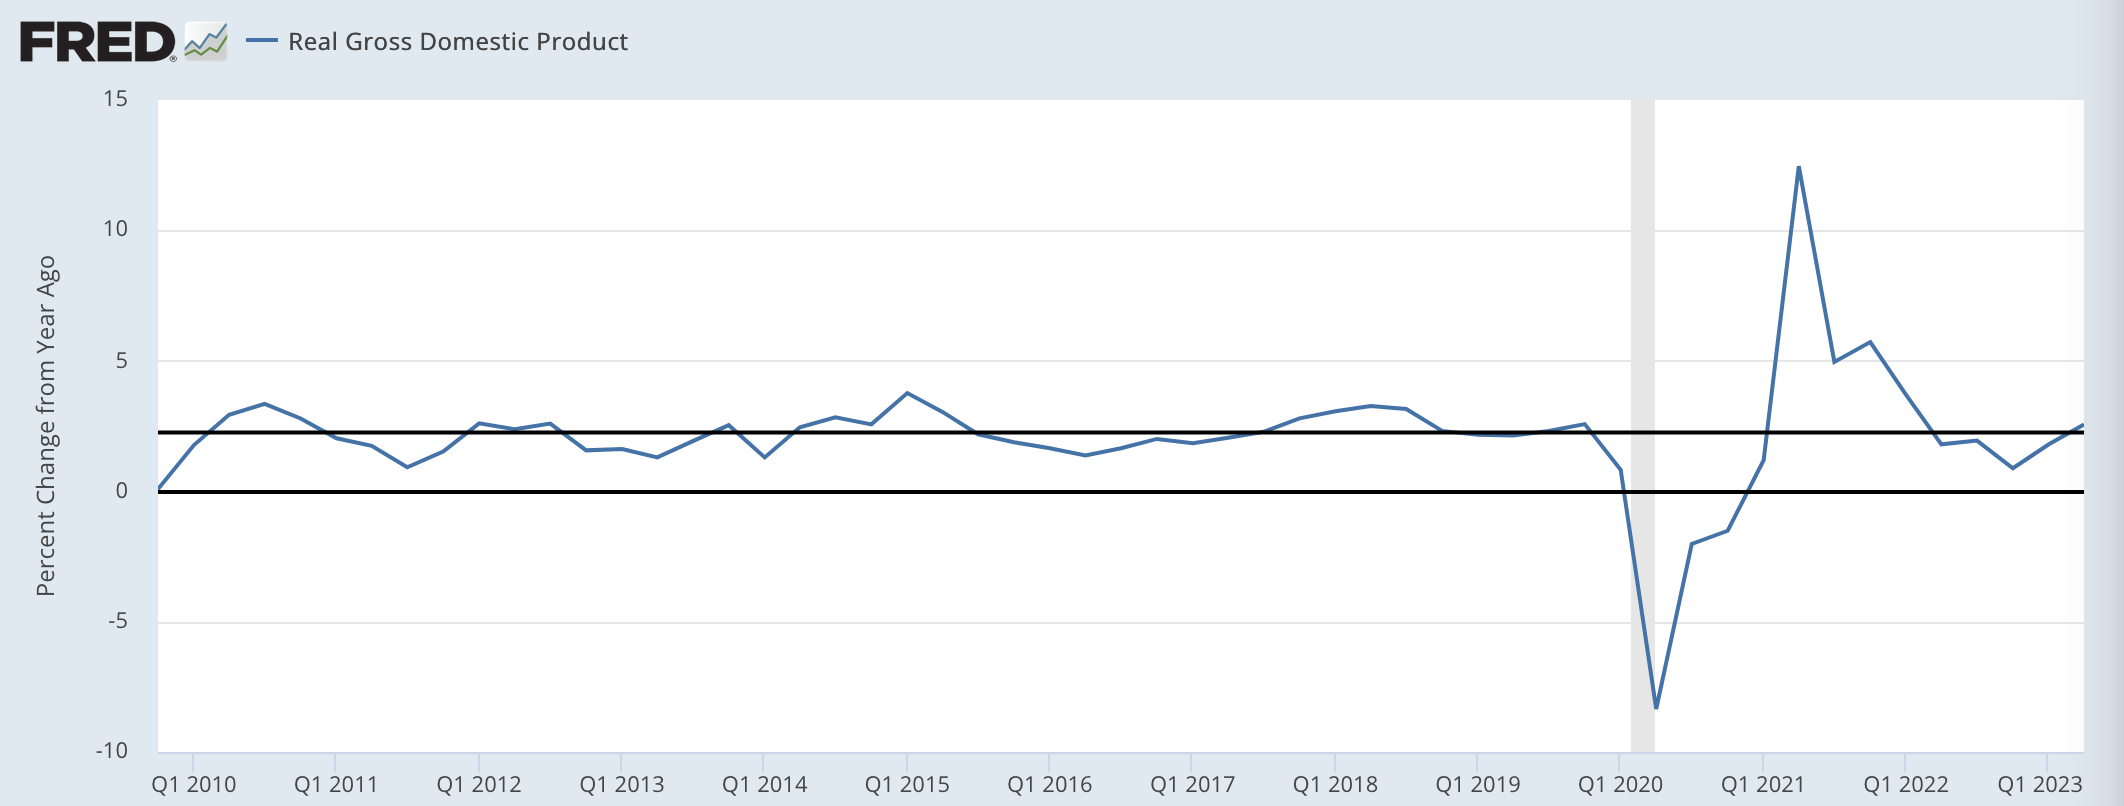
Even if we lean on the weaker versions of what the Phillips Curve stands for, the current US economic backdrop looks awkward. Unemployment has stayed low as inflation has begun to fall, that too in a more broad-based manner of late. Broader measures of labor market slack have fallen further, even as wages have decelerated. Over the last four quarters (2022Q3-2023Q2), real GDP has accelerated and is on track to run at a faster growth rate in 2023 than the 2% "trend" growth rate that dominated the 2010s. If the Fed is the cause of realized disinflation, it certainly has yet to play out according to the Phillips Curve mechanisms proclaimed, whether strong-form or weak-form, linear or nonlinear.
The recent evolution of the US economy highlights how a pandemic, a Russian invasion of Ukraine, and supply chain challenges can have durable and dynamic supply-side effects, all of which were highly impactful but took time to work through and potentially unwind. Emphasizing a presumed and trivial counterfactual—that without Fed hikes, inflation would have been worse at the margin—ultimately evades central questions about inflation dynamics over the past few years. Inflation has some procyclical (demand-driven) properties, but recent developments illustrate how inflation also has considerable acyclical (supply-relevant) properties. Inflation's procyclical properties would be better specified as a function of the growth rate in real economic activity and its nominal cognates, not the outright level. The growth rate of employment has more robust bearing on the growth rate of prices than does the level of unemployment (or real GDP).
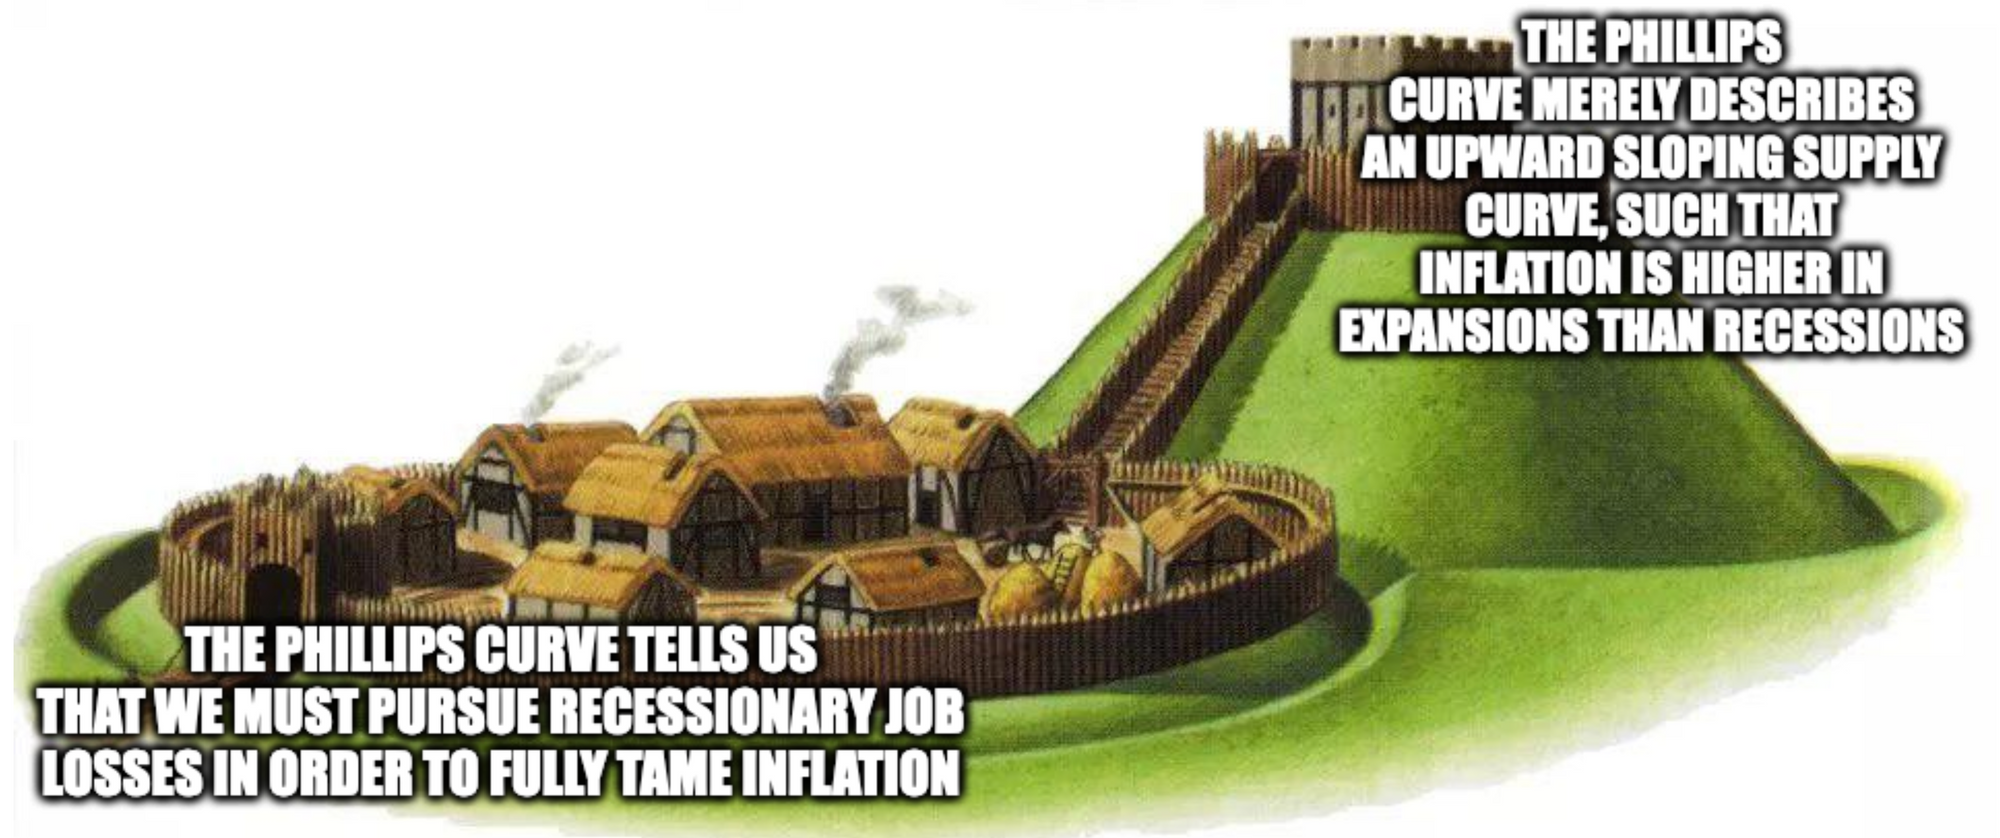
We have seen a rush of defenses of the Phillips Curve from academics amidst this awkward data backdrop. On some level, these defenses are justified, but they highlight a divergence in what is meant by the Phillips Curve. The "motte-and-bailey" meme summarizes the difficulty of pinning down and reconciling these defenses.
At least over the past 6-9 months, even the "Motte claim" is not a particularly compelling answer for why disinflation has materialized. To the extent the Fed is reducing real demand relative to counterfactual outcomes, it seems to be coinciding with other factors that are keeping real activity quite resilient while still nevertheless facilitating lower inflation.
The Fed has hiked interest rates at a historically rapid pace, and inflation rates are generally falling on most gauges (albeit still not back to the Fed's 2% target). But for the loudest advocates for aggressive monetary policy tightening, there are glaring facts about the United States economy that run contrary to how monetary policy tightening (interest rate hikes) was supposed to affect inflation. Since the Fed began hiking interest rates:
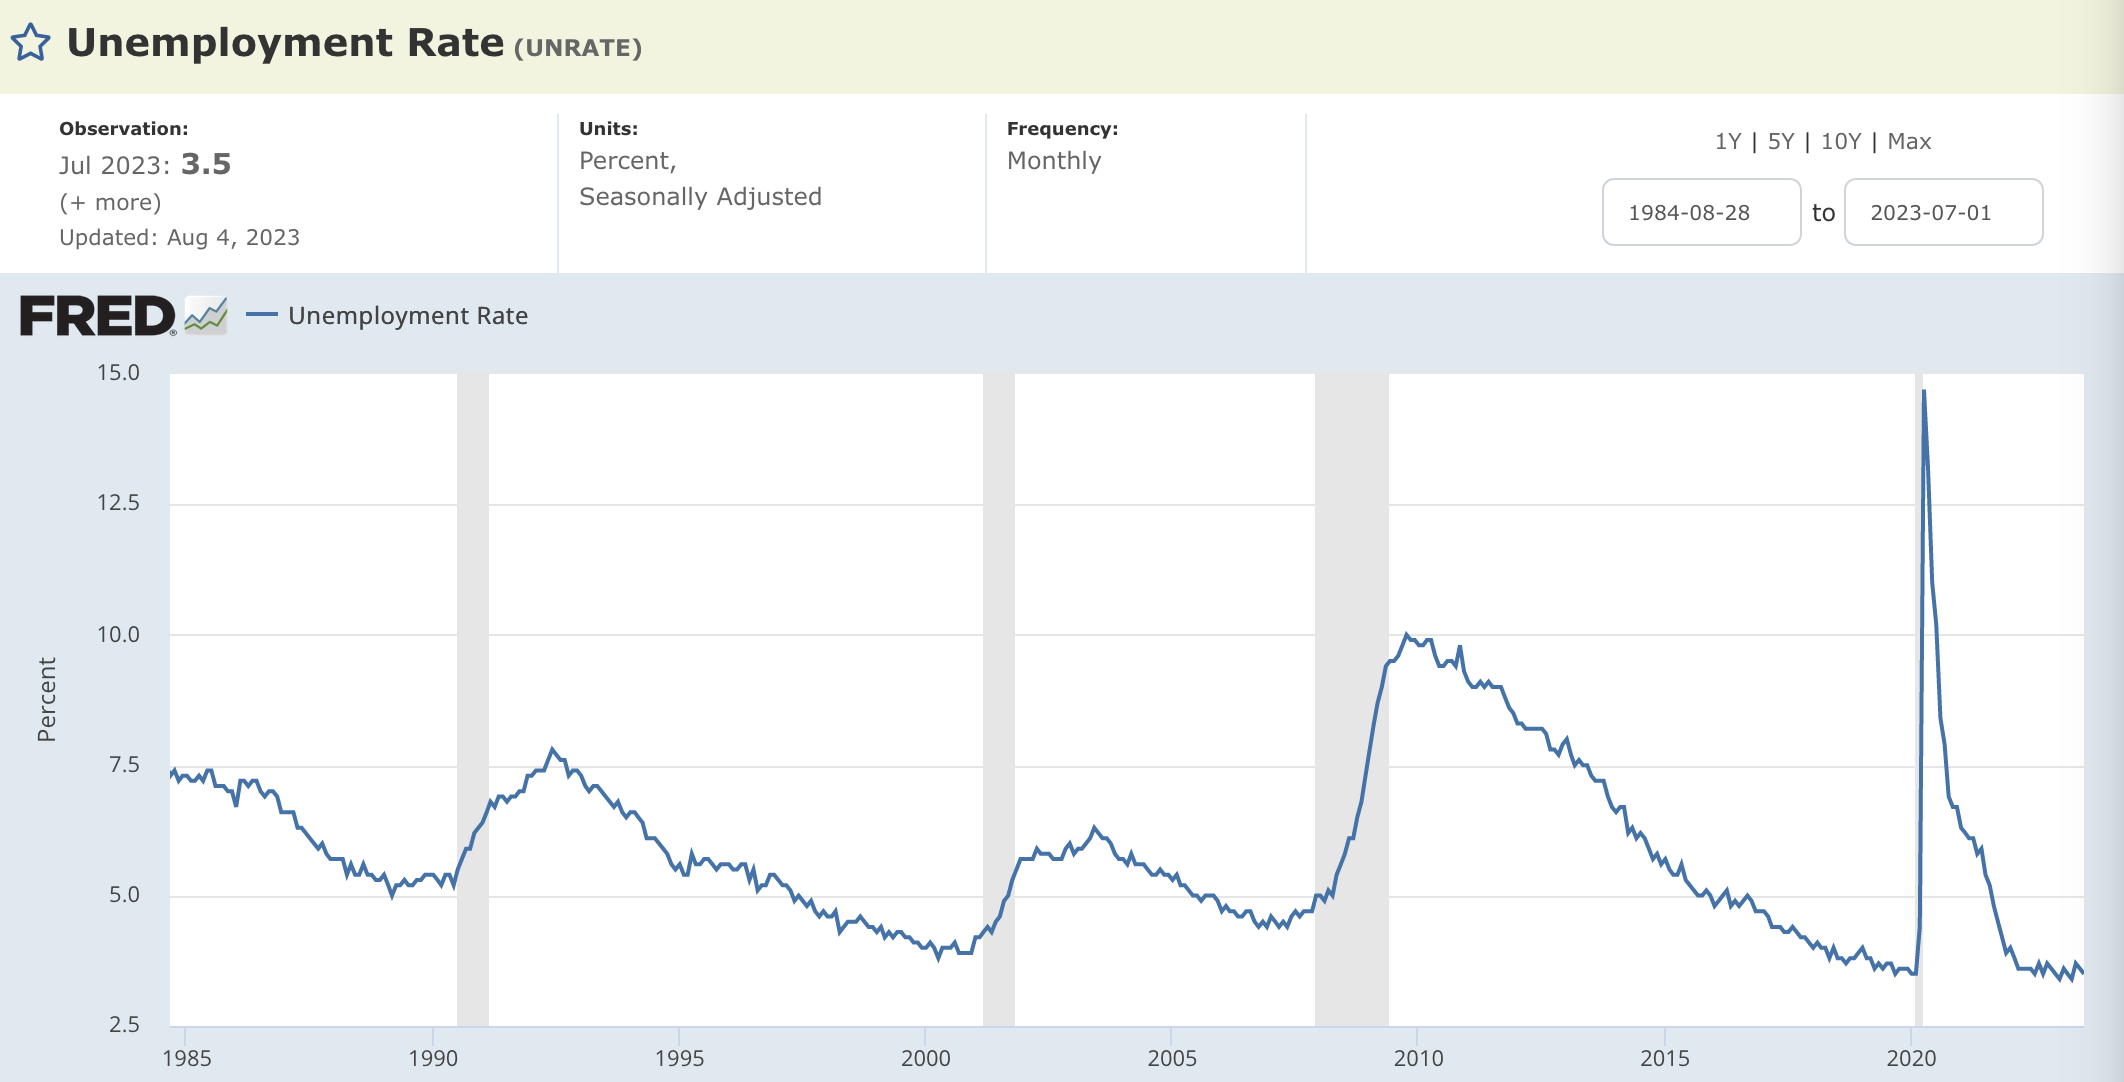
1. The unemployment rate remains historically low, and is marginally lower now than when the Fed began its monetary tightening campaign.
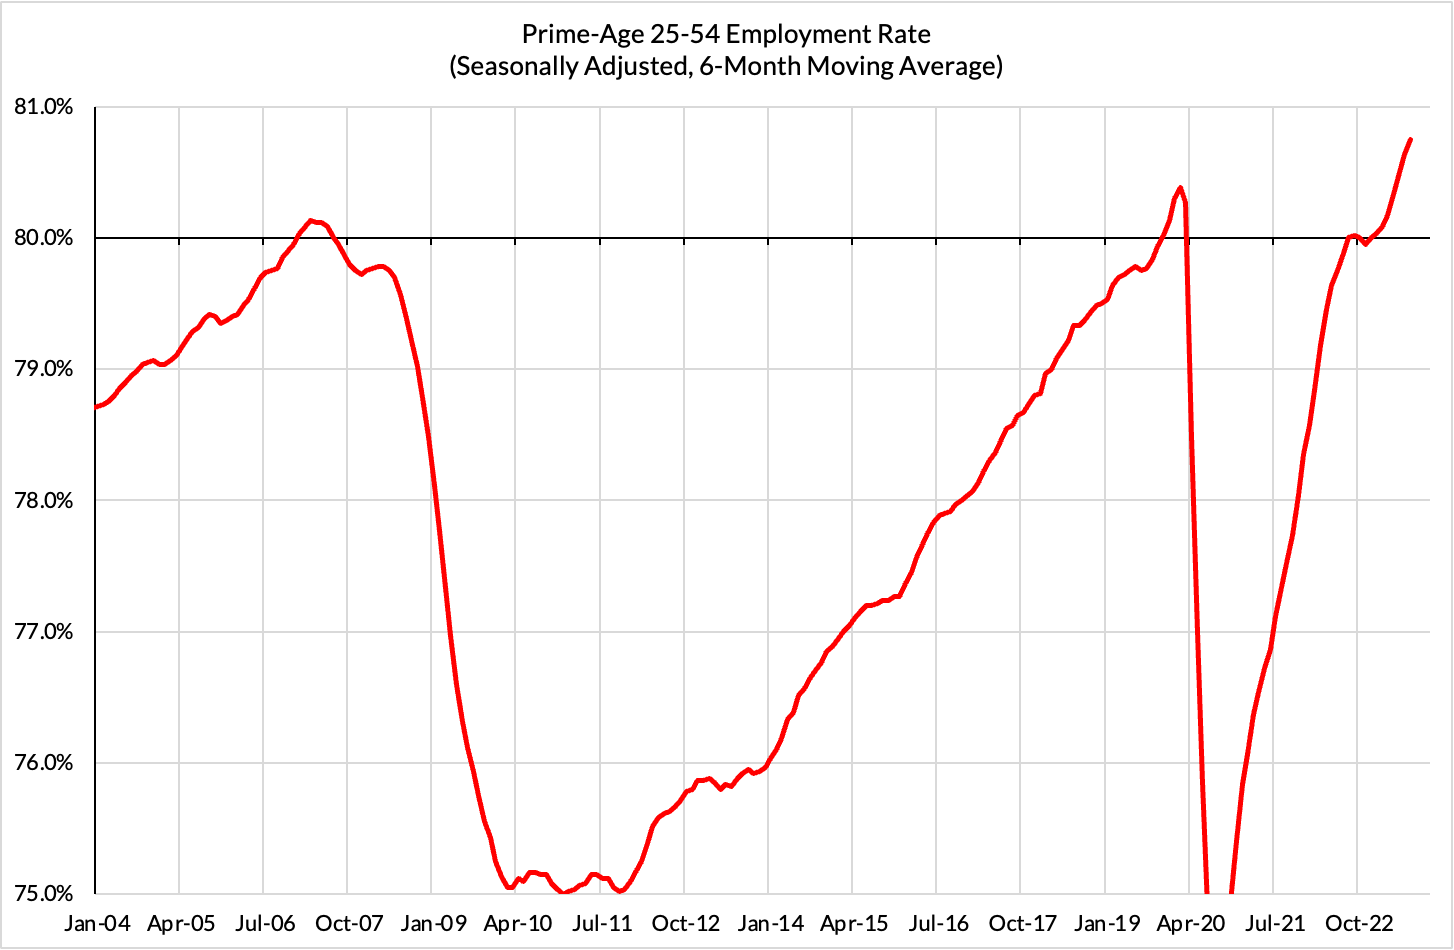
2. Broader measures of labor utilization, like the prime-age employment-to-population ratio, are at historic highs and have risen further, suggesting that "shadow labor market slack" has eroded further.
3. Real output growth has been accelerating in recent quarters.
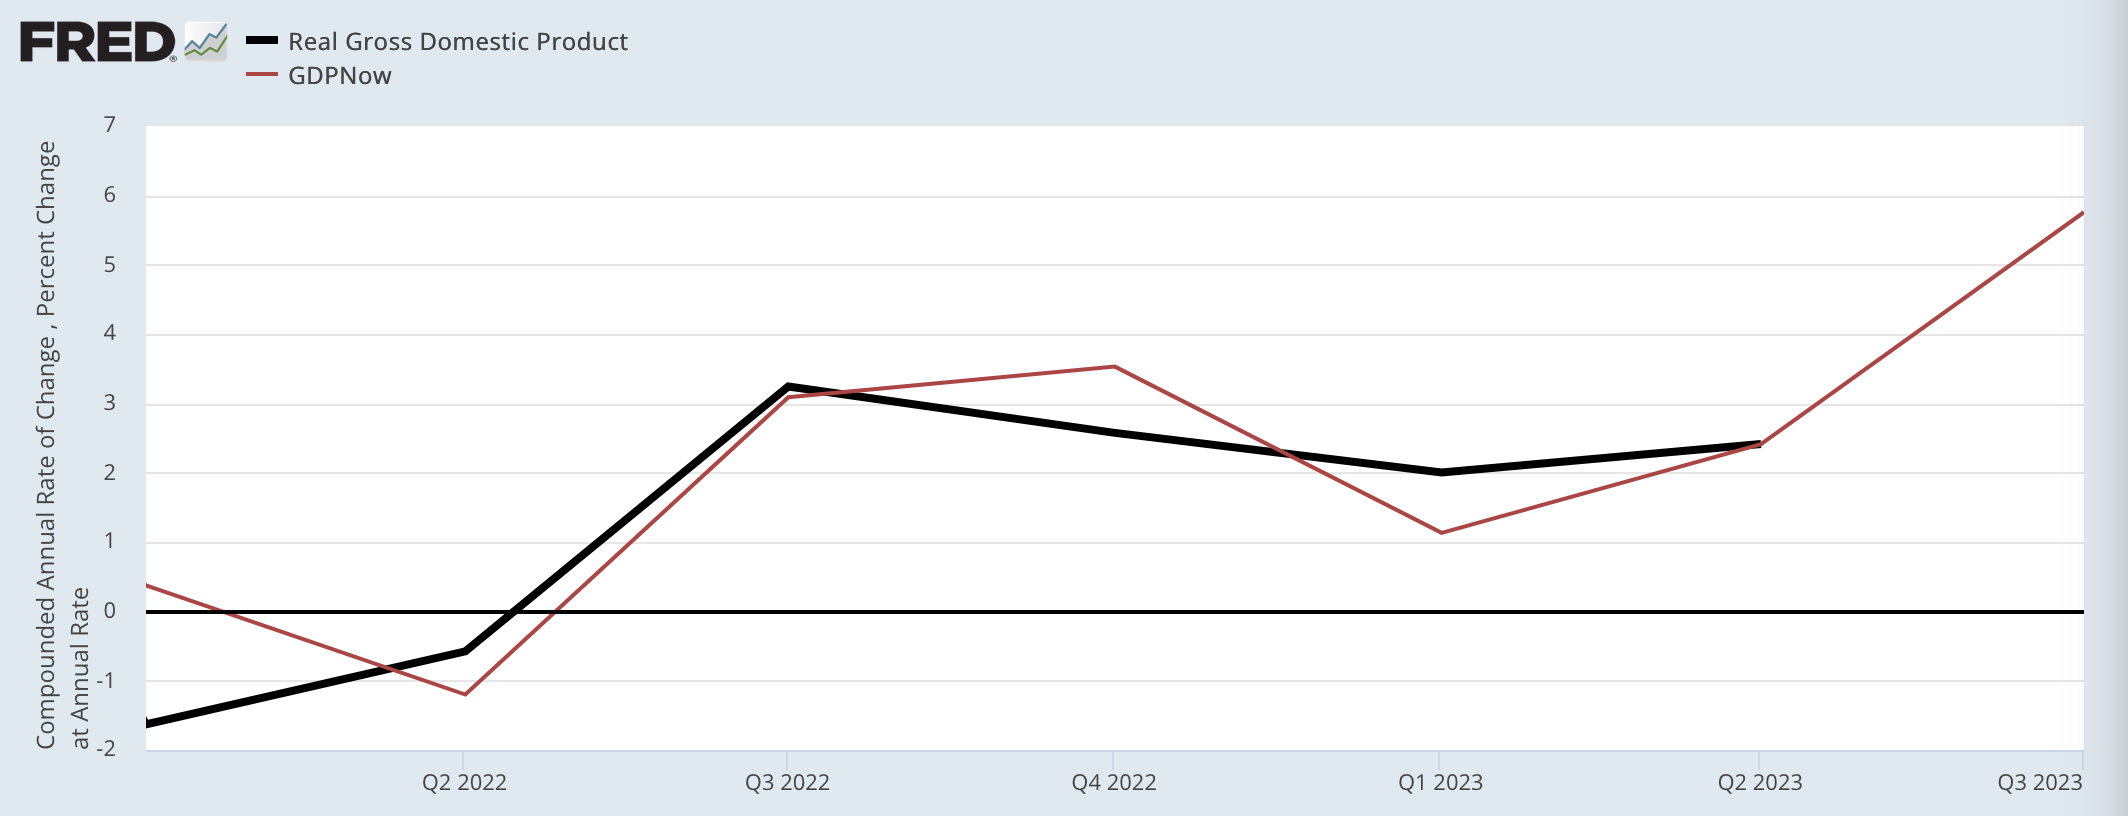
4. Real output growth has been running above the pre-prandemic trend growth rate of ~2-2.3%, both for 2023 and even on a year-over-year basis.
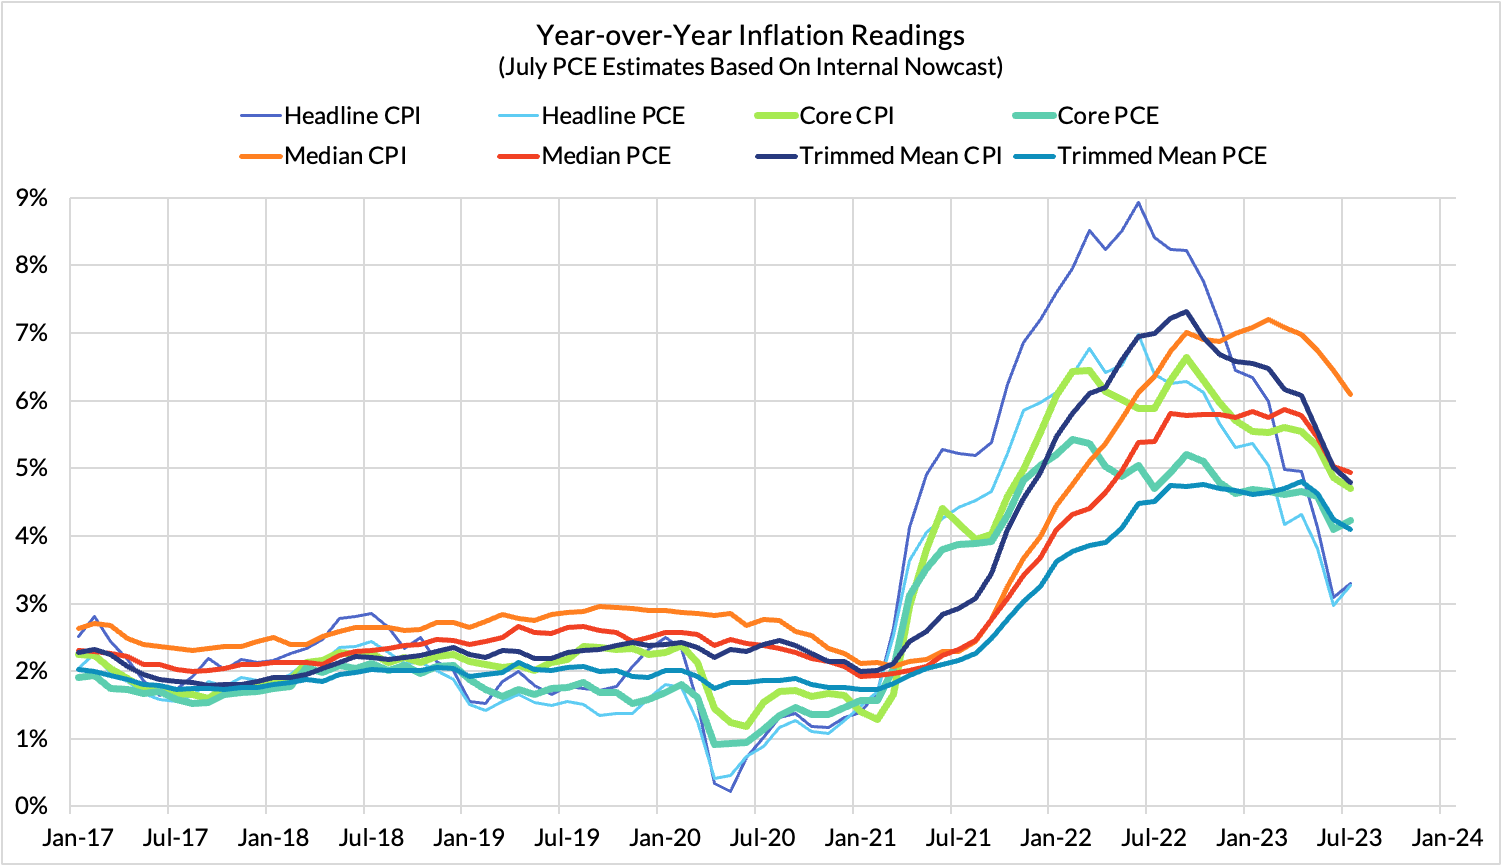
5. Price inflation is elevated but now falling on most headline, core, trimmed mean, and median measures.
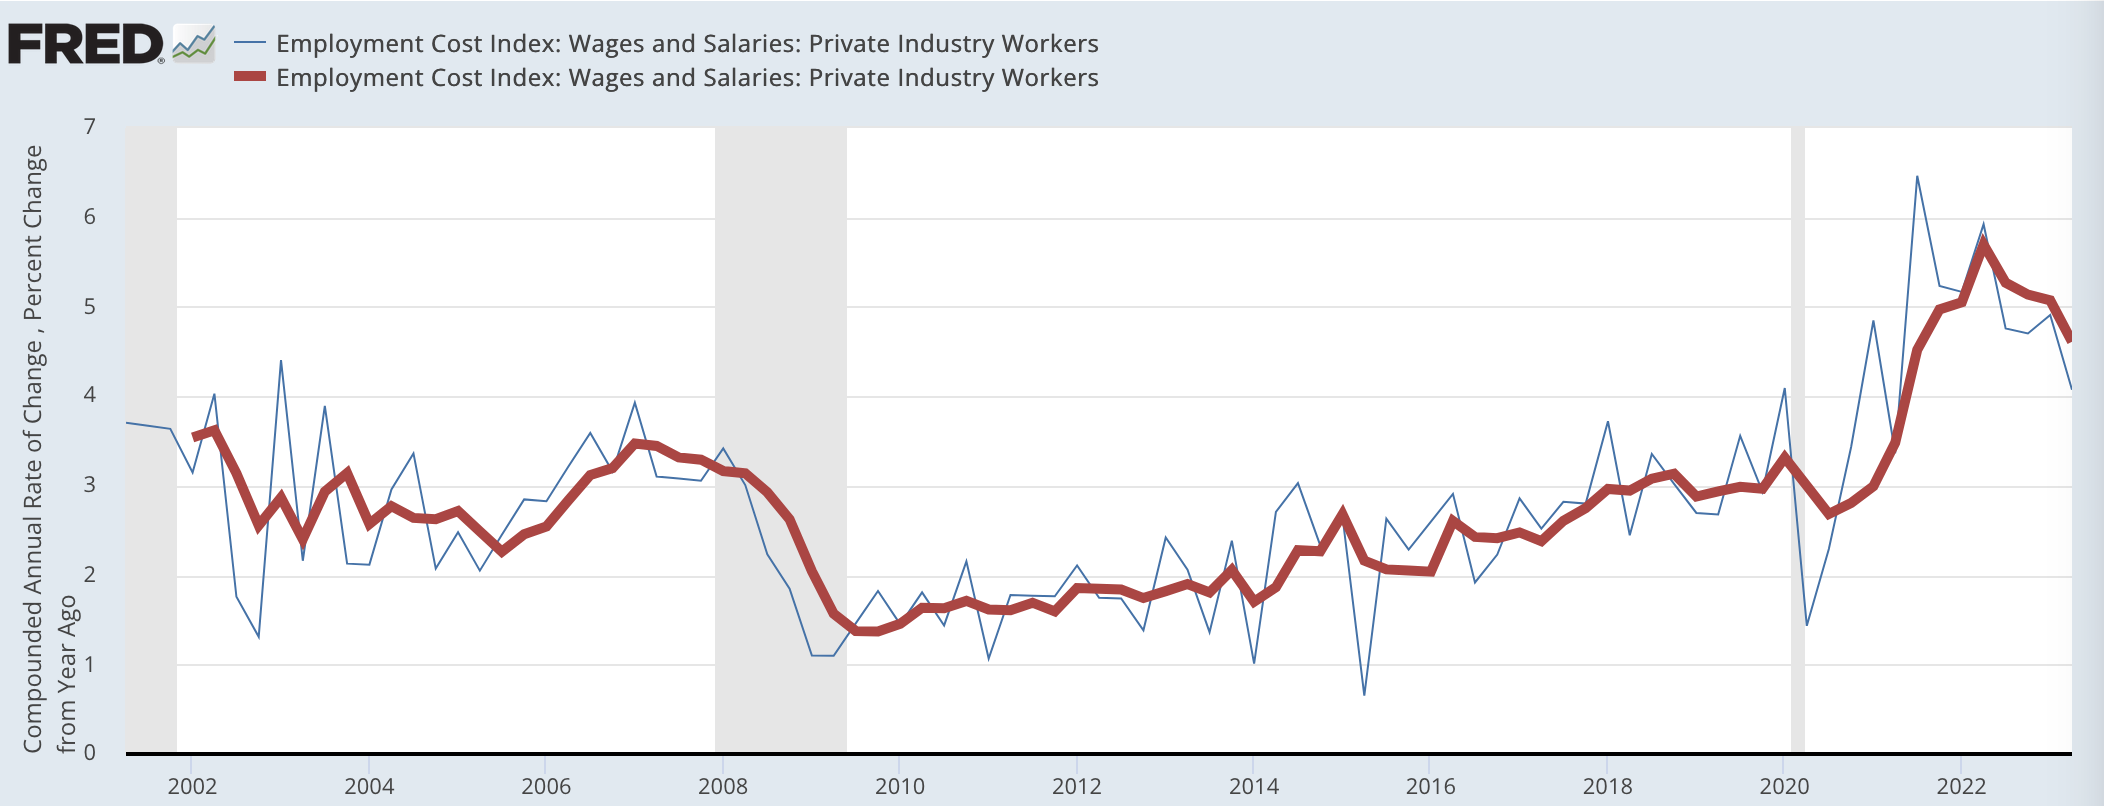
6. Wage growth is elevated but falling since the peak growth rates of mid-2022.
Most common model specifications of the Phillips Curve are rooted in labor utilization measures—the unemployment rate, an employment-to-population ratio, or other broad measures of labor market slack—relative to its "natural rate," or else the current level of real GDP relative to an estimate of potential GDP. Unless supply-side assessments of the natural rate of unemployment or potential GDP are sufficiently dynamic, standard Phillips Curve model specifications cannot reconcile the above six facts. Whatever the cause of realized inflation and wage growth, and however durable it may or may not prove to be, changes in labor utilization or the output gap are weak explanations. [See footnote below]
Some Phillips Curve models highlight the importance of nonlinearity—that a small reduction in real economic activity can deliver an outsized reduction in inflation. There are some good reasons to believe in nonlinearity when thinking about the nature of procyclical dynamics, but if this were a good explanation for the current moment, we should at least be able to see slower economic growth to coincide with current disinflation, even if not an outright contraction in output. But what we actually see is the opposite: local real output acceleration, well above sticky trend-based estimates of potential output growth.
Did the Fed reduce demand relative to the counterfactual? Sure. Would inflation otherwise be higher? Presumably at the margin; one likely mechanism stemmed from how higher rates slashed lofty valuations, catalyzing some narrow hiring freezes, layoffs, and foregone consumption in the process. But these magnitudes are not particularly compelling amidst an otherwise strong labor market. Nor can these demand-side mechanisms be neatly squared against more clearly identifiable collateral costs to future supply, stemming from higher financing costs (see: homebuilding).
Counterfactual defenses of Fed policy can quickly slip into dodging the higher stakes inquiry: what were the magnitudes associated with the various causes of inflation (and disinflation) in the past three years? On this point, the most vocal proponents of extrapolating from Phillips Curve models deserve praise: at least their claims were concrete both in direction and magnitude. Whereas appeals to "central bank credibility" and inflation expectations take on an evidence-free quality, Phillips Curve proponents were generally clear about the scale of implied job loss they thought necessary. Recent disinflation generally fails to align with the magnitudes of job loss (or job vacancy reduction) posited, and perhaps that's why some of them understandably view recent disinflation to be trivial noise as a result.
The only serious way to reconcile the six facts above is to leave space for the supply curve to shift: economies are capable of repairing and augmenting capacity. Supply is a difficult variable to analyze because its true nature is heterogeneous and varies with the production structure of the economy. Nevertheless, we at Employ America strongly disfavor fudged macroeconomic analysis. Granular attempts at affirmative evidentiary identification are always better than simply claiming "well if it's not demand, then it must be supply." Such attempts give us a better opportunity to evaluate whether recent supply-side improvement can potentially endure and facilitate further disinflation in the future.
There are important facts that point to supply improvement, though their implications likely take longer to fully materialize than supply deterioration:
1. Supply chains are indeed healing and improving: Business surveys suggest that while not all shortages have been resolved and supply chains have not completely healed, they are healing and improving. Reported delivery times continue to shorten. Contracted ocean freight costs have begun to deflate more meaningfully. Retailers will take time to pass through the full benefits, especially since their cost structure may reflect higher contracted prices than current spot rates indicate. Nevertheless, we are are finally seeing broader goods deflation materialize on a monthly basis, just as nominal retail spending shows further resilience.
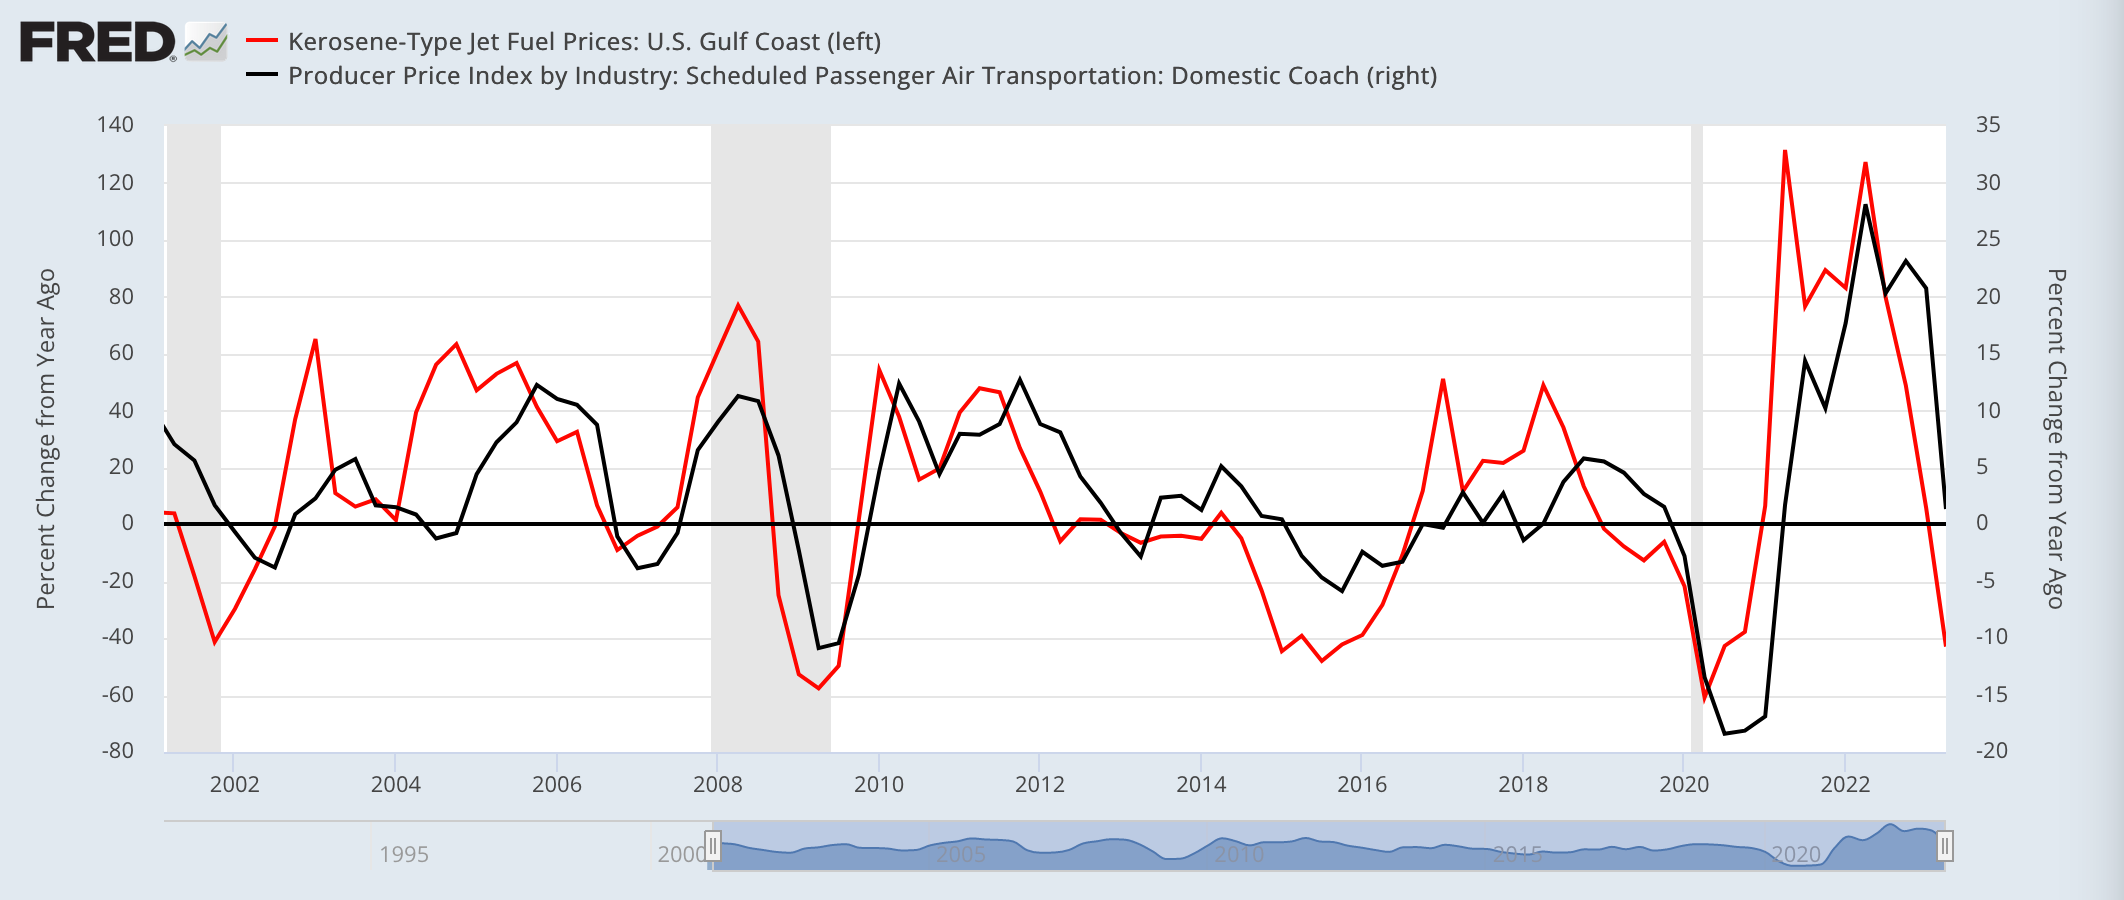
2. Commodity price effects tend to have particularly asymmetric passthrough implications, rockets on the way up and feathers on the way down. The impacts of record-high prices for jet fuel on airfares, and record-high diesel prices for food and food services were very noticeable in 2022.
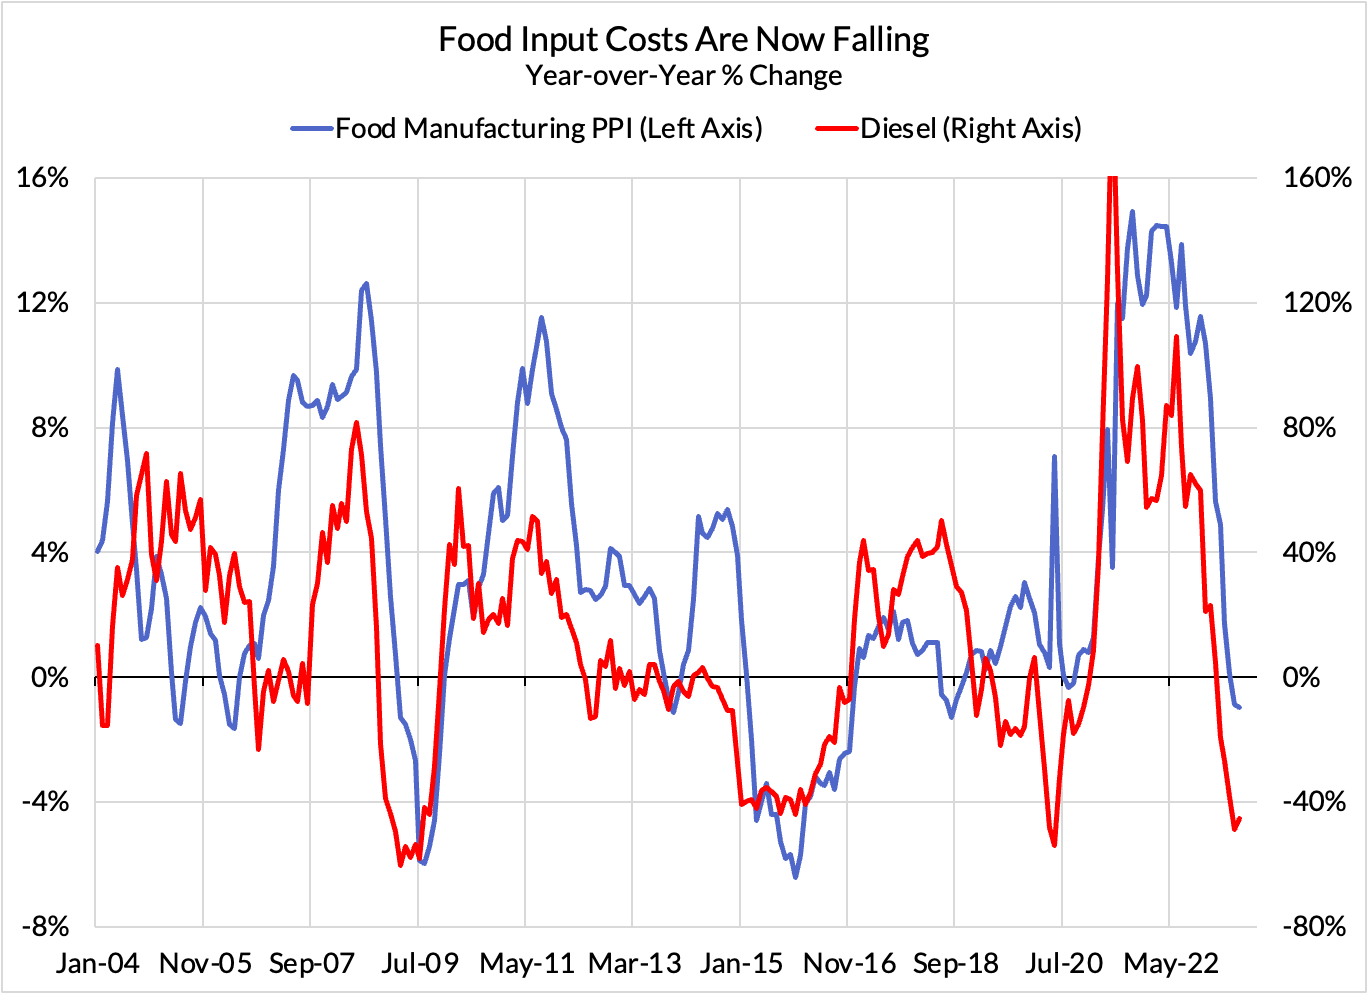
These energy commodity prices began falling about a year ago, but the downside passthrough implications for consumers are only now beginning to materialize. If the capacity to refine crude oil into diesel and jet fuel faced further challenges, the nascent disinflationary impulse could be jeopardized and could even reverse into a new inflationary impulse.

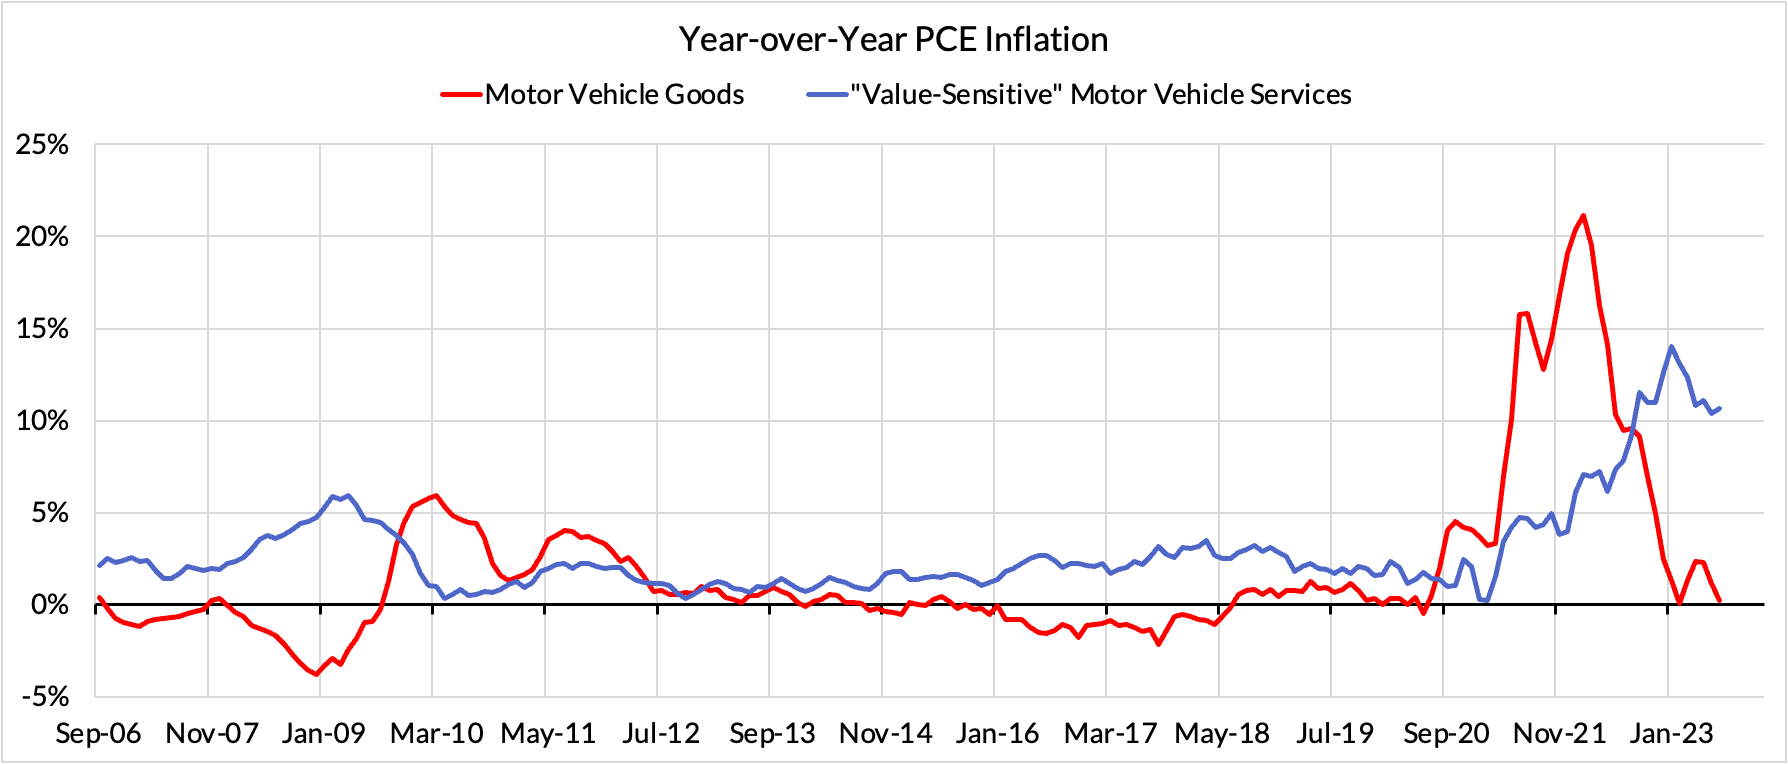
3. Automobile production has only just begun to normalize around pre-pandemic levels.
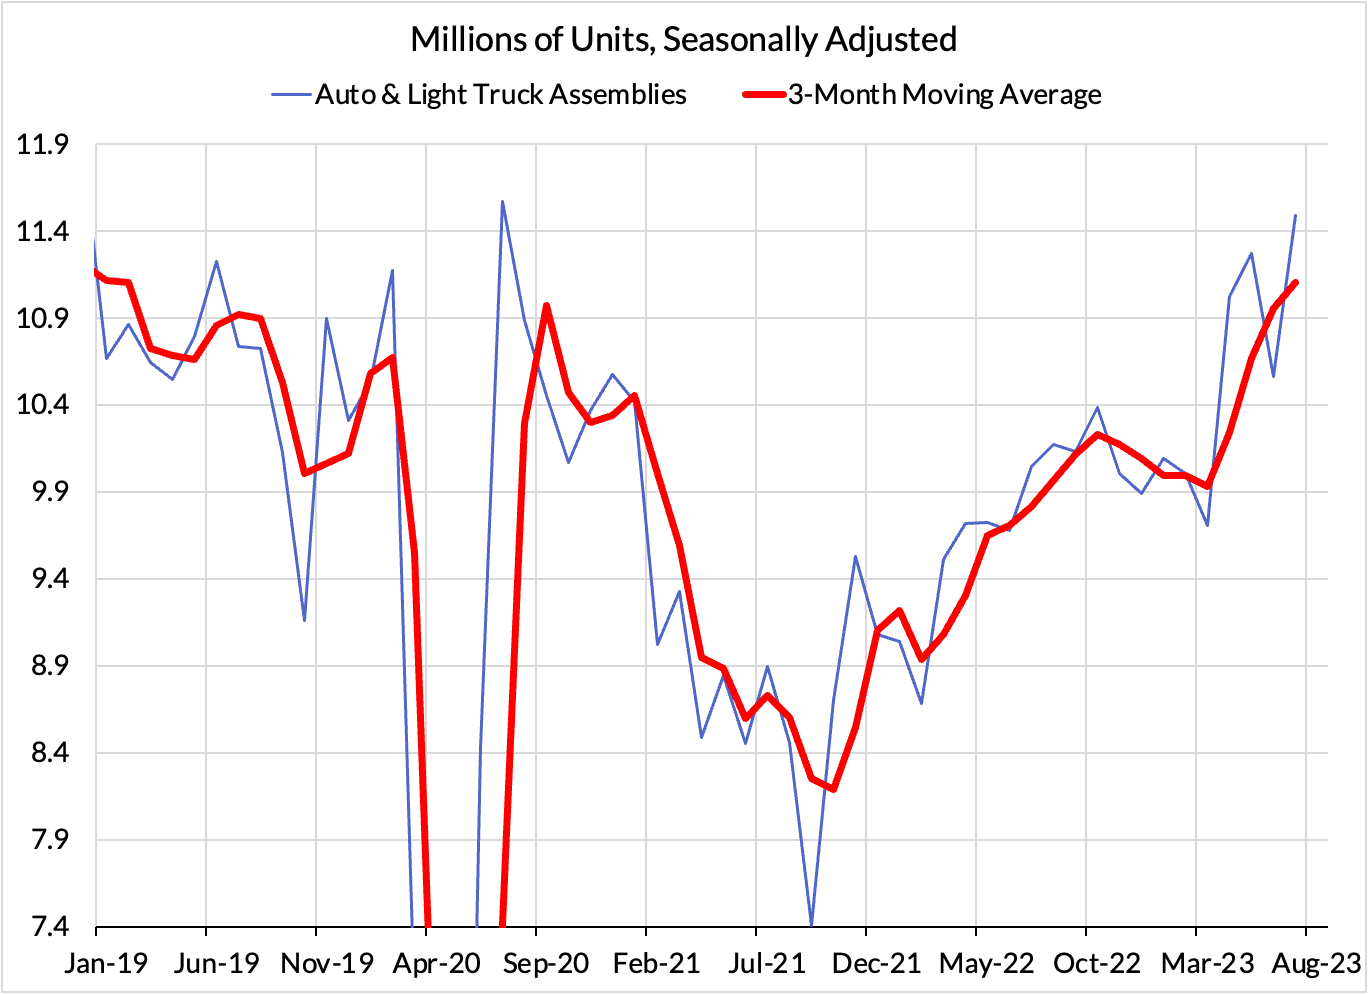
We are beginning to see the effects of improved supply on the prices of used cars, but it is still very early days. Over time, we should see the effects spread to the prices of new cars, vehicle parts, and equipment, as well as services tied to rental, leasing, maintenance, repair, and insurance.
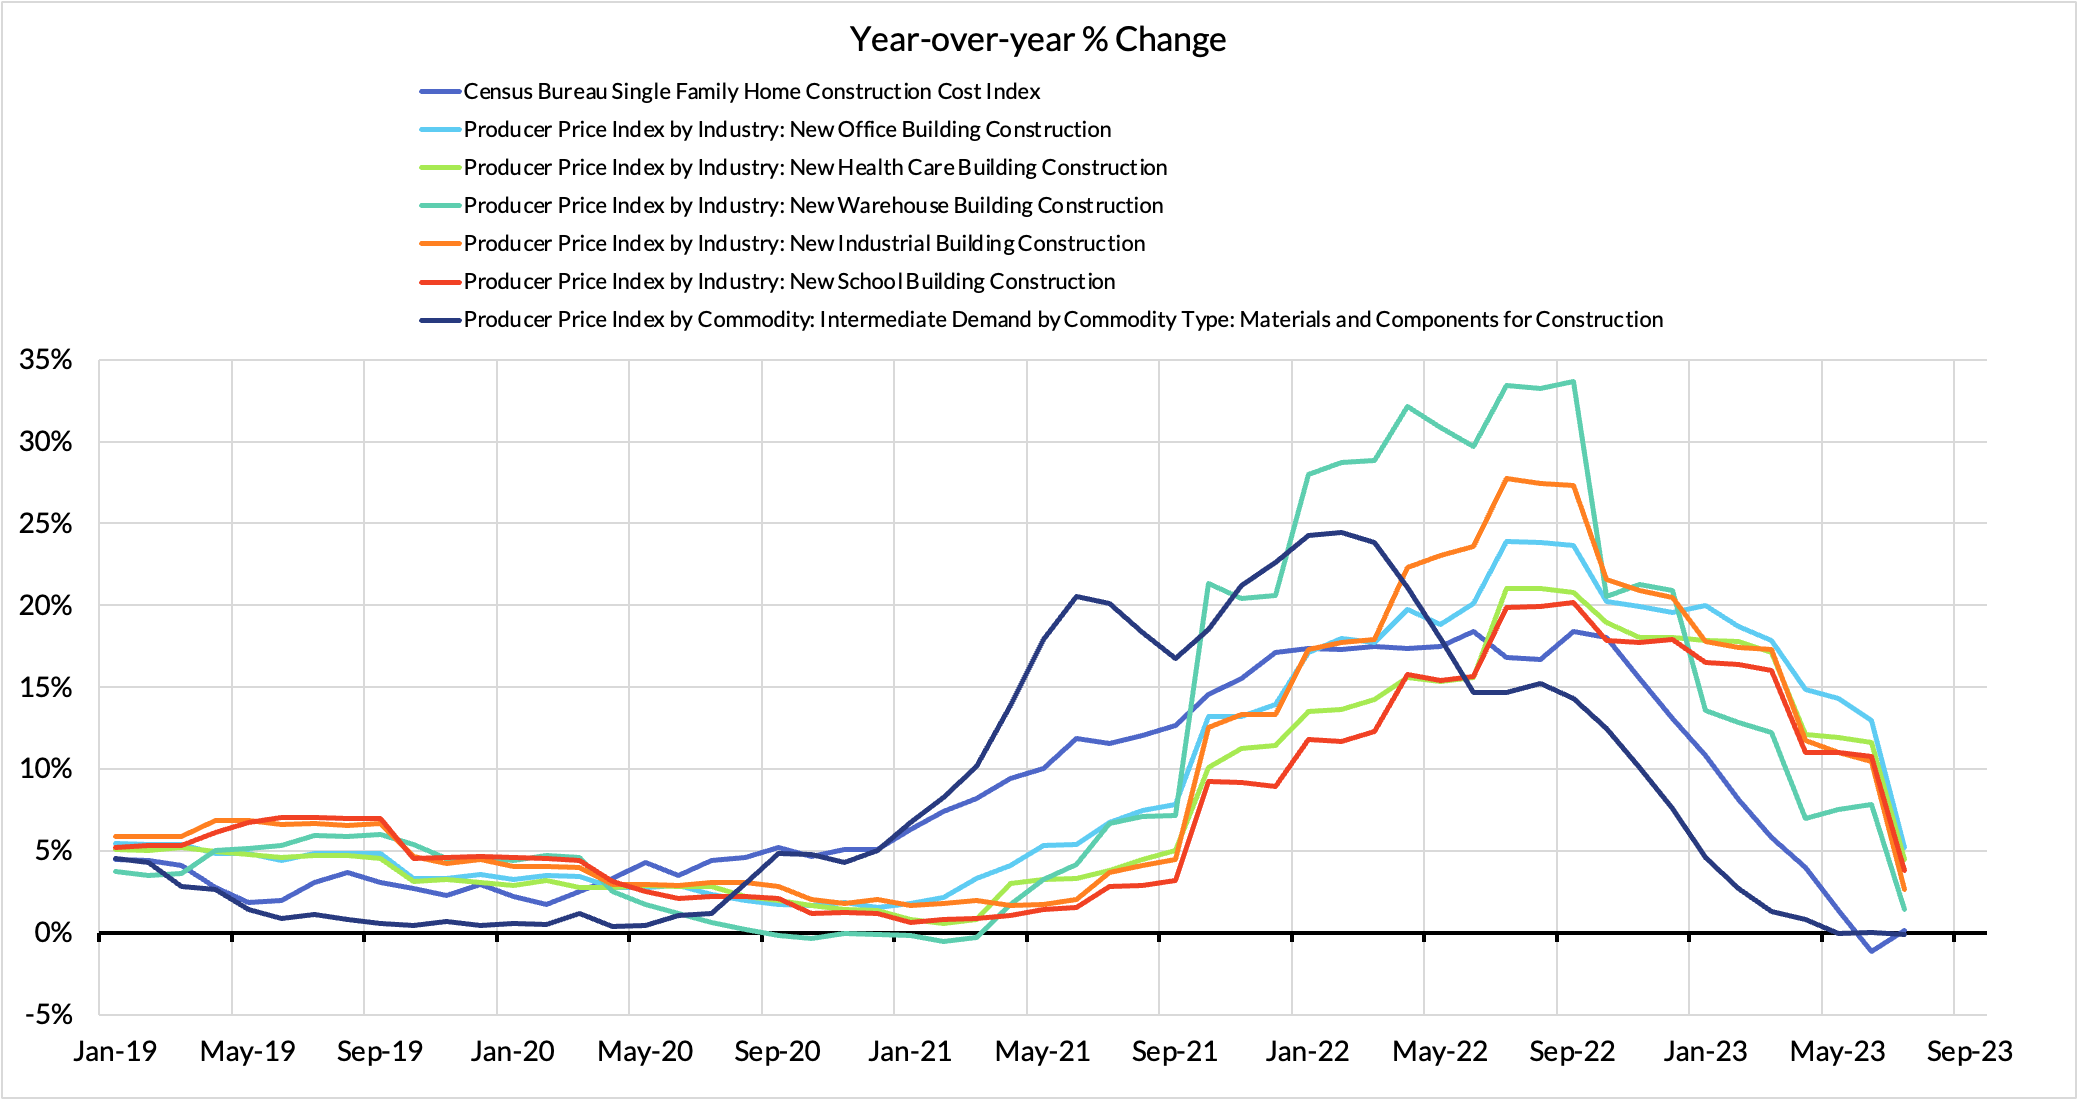
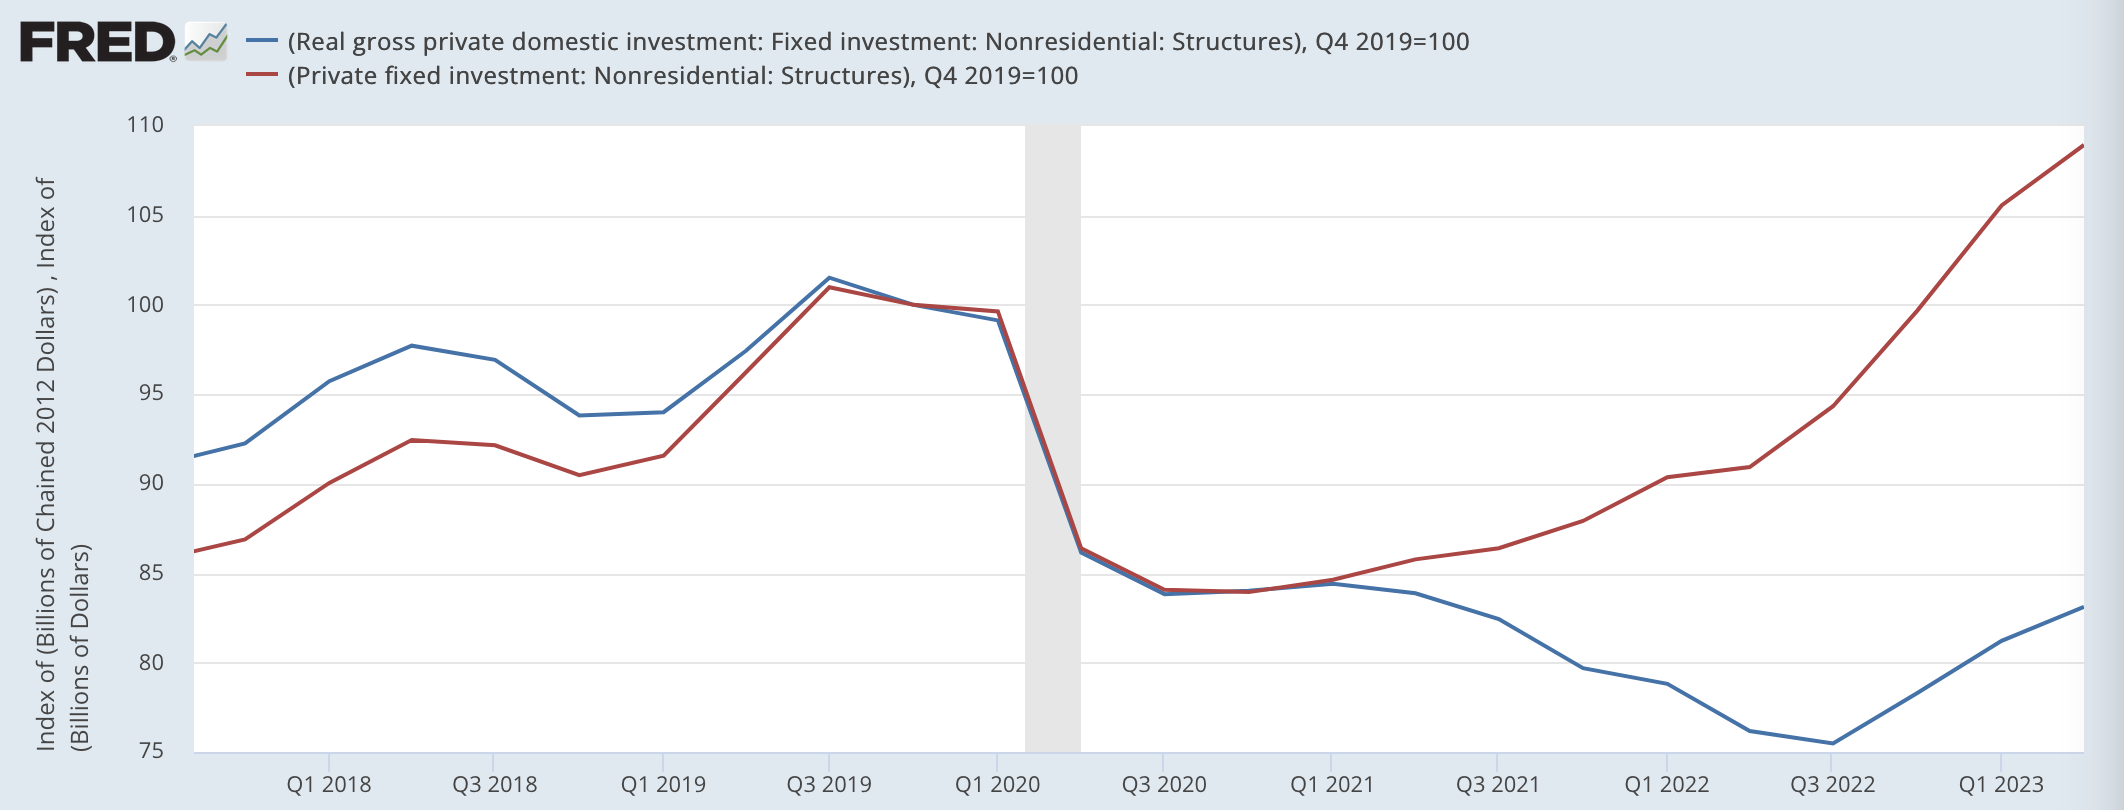
4. Construction cost indices are flattening after blowing out in 2021 and 2022. Throttled metals production in China drove up the price of key materials like steel and aluminum, exacerbating shortages. Those cost indices have been stabilizing over more recent quarters, allowing steady nominal construction spending growth to translate into improving real output now.
The supply-oriented view of inflation has been conflated with the notion that it would have only the most short-lived effects on the inflation data and affect only a narrow subset of inflation and real output subcomponents. Adverse supply shocks compounded over the course of 18 months and many of the shortages that ensued remain unresolved even over two and a half years. Persistent supply shocks with broad-based inflationary impact are more feasible than otherwise appreciated.
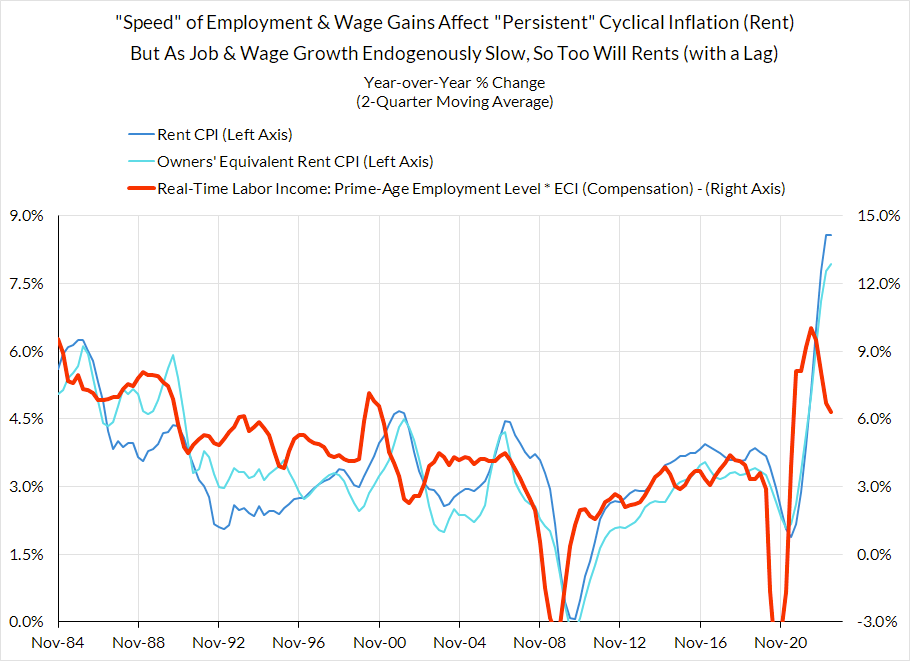
Does the role of supply shocks imply no role for demand in realized inflation? No. There are indeed components of inflation that are best described in terms of demand-driven processes. The surge in rent and owners' equivalent rent inflation was a direct byproduct of a period in which job growth (desirably) boomed.
As pandemic-related risk aversion subsided due to vaccines and reopening, airfares, lodging, and in-person recreation services all saw a demand surge that likely pushed up both real output/consumption and prices.
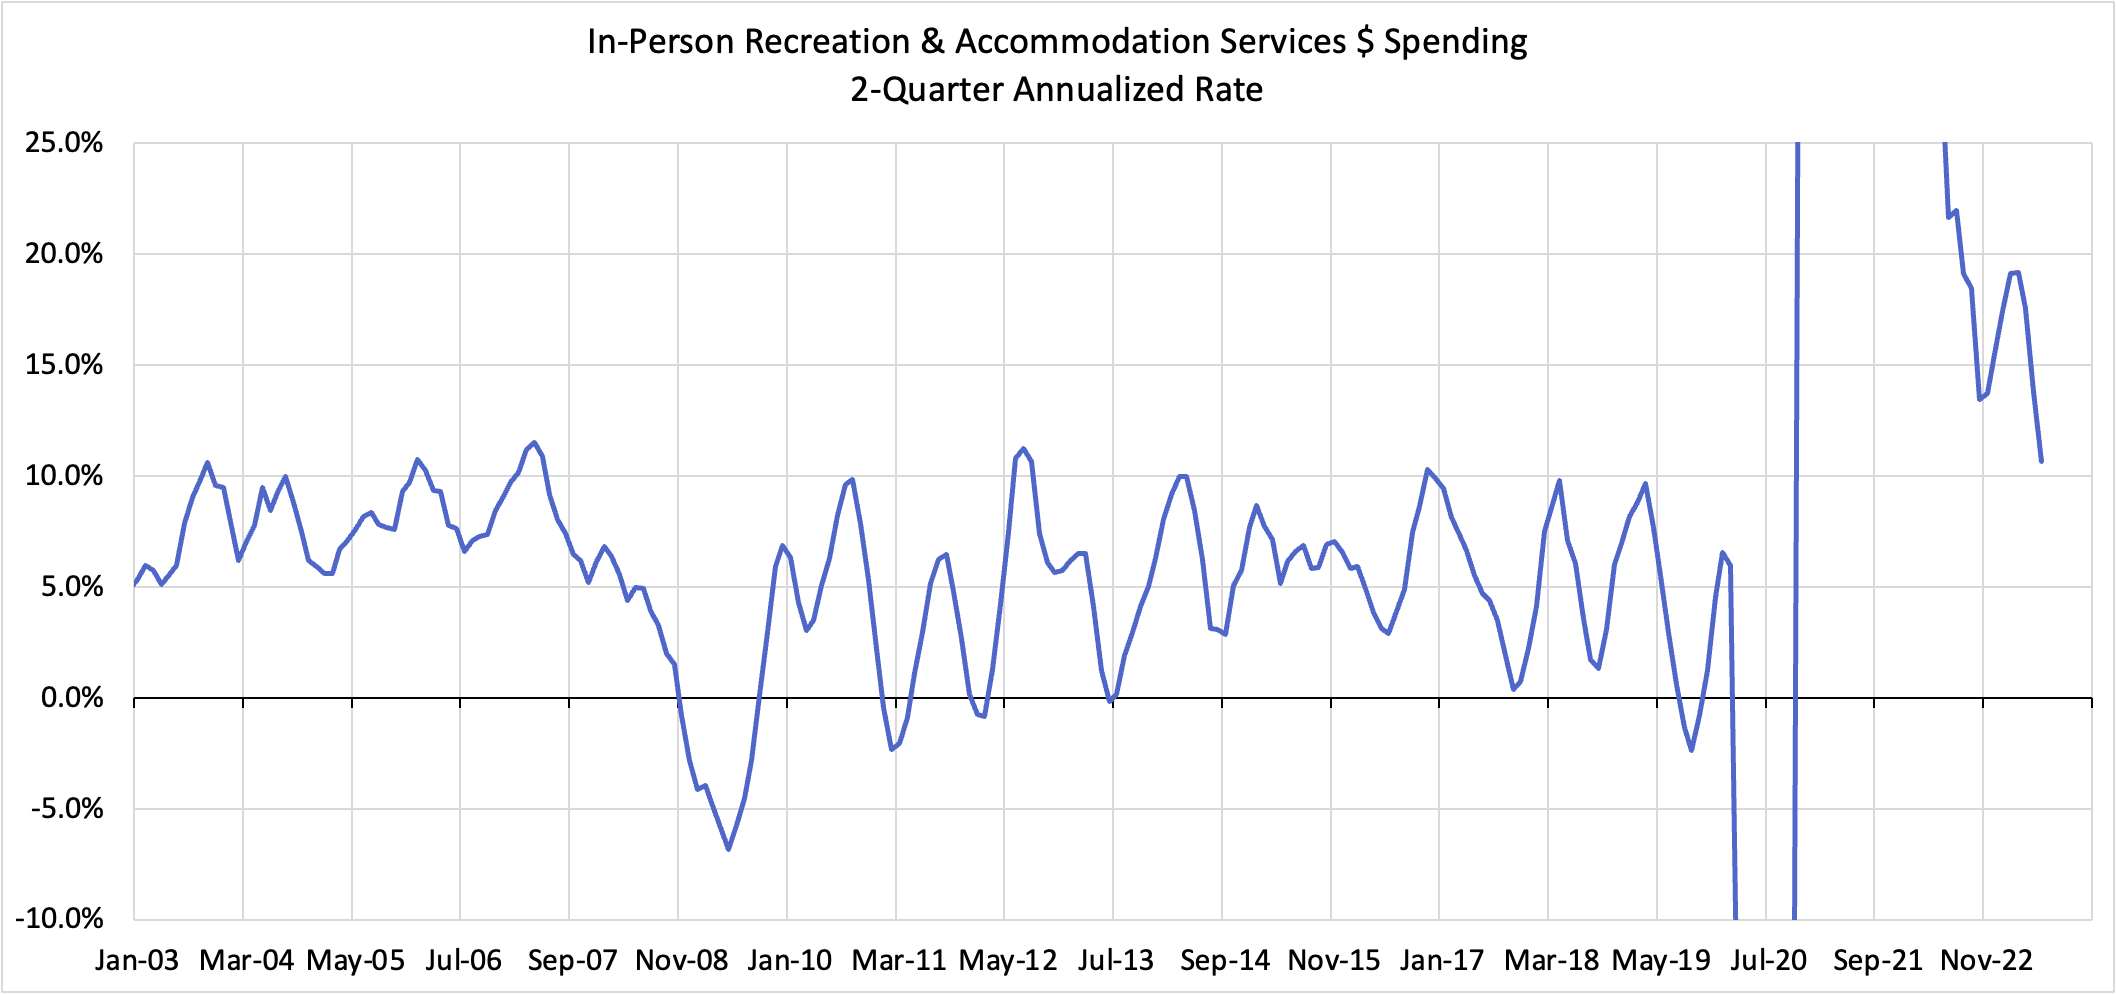
But all of these dynamics are finally beginning to dissipate. It was adjustment costs associated with a temporary surge in real activity growth that pushed up inflation rates. Once the adjustment costs of higher activity are fully borne, different possibilities can emerge. The outright level of real activity need not hamstring future inflation outcomes.
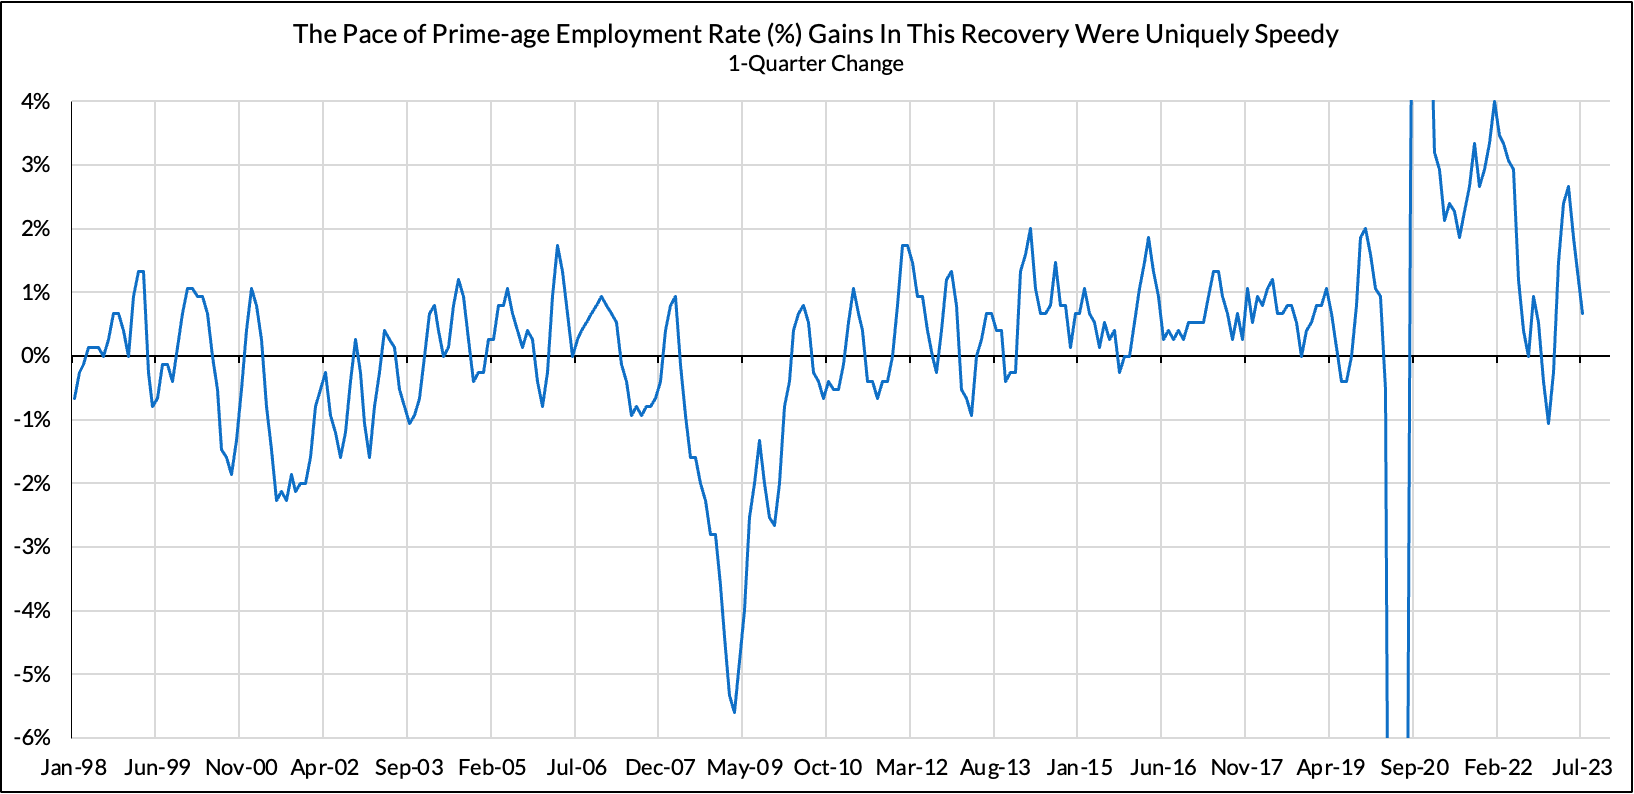
In the context of the labor market, we have seen a similar phenomenon. Impressive prime-age employment gains have transpired both in the period of nominal wage acceleration and deceleration; the rise itself is not inherently inflationary. But what might be more inherently inflationary—in a one-time sense—is the rapid speed of initial prime-age employment gains. The surge in employment tied to reopening likely involved elevated search costs and frictions for employers and workers, especially as there was substantial reallocation of the American workforce away from their original industries and into different ones.
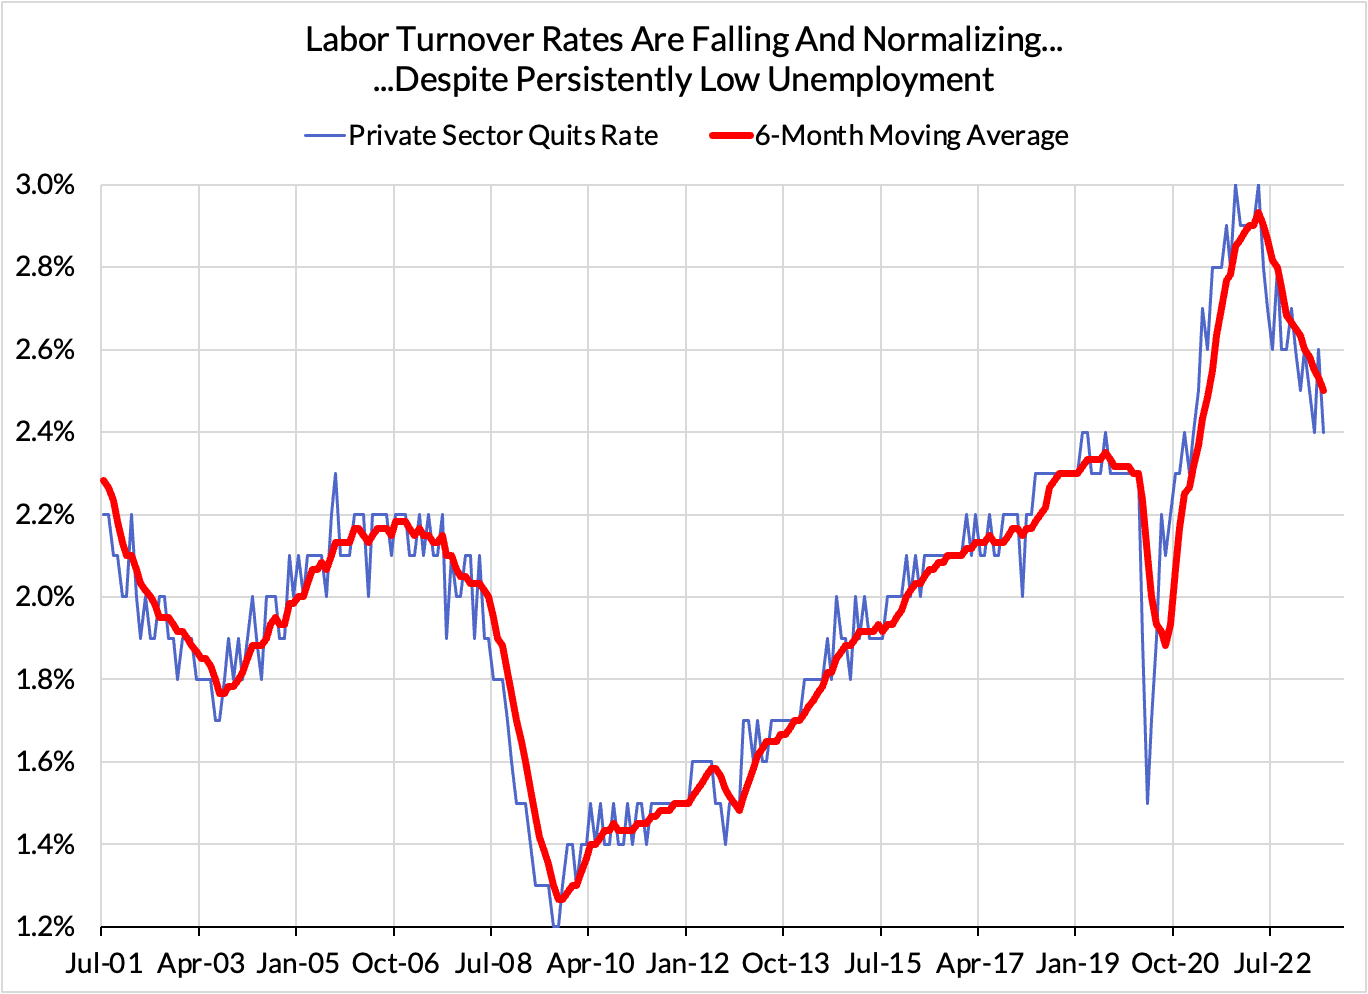
This process also led to a temporarily high-churn economy in which workers were able to voluntarily switch jobs, and firms seeking to hedge the risk of high labor turnover compensated more competitively.
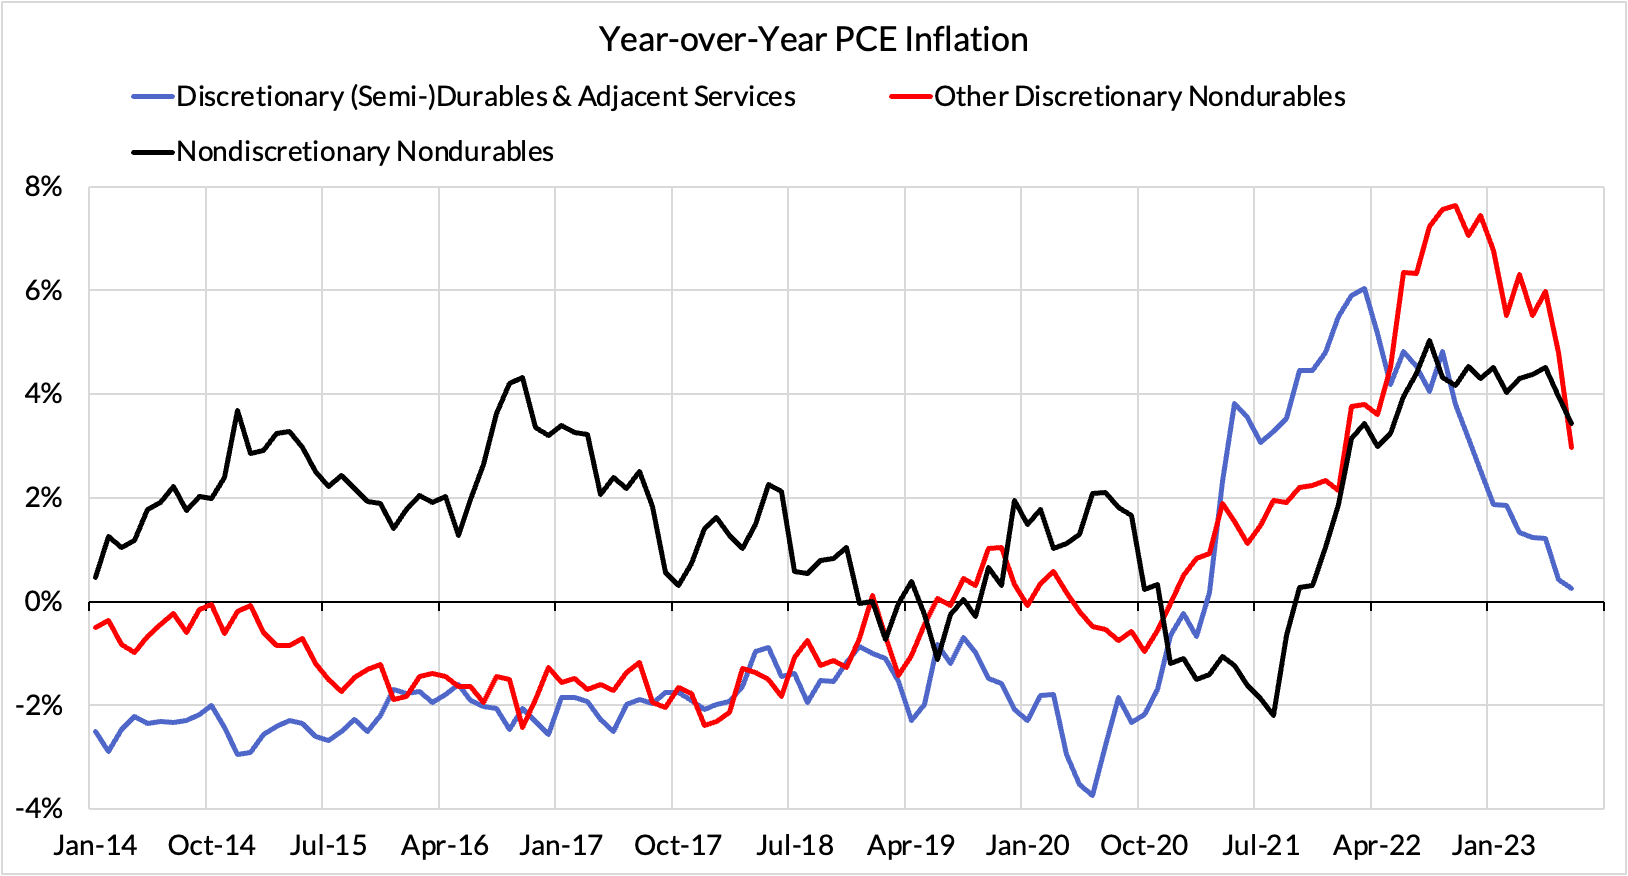
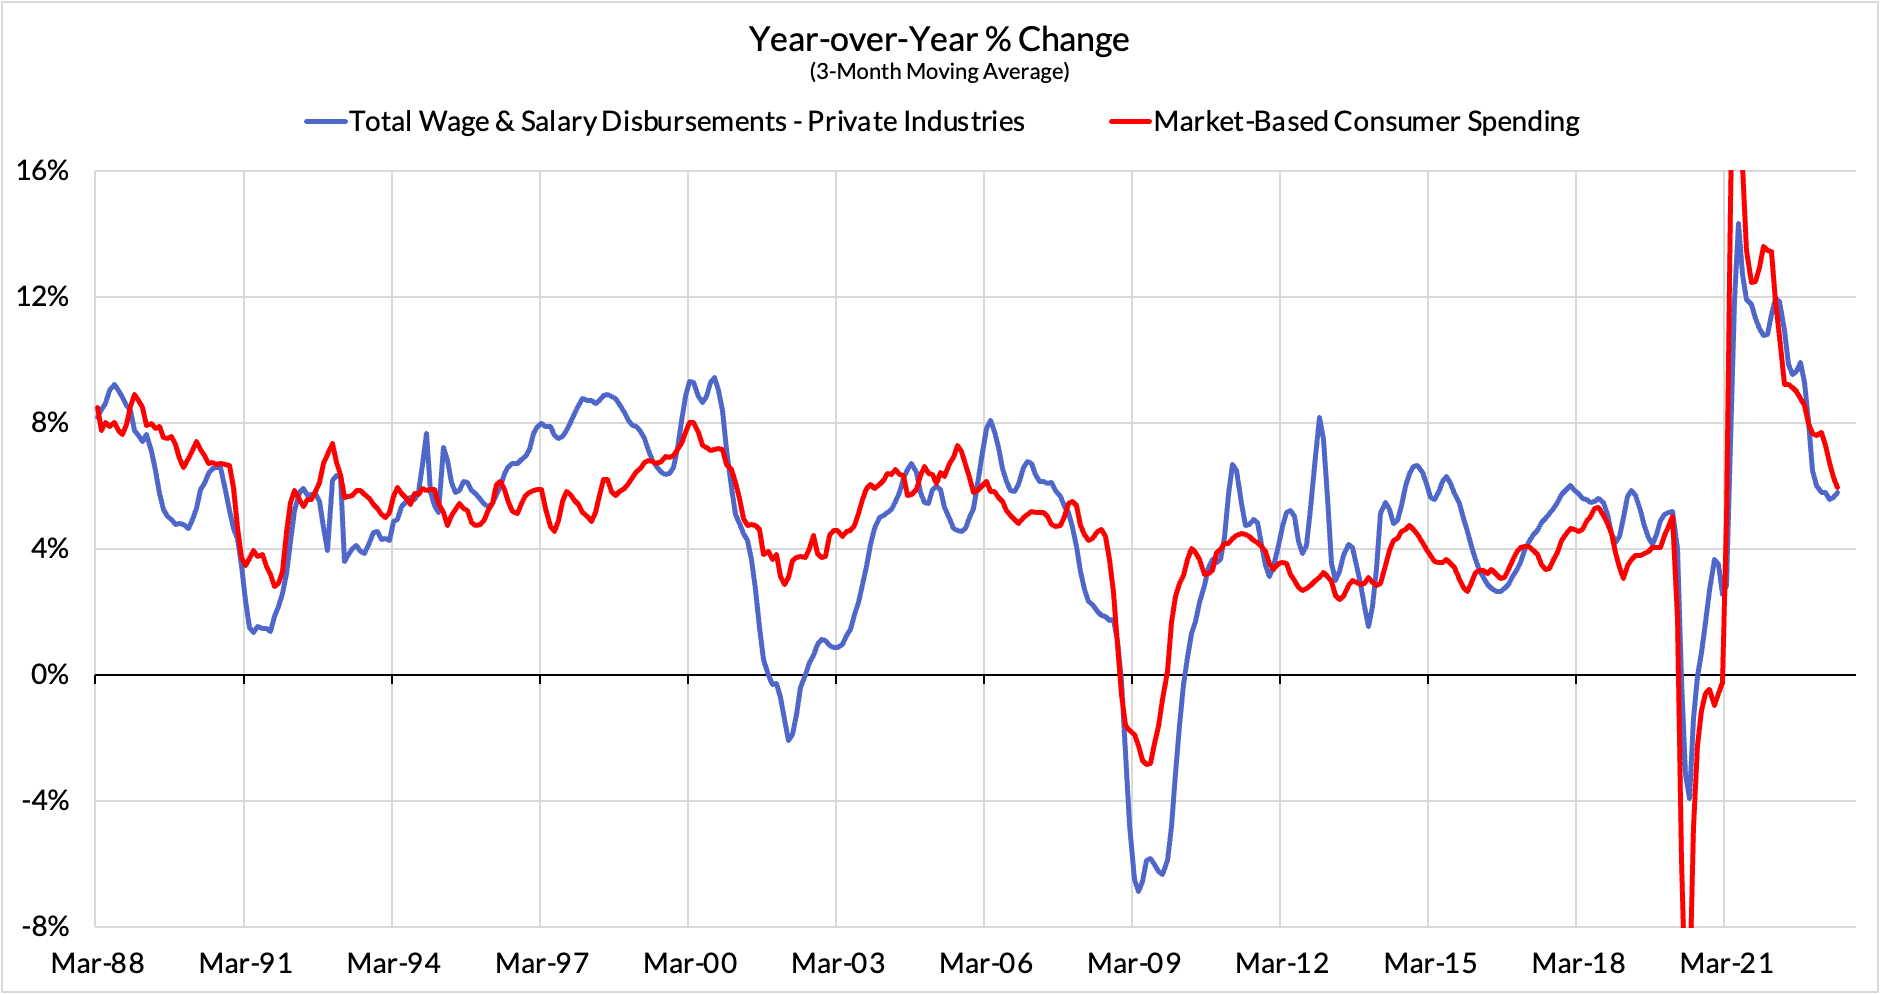
As a result of more people earning paychecks (job growth) and more workers seeing pay increases (wage growth) during the reopening and recovery process, gross labor income growth was strong. For newly employed persons and low-wage workers seeing historic pay increases, the immediate consumption effects were likely substantial and episodically pushed up the price of more inelastic and nondiscretionary goods and services.
From these observations and priors, a more salvageable and practical Phillips Curve model can be derived, one that dispenses with the presumption of a sticky estimate for the natural rate of unemployment or potential output. Instead of pre-ordaining a strict level of unemployment that might set off inflation all the time, speed limits to employment and labor income growth are more relevant. People with new paychecks tend to scale up their consumer spending more imminently than the time it takes them to support additional production ("supply"). A rapid fall in the unemployment rate, say from 10% to 6%, can easily have larger (one-time) demand-side implications for inflation than a low unemployment rate that nevertheless rises from 3% to 4% over the same period (typically a recession).
The welfare gains of rapidly reducing elevated unemployment are still essential to capture and worth pursuing. The inflationary effects of a V-shaped recovery, when compounded by multiple adverse supply shocks and inflation methodology quirks, can lead to multiple years of elevated inflation, as has proven to be the case. Nevertheless, there is a time-limitation on these kinds of phenomena.
The appropriate policy upshot is that a more benign path remains available if supply conditions are monitored carefully. When income growth and inflation are both elevated and recessionary job losses are nearly recovered, policymakers can aim for incrementally slower job growth and wage growth. They do not need to resort to job losses at a speed and scale that proves difficult to reverse. Slowing down to adhere to a speed limit can make sense; putting the car in reverse does not.
Footnote: More recent claims about Phillips Curve models have been oriented around a ratio of job openings to unemployed persons, with full knowledge that there is a cyclical correlation between the two. My colleague Preston Mui has written at length about why job openings are so faulty as a labor market indicator and illustrated why their empirical relevance to inflation and wage growth remains flimsy. While the quantity of job openings has marginally declined (unlike most real activity and utilization metrics), the level of job openings still remains elevated as a ratio to the level of unemployment and thus should only be a marginal explanation for disinflation and wage deceleration. We will be engaged in a more detailed review of these models' predictions in a forthcoming post.