Core-Cast is our nowcasting model to track the Fed's preferred inflation gauges before and through their release date. The heatmaps below give a comprehensive view of how inflation components and themes are performing relative to what transpires when inflation is running at 2%. If you are interested in more timely access to this content following the release of data, feel free to reach out to us here to gain access to our Premium Donor distribution.
Most of the Personal Consumption Expenditures (PCE) inflation gauges are sourced from Consumer Price Index (CPI) data, but Producer Price Index (PPI) input data is of increasing relevance, import price index (IPI) data can prove occasionally relevant. But as we will focus on in this post, there are some high-leverage components that only come out on the day of the PCE release.
Summary
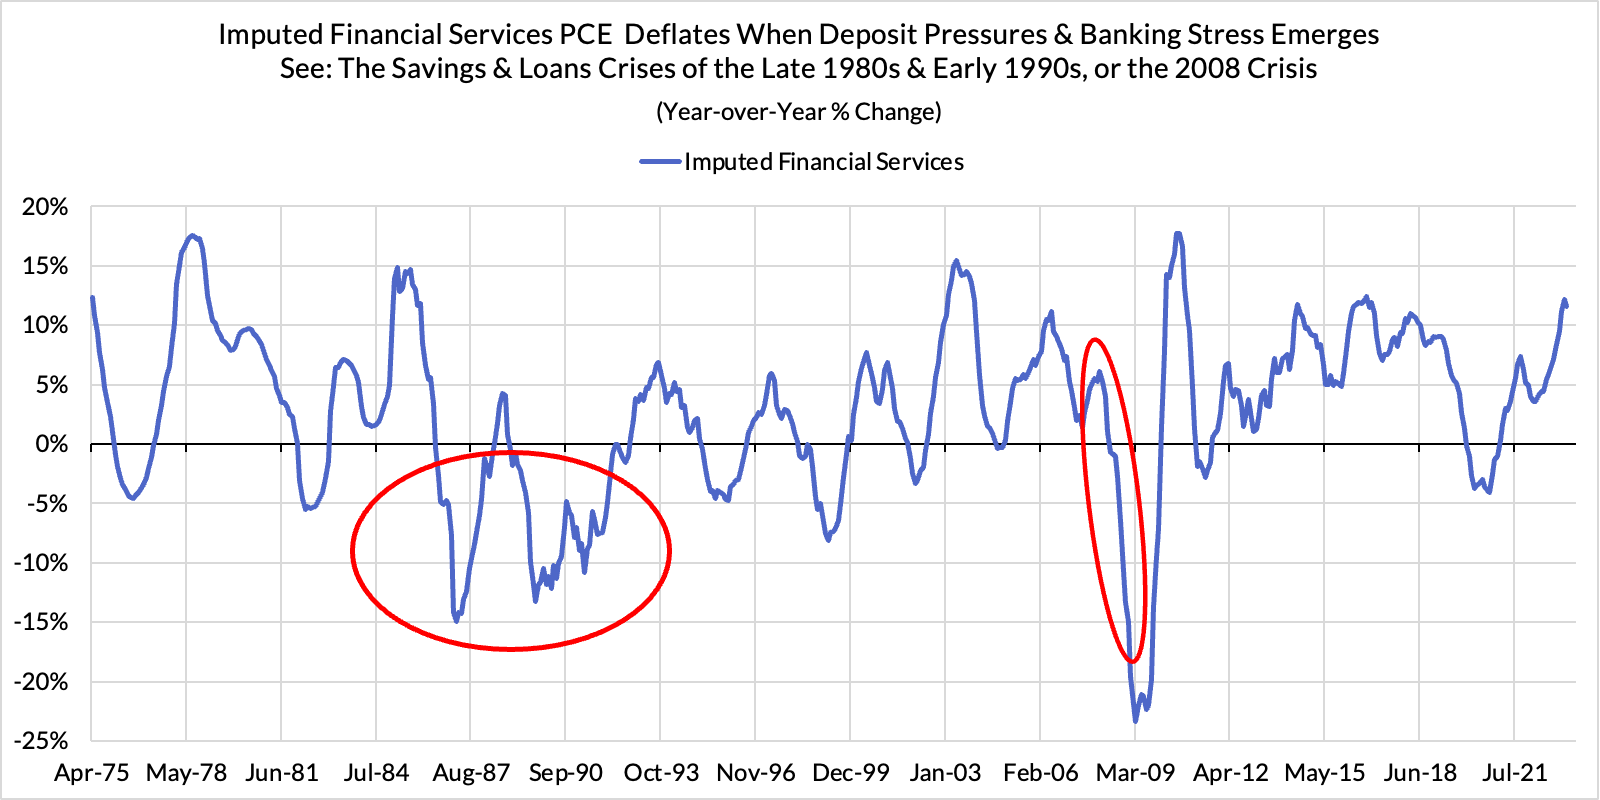
Consistent with our nowcast and the forecasting consensus, core PCE came in at 0.3%, and as we had flagged, revisions would raise prior year-over-year readings. Perhaps most notably today, Core Services Ex Housing PCE in March showed signs that it could comply with outcomes consistent with the Fed's 2% PCE target, albeit for largely non-wage reasons that we originally flagged to Premium Donors when SVB collapsed. We are seeing accumulating evidence that higher deposit rates and slower input costs are feeding into imputed financial services and other PCE-specific components (not captured by CPI or PPI source data). These components are the "dark spaces" of PCE where we do not get any kind of direct read beforehand (and where the methodology is most opaque).
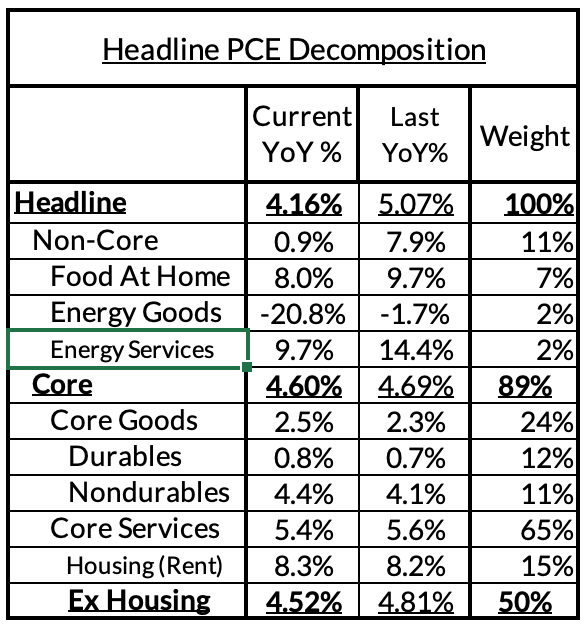
- Headline PCE fell, from 5.07%* year-over-year in February to 4.16% in March. (0.08% month-over-month increase vs our 0.19% nowcast). February year-over-year was revised up from 5.00% to 5.07%.
- Core PCE fell, from 4.69%* year-over-year in February to 4.60% in March. (0.28% month-over-month increase vs our 0.30% post-PPI nowcast & our 0.27% post-IPI nowcast). February year-over-year was revised up 9bps from 4.60% to 4.69%.
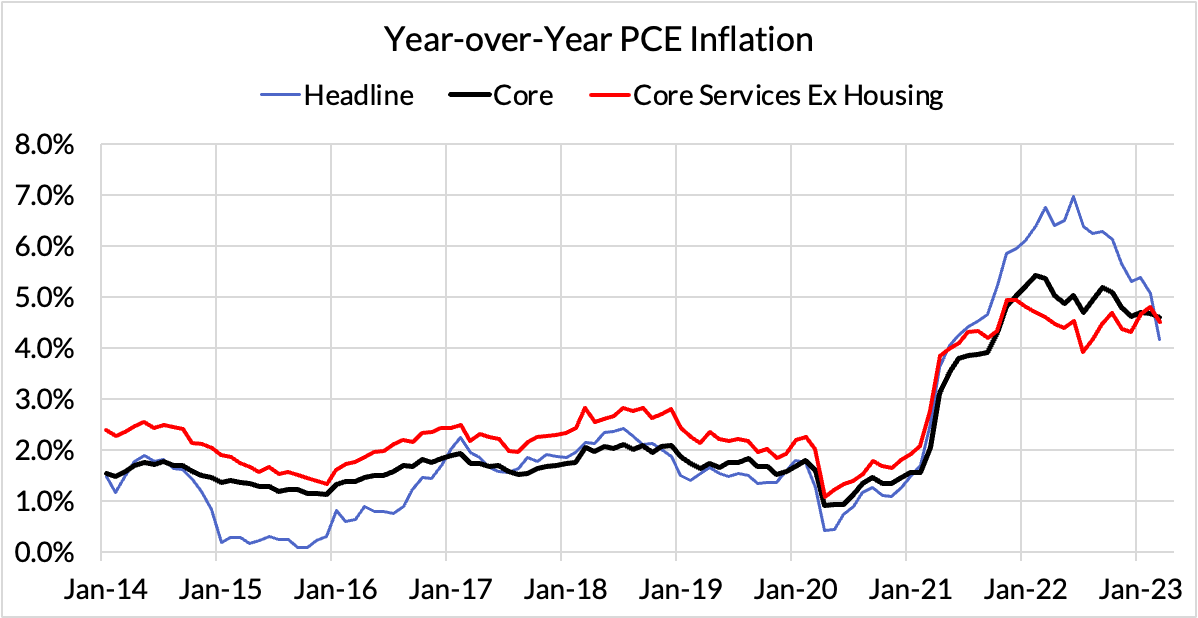
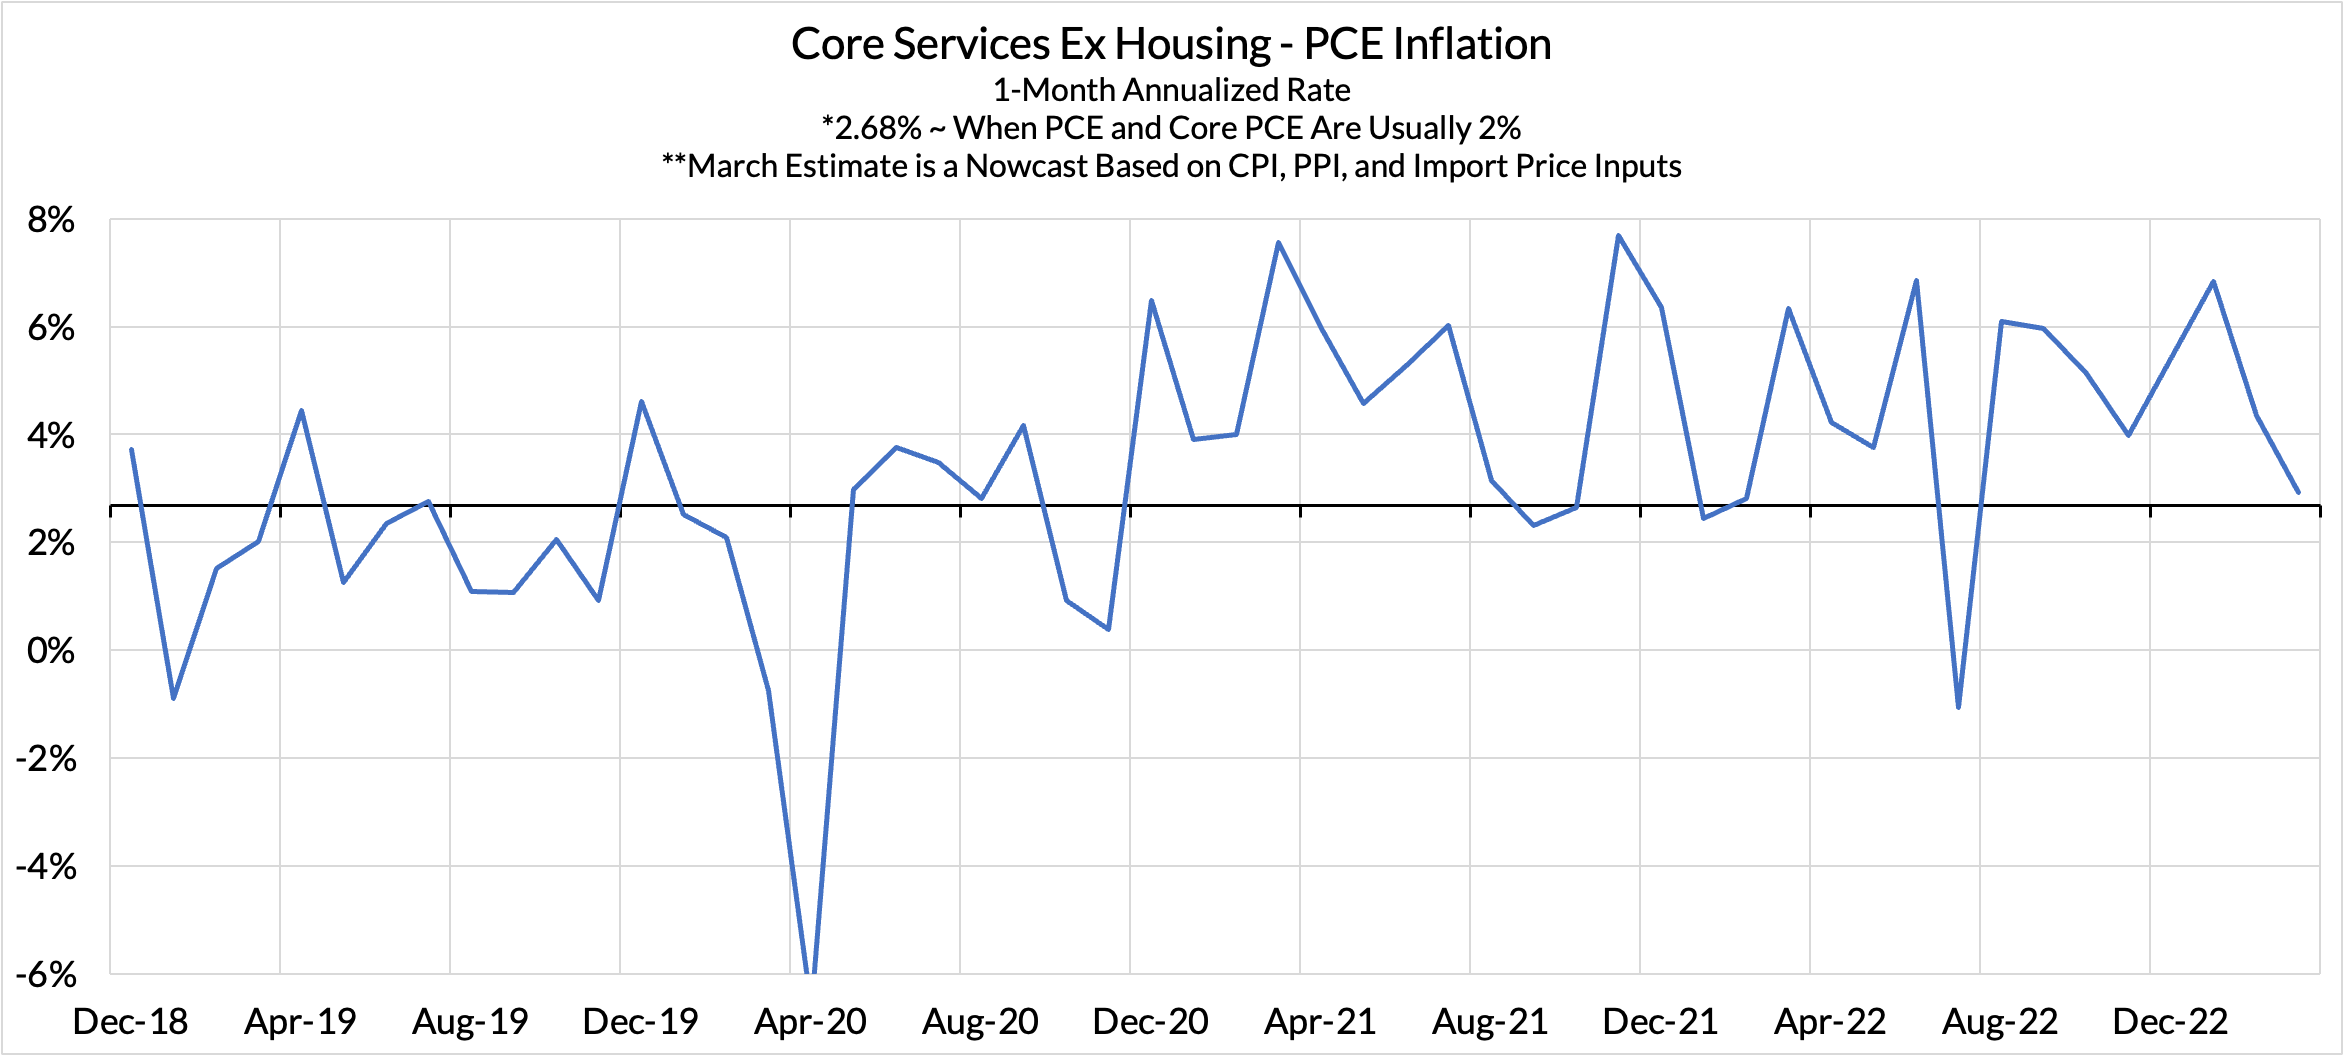
- Core Services Ex Housing PCE (CSXHP) stayed flat, but decelerated in month-over-month terms. Year-over-year readings rose from 4.81%* year-over-year in February to 4.52% in March (0.24% month-over month increase vs 0.29% nowcast). February year-over-year readings were revised up from 4.64% to 4.81%. CSXHP ran at a 2.93% annualized rate in March; in 2018Q4—when Core and Headline PCE were ~2%—CSXHP ran at 2.72% year-over-year. This is the most encouraging piece of information from the Fed's perspective
Deeper Discussion
For those interested in a deeper knowledge of the high-stakes dynamics (see the heatmaps below for how their scale to contribute to PCE):
- March Monthly Core Service Ex Housing is in the 2% PCE ballpark: Core Services Ex Housing PCE grew at a 2.93% annualized rate in March
- Dark Space #1 - The scramble for deposits is realizing downside potential already: Premium Donors to Employ America were already aware of how upward pressures on deposit rates (relative to the Fed Funds Rate) can create deflationary potential. That story is apparently playing out right now already. Imputed financial services saw a second consecutive month of deceleration. This single component could shave off as much as 40 basis points on Core PCE and 70 basis points on CSXHP if deposit rate pressures continue to ratchet up.
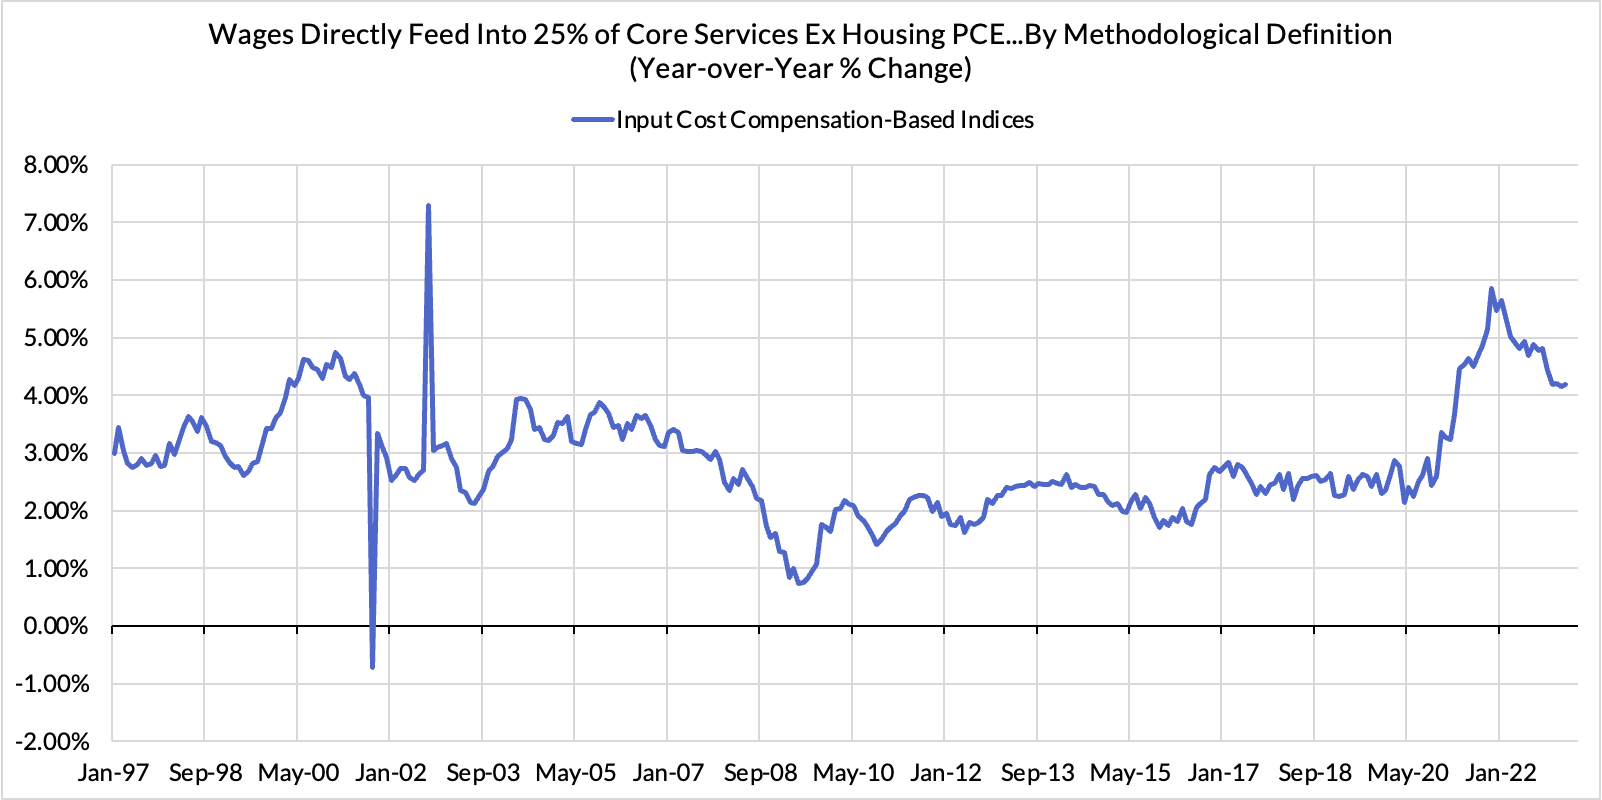
- Dark Space #2 - Input cost indices are sending less compelling disinflationary potential thus far: We are very skeptical of the Fed's claims that CSXHP is driven by wage growth in a macro-causal sense, but in terms of strict measurement, a quarter of this PCE basket directly uses wage measures to calculate "prices." We saw some slowing in February that was further revised down in March, but the March and January readings look marginally stronger. Taken in totality, Q1 still shows that this basket is disinflating from a 39bp contribution to CSXHP overshoot to something more consistent with 2% PCE (gross contribution shifting from 103bps year-over-year to 62bps quarter-over-quarter).
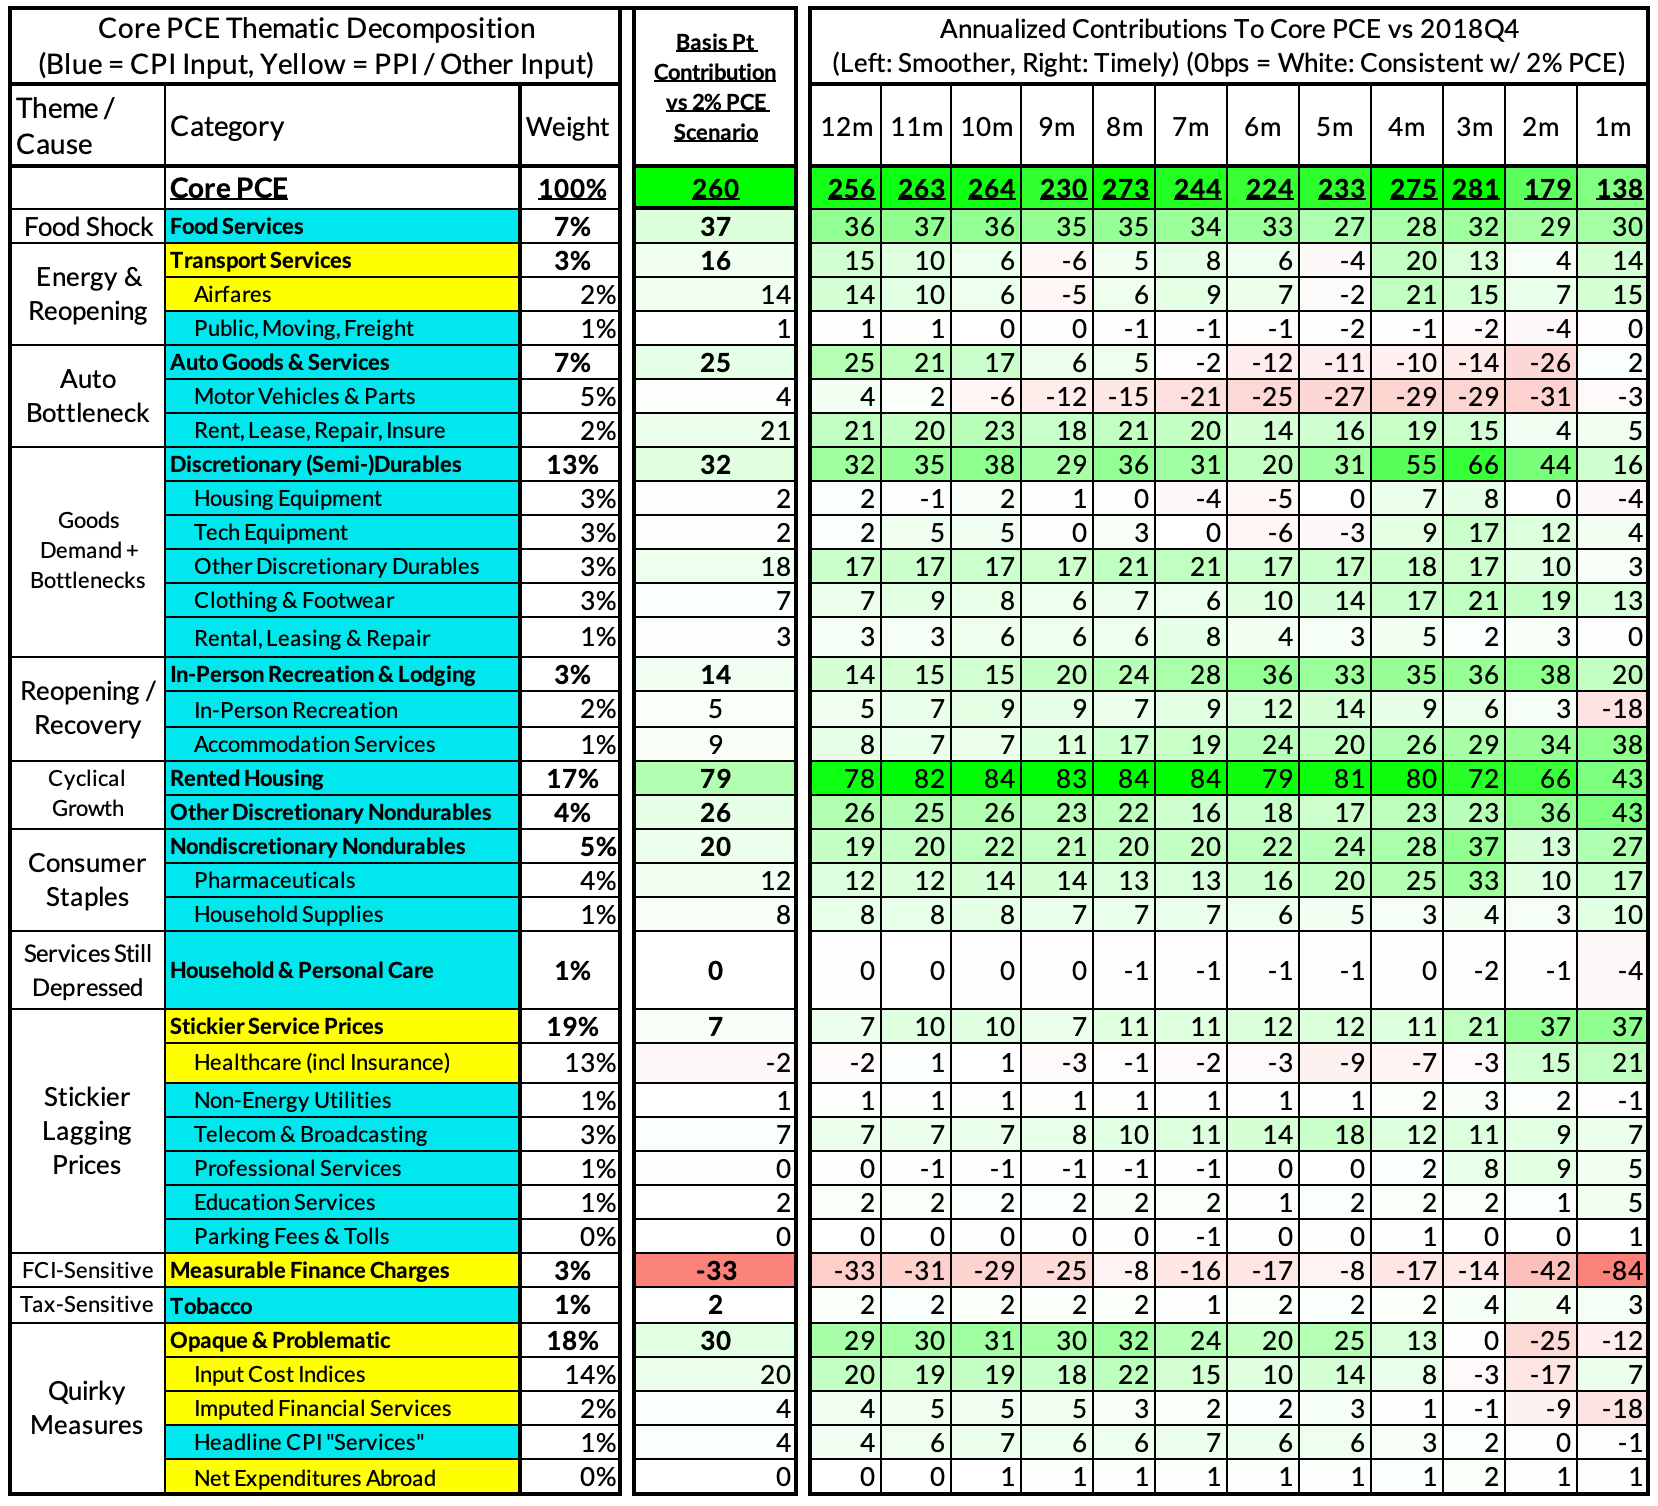
For the Detail-Oriented: Core PCE Heatmaps
Right now Core PCE (PCE less food products and energy) is still running at 4.60%, 260 basis points above the Fed's 2% inflation target for PCE. That overshoot is disproportionately driven by catch-up rent CPI inflation in response to the surge in household formation (a byproduct of rapidly recovering job growth) and its demand-side effect on market rents in 2021-22.
There are other contributors to the overshoot, some more supply-driven (automobile bottlenecks likely explain 25 basis points, while food inputs likely added 37 basis points to the overshoot) and some more demand-driven (in-person recreation and travel services adding 14 basis points to the overshoot, discretionary nondurable goods adding 26 basis points), and some reflect both (airfares are both reopening-sensitive and energy-sensitive, adding 16 basis points to the overshoot). Quirky methodologies add another 30 basis points to the overshoot.
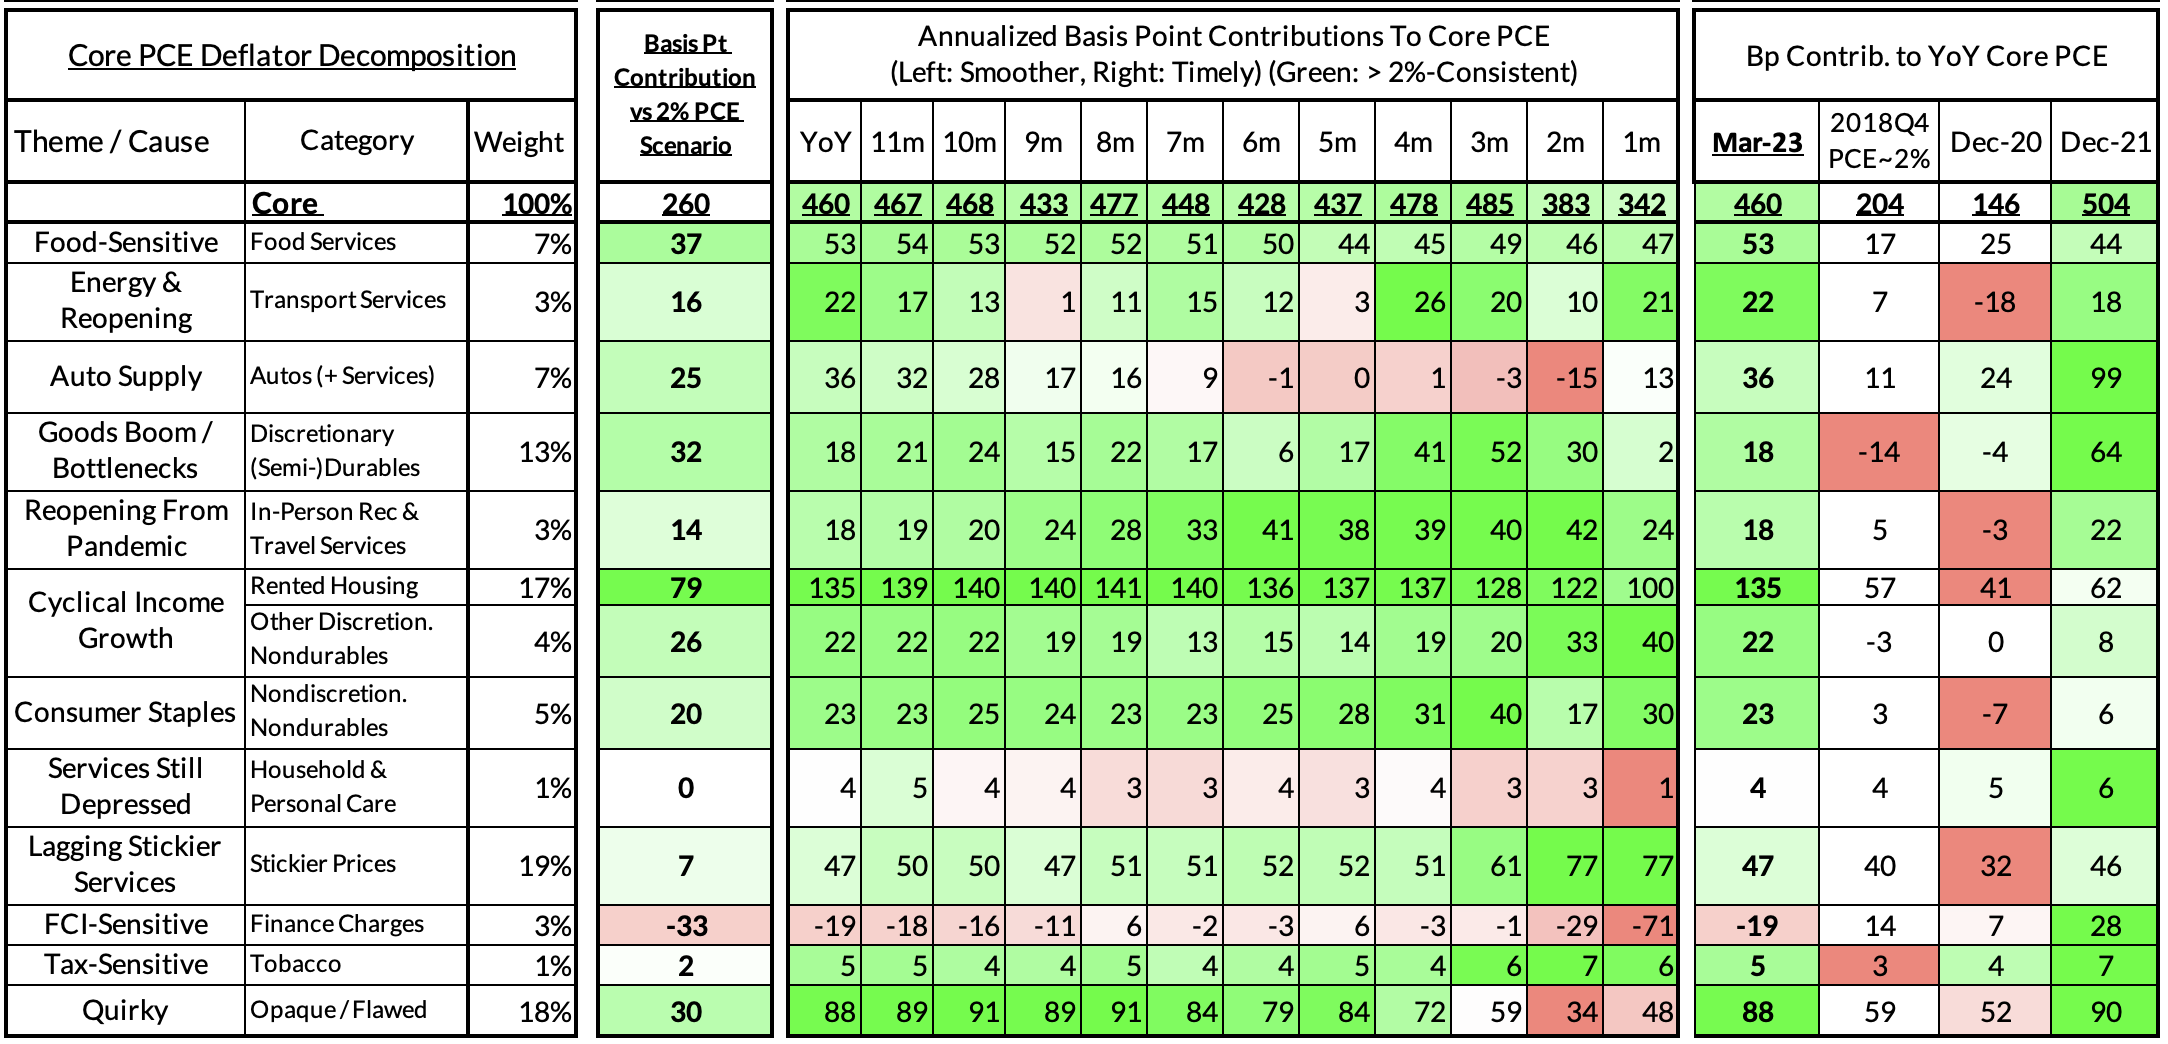
The final heatmap here gives you a sense of the overshoot on shorter annualized run-rates. March's monthly core PCE yielded a 138 basis point overshoot vs when PCE was near 2% target and core PCE was close to 2% (2.04%). March monthly core PCE is currently running at 3.42% annualized.
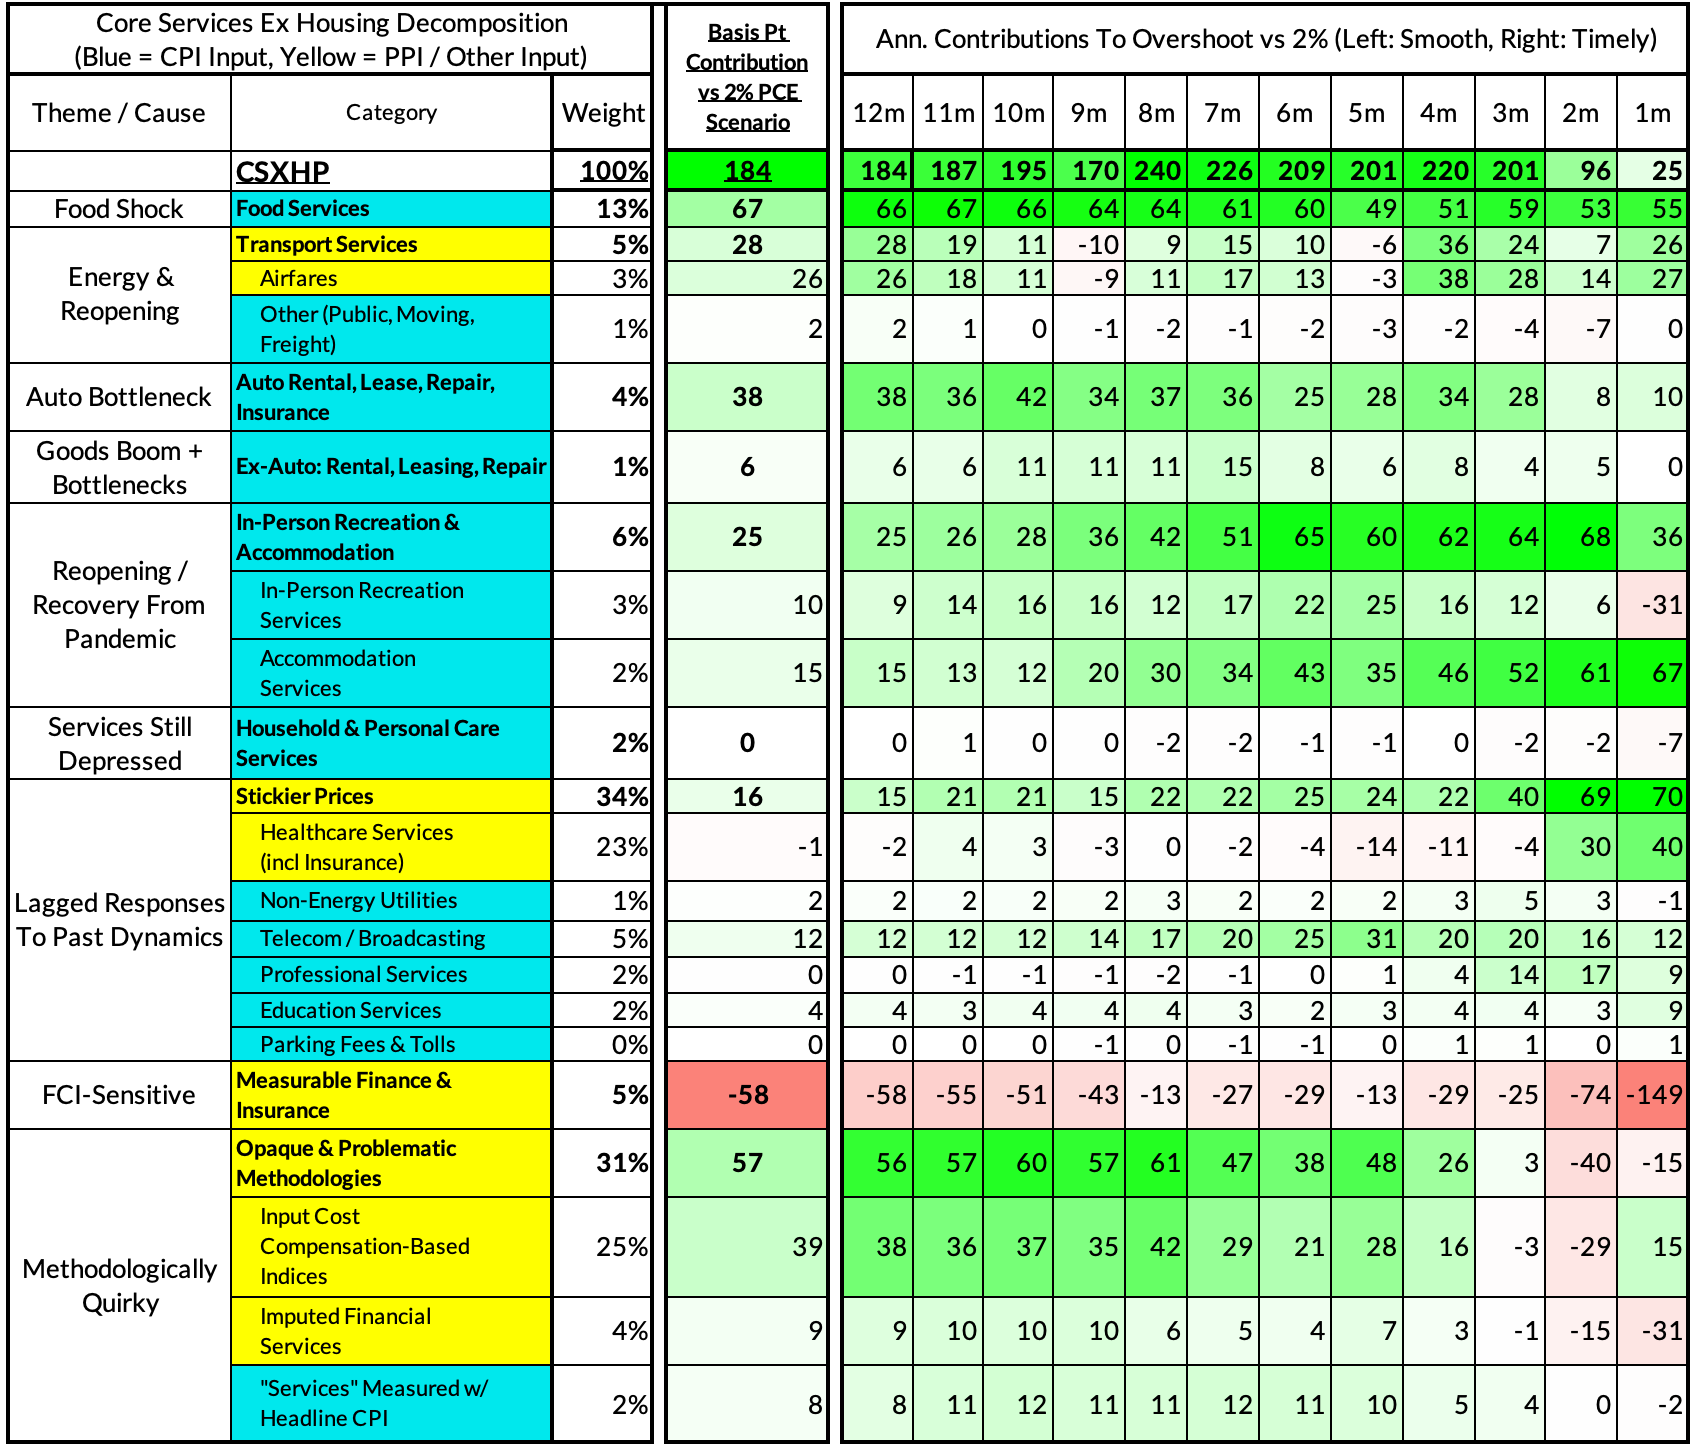
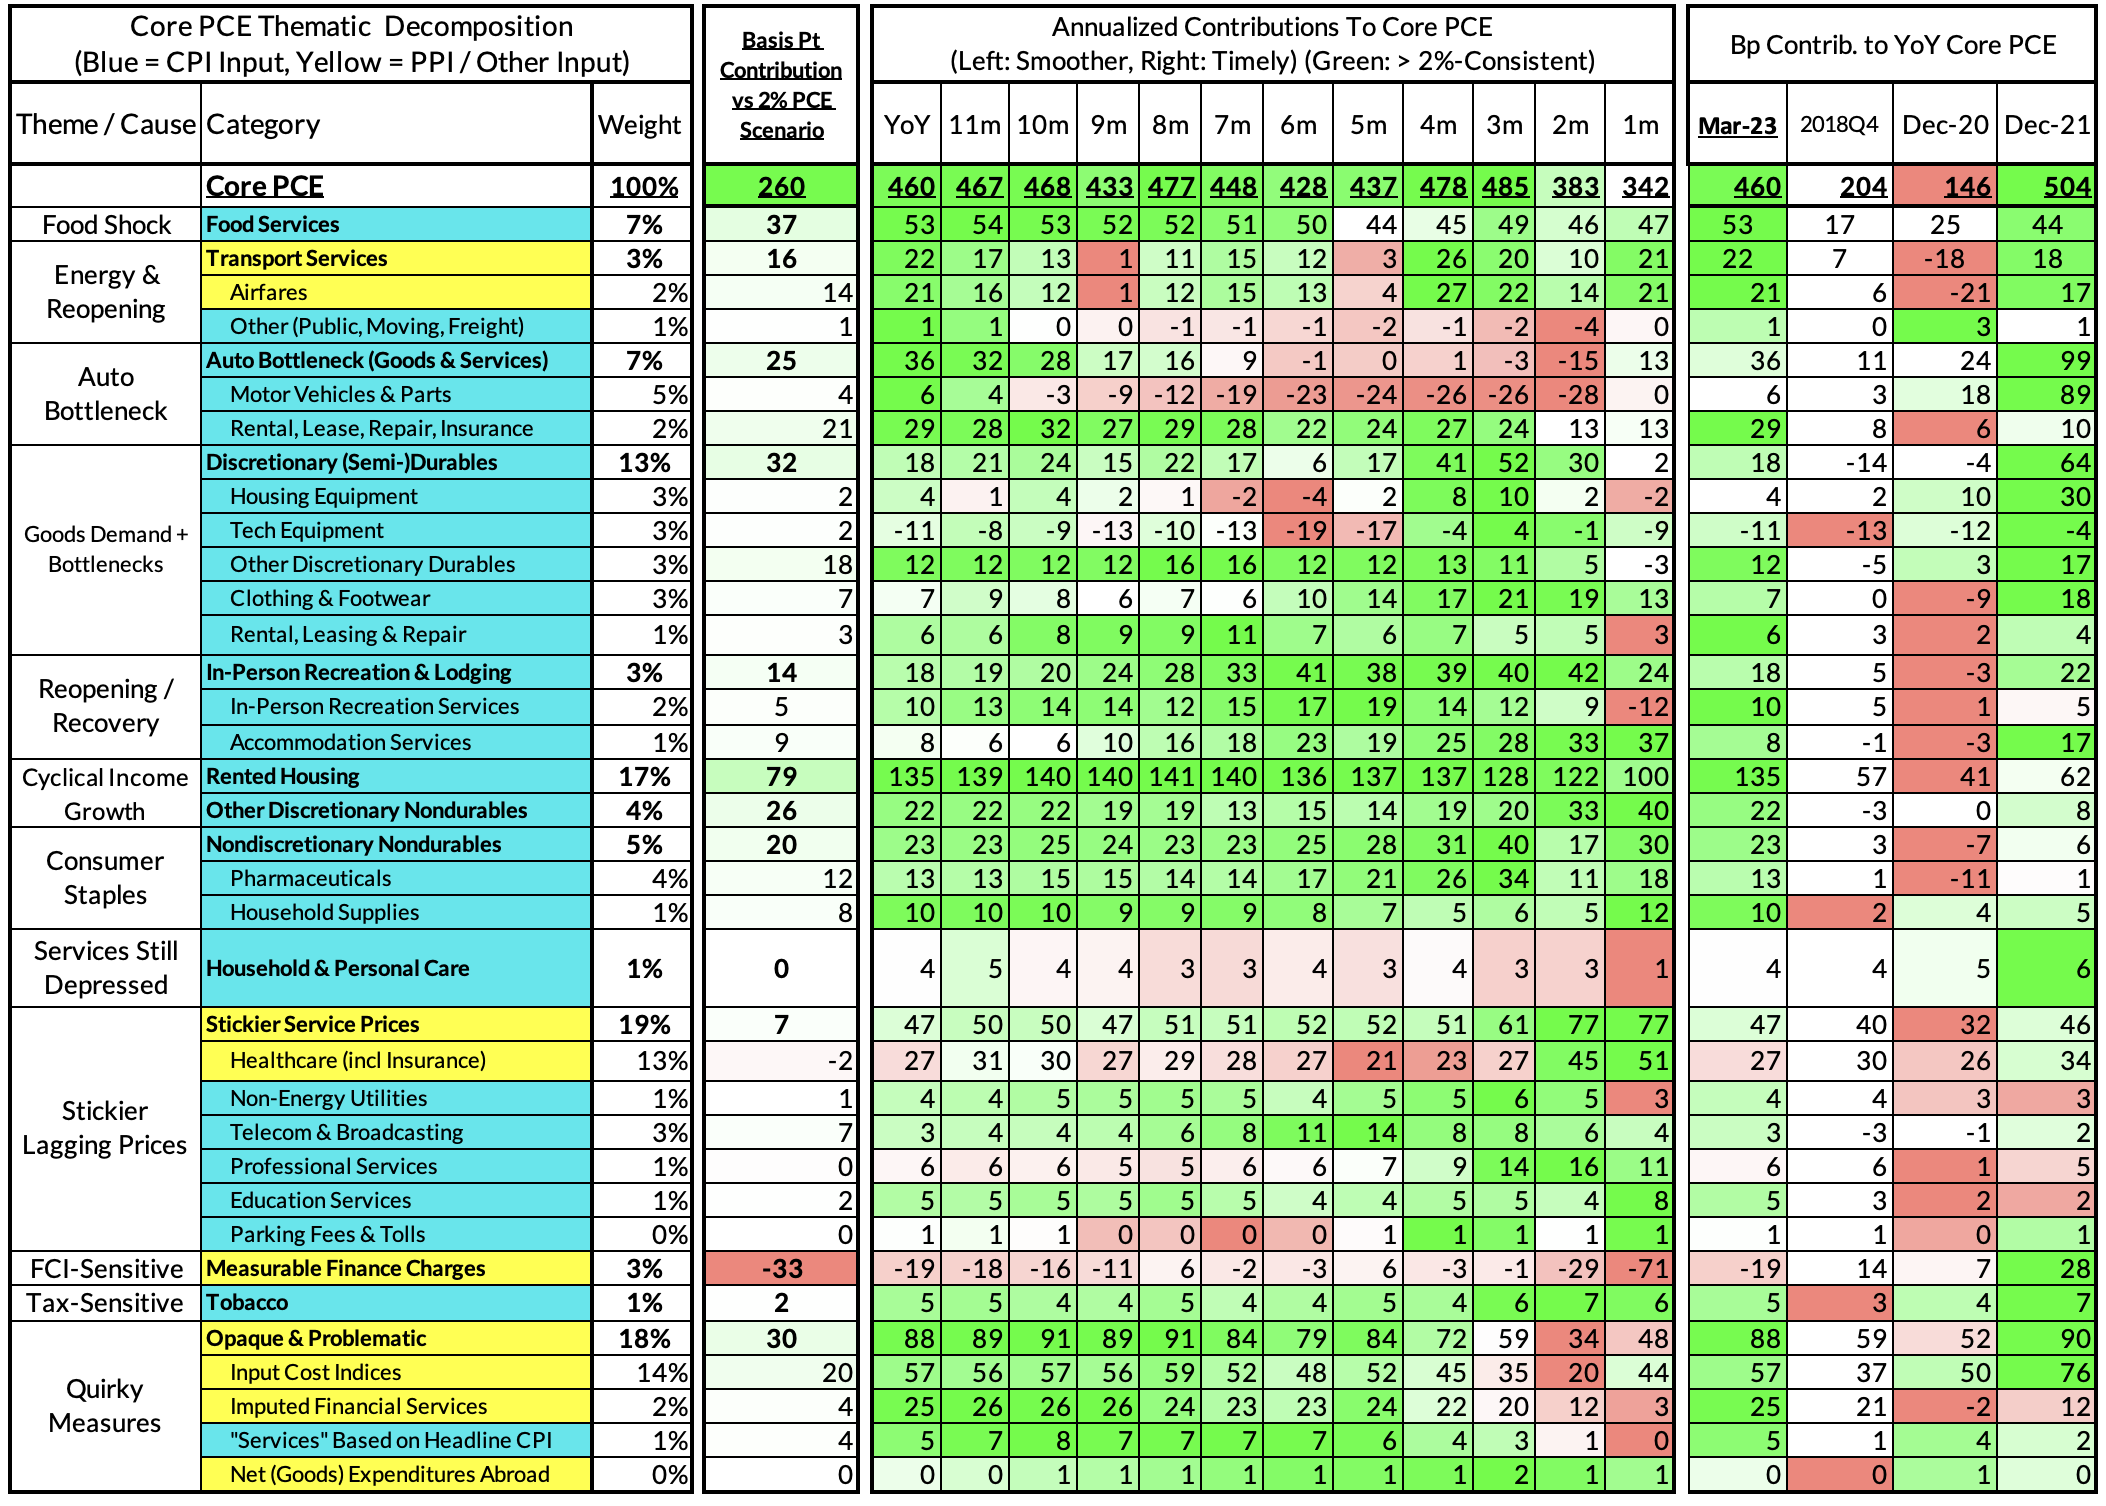
For the Detail-Oriented: Core Services Ex Housing PCE Heatmaps
March's growth rate in "Core Services Ex Housing PCE" is on track to run at 4.52%, a 184 basis point overshoot versus the 2.68% run rate in this aggregate that coincided with 2% headline and core PCE.
We would call special attention to what we're seeing in the "Methodologically Quirky" categories we have flagged in the bottom rows. They are softening up quite a bit in recent months and could put downward pressure as slower wages, higher deposit rates, and headline inflation dynamics take further root.
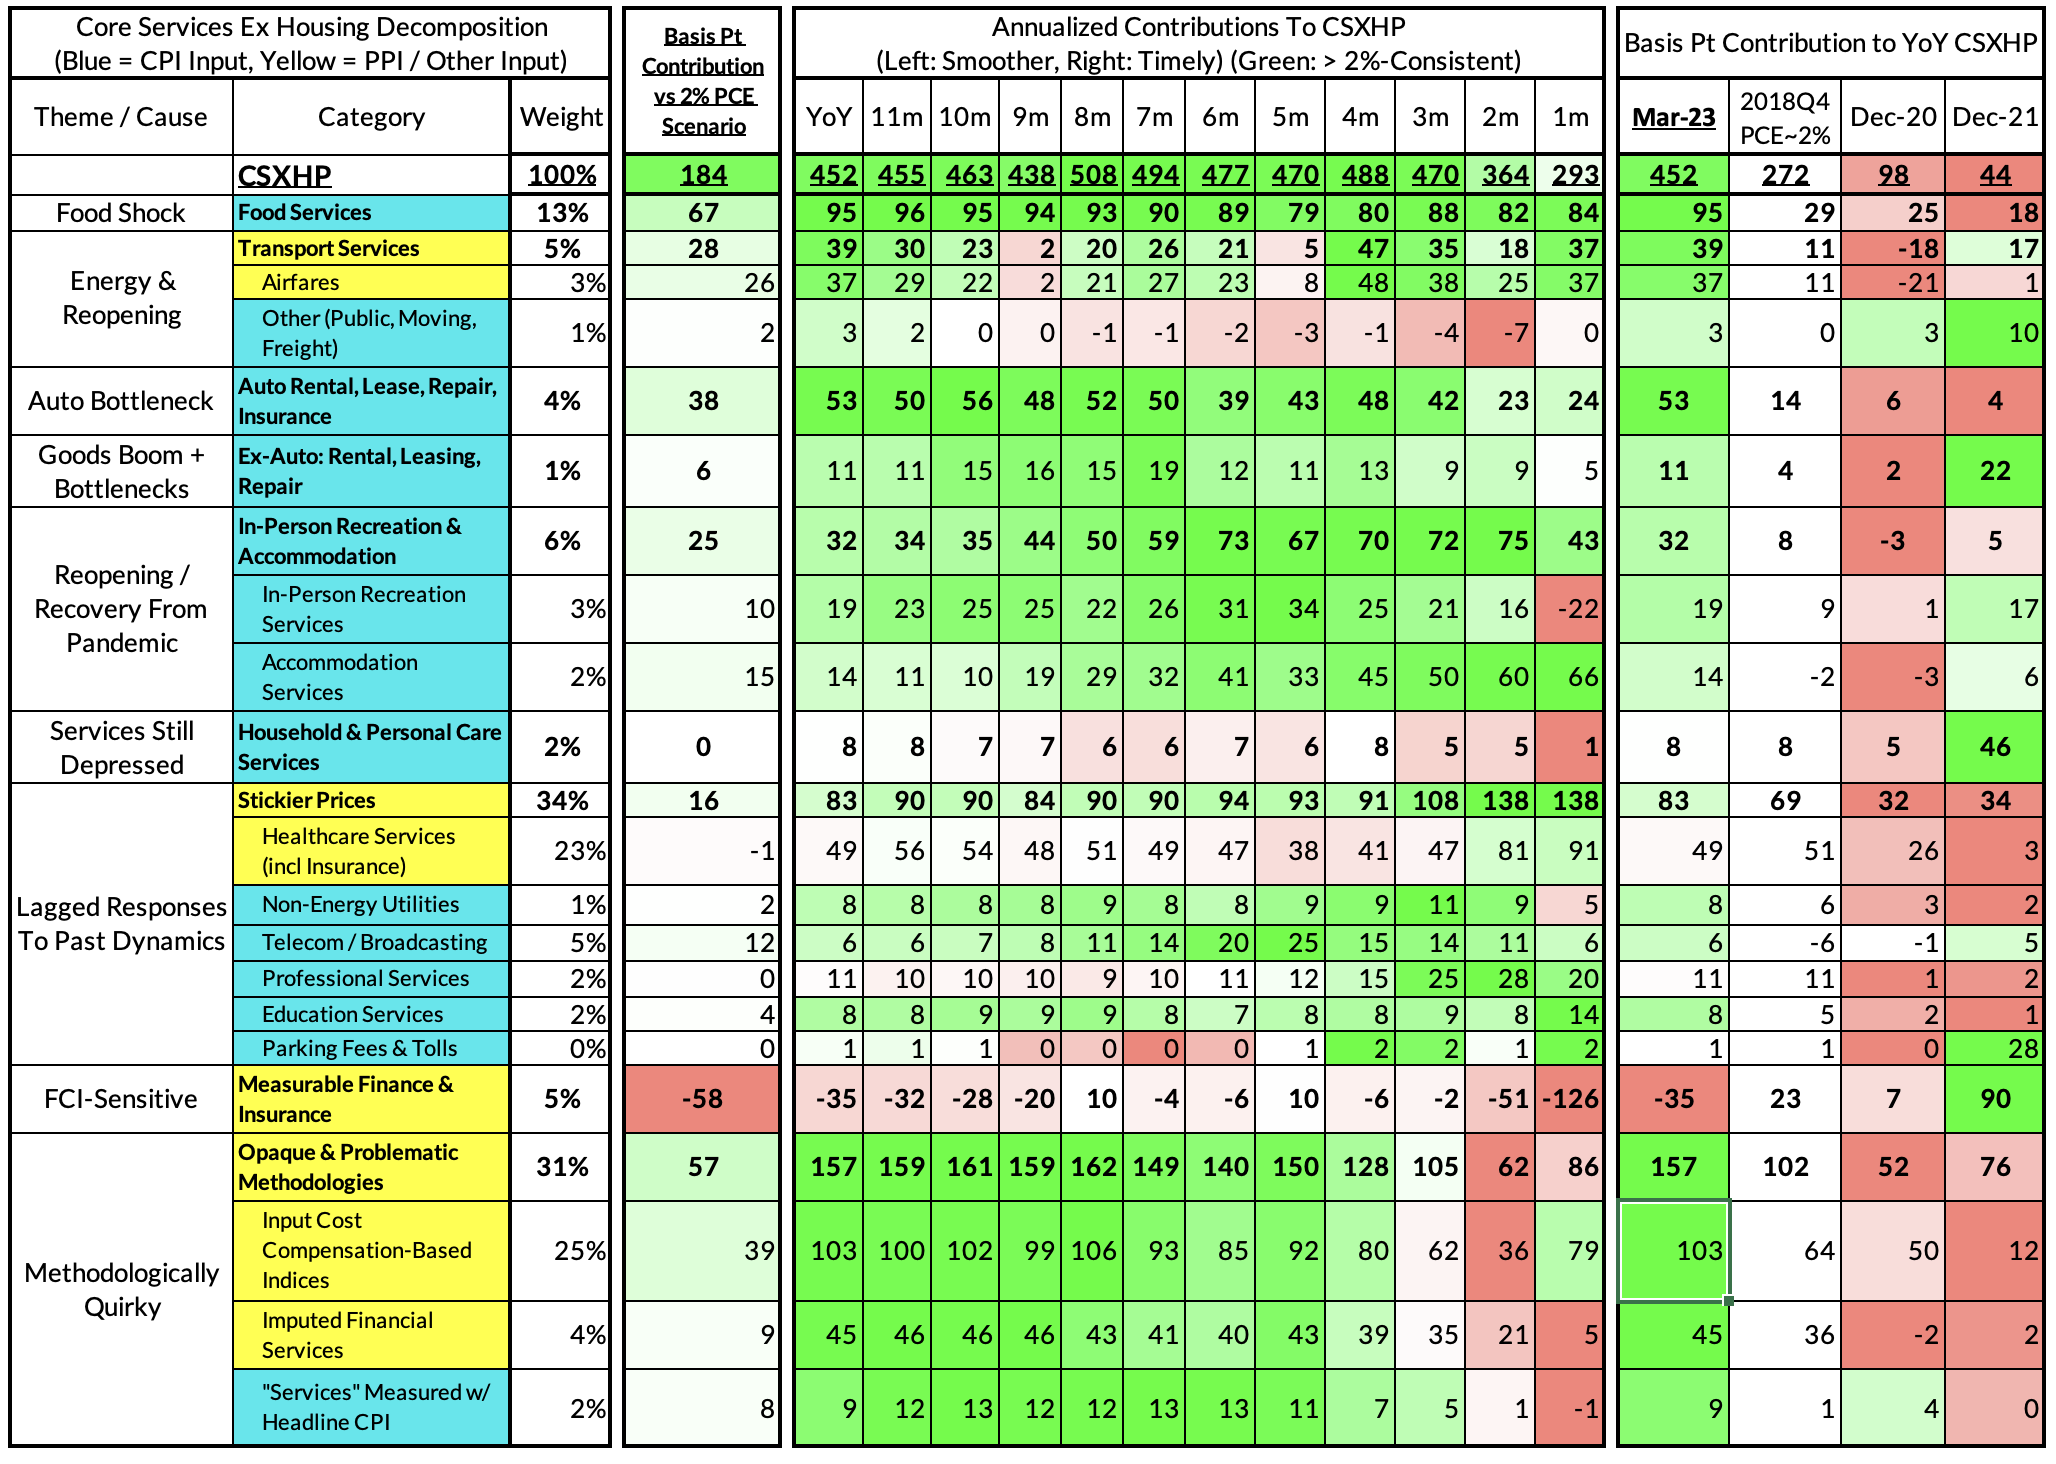
The last heatmap gives you a sense of the overshoot on shorter annualized run-rates. March's monthly core PCE yielded a 25 basis point overshoot vs 2% target inflation (2.93% annualized growth vs the 2.68% run rate needed to be consistent with the Fed's overall PCE inflation goals).