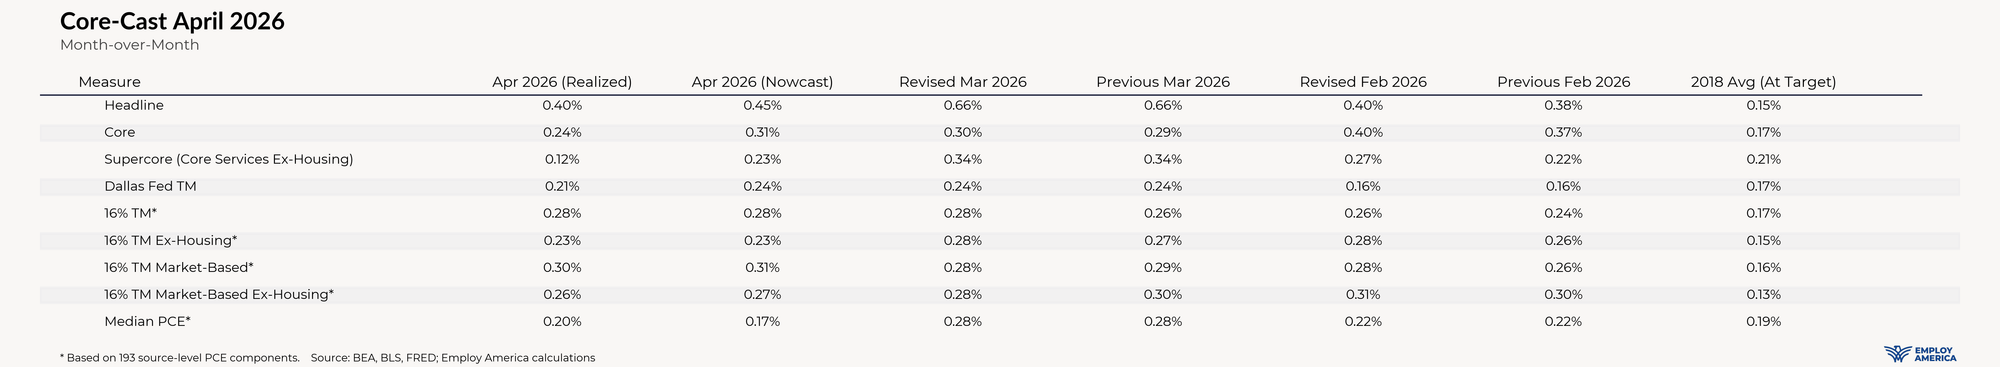
April 2026 Core-Cast Post-PCE: Big Monthly Downside Miss, But Offset By Upside Revisions

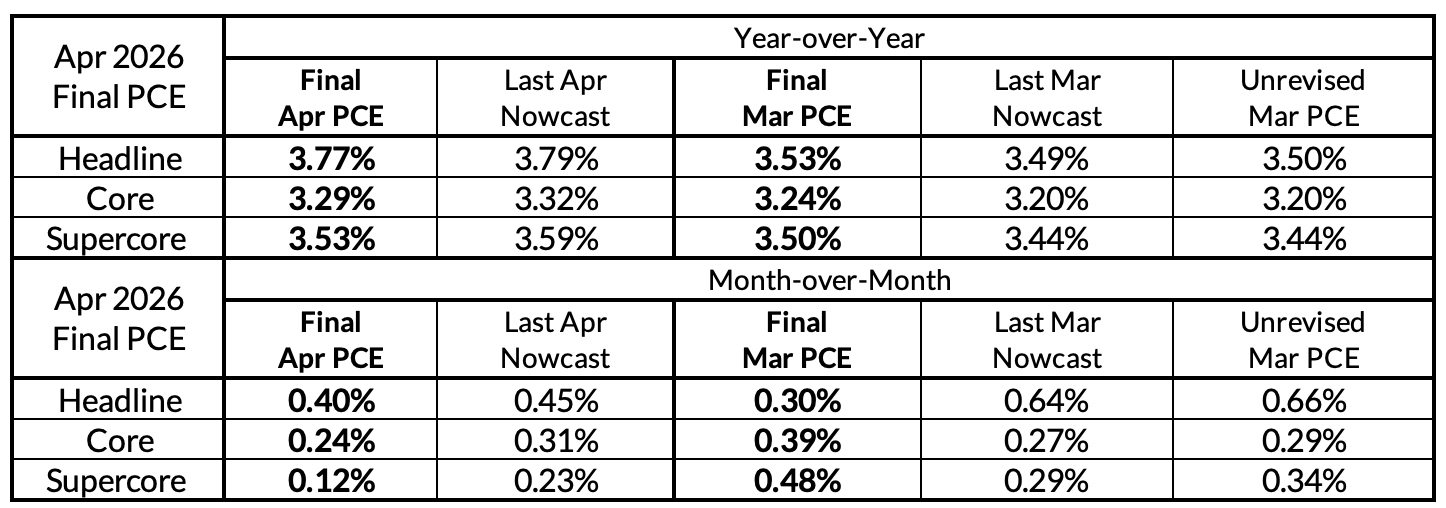
Core and Supercore PCE delivered a major downside surprise in the final PCE release for April, but. more than half of the downside surprise was offset by upside revisions to Q1 inflation. The net result was just a 3bp decline in Core PCE year-over-year readings for April relative to our nowcast, and only a modest effect on our outlook for Fed policy this year.
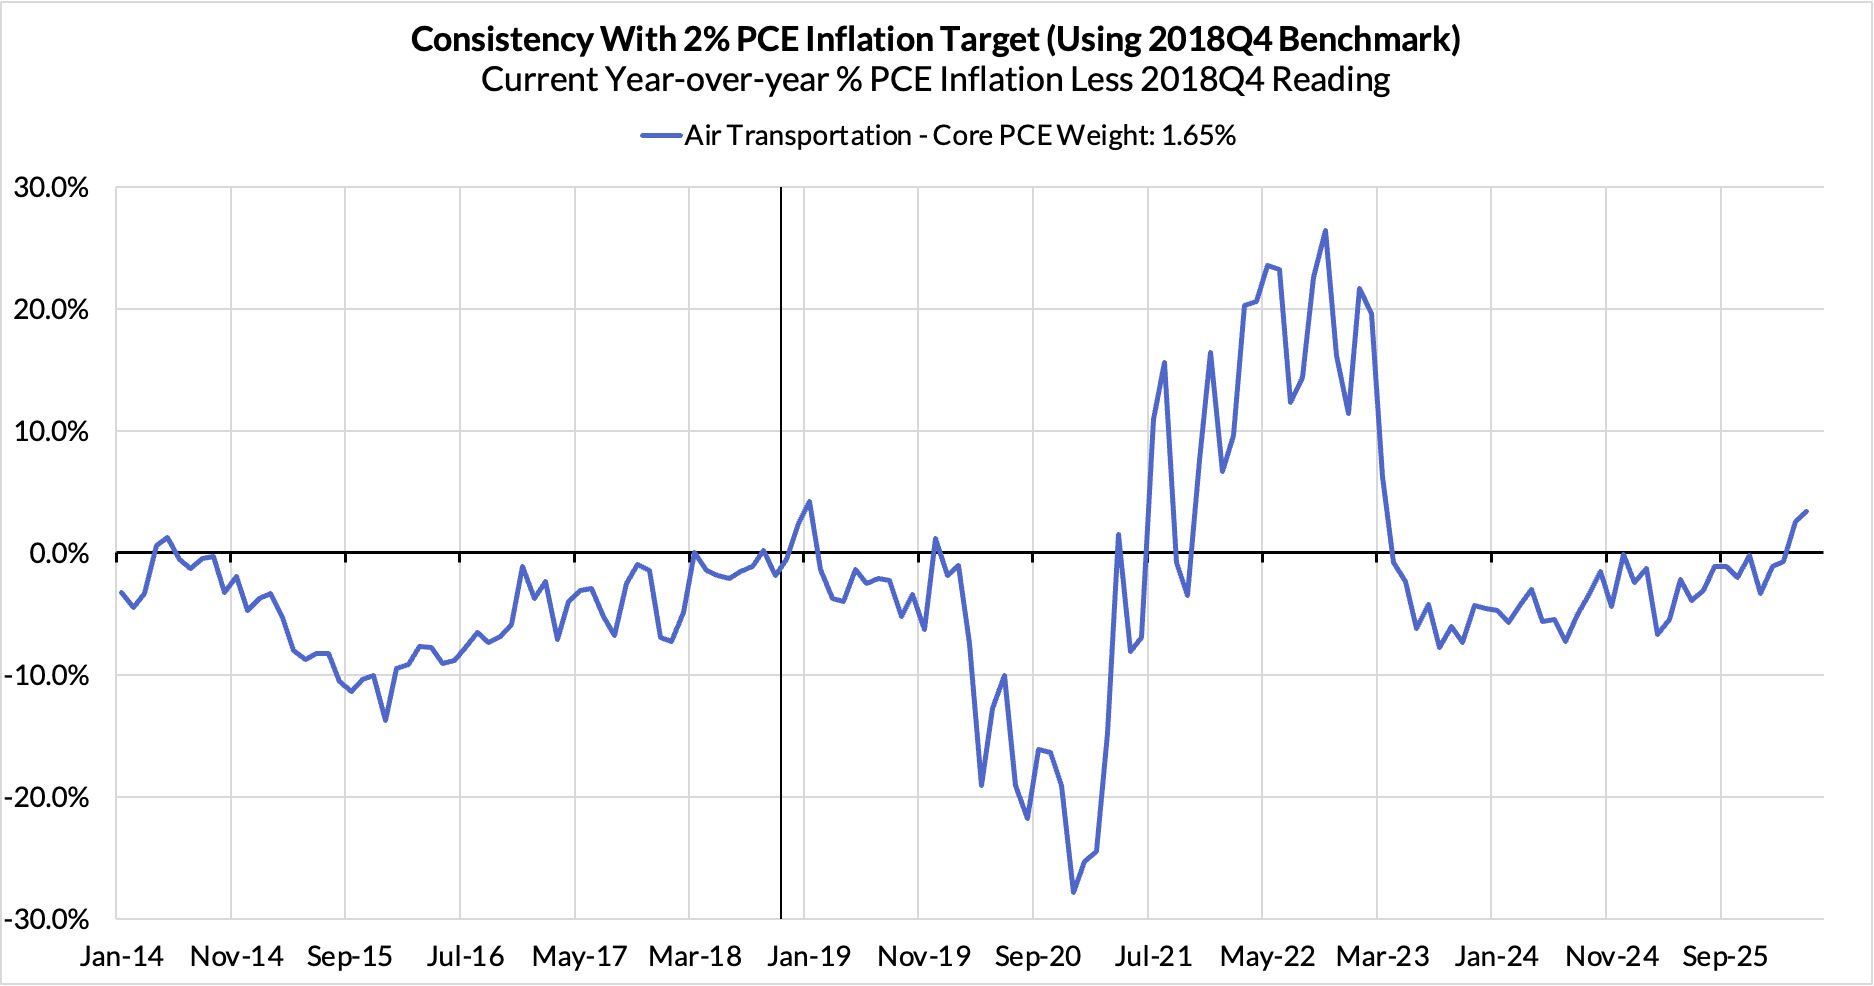
The sources of our downside miss are related to the dark spaces of BEA-specific estimates that only come out the day of PCE + an unfavorable estimate of the seasonal factors tied to airfares inflation. We expect the latter to spit back more aggressively in the coming months. There is more airfare inflation in the pipeline, especially so for PCE.
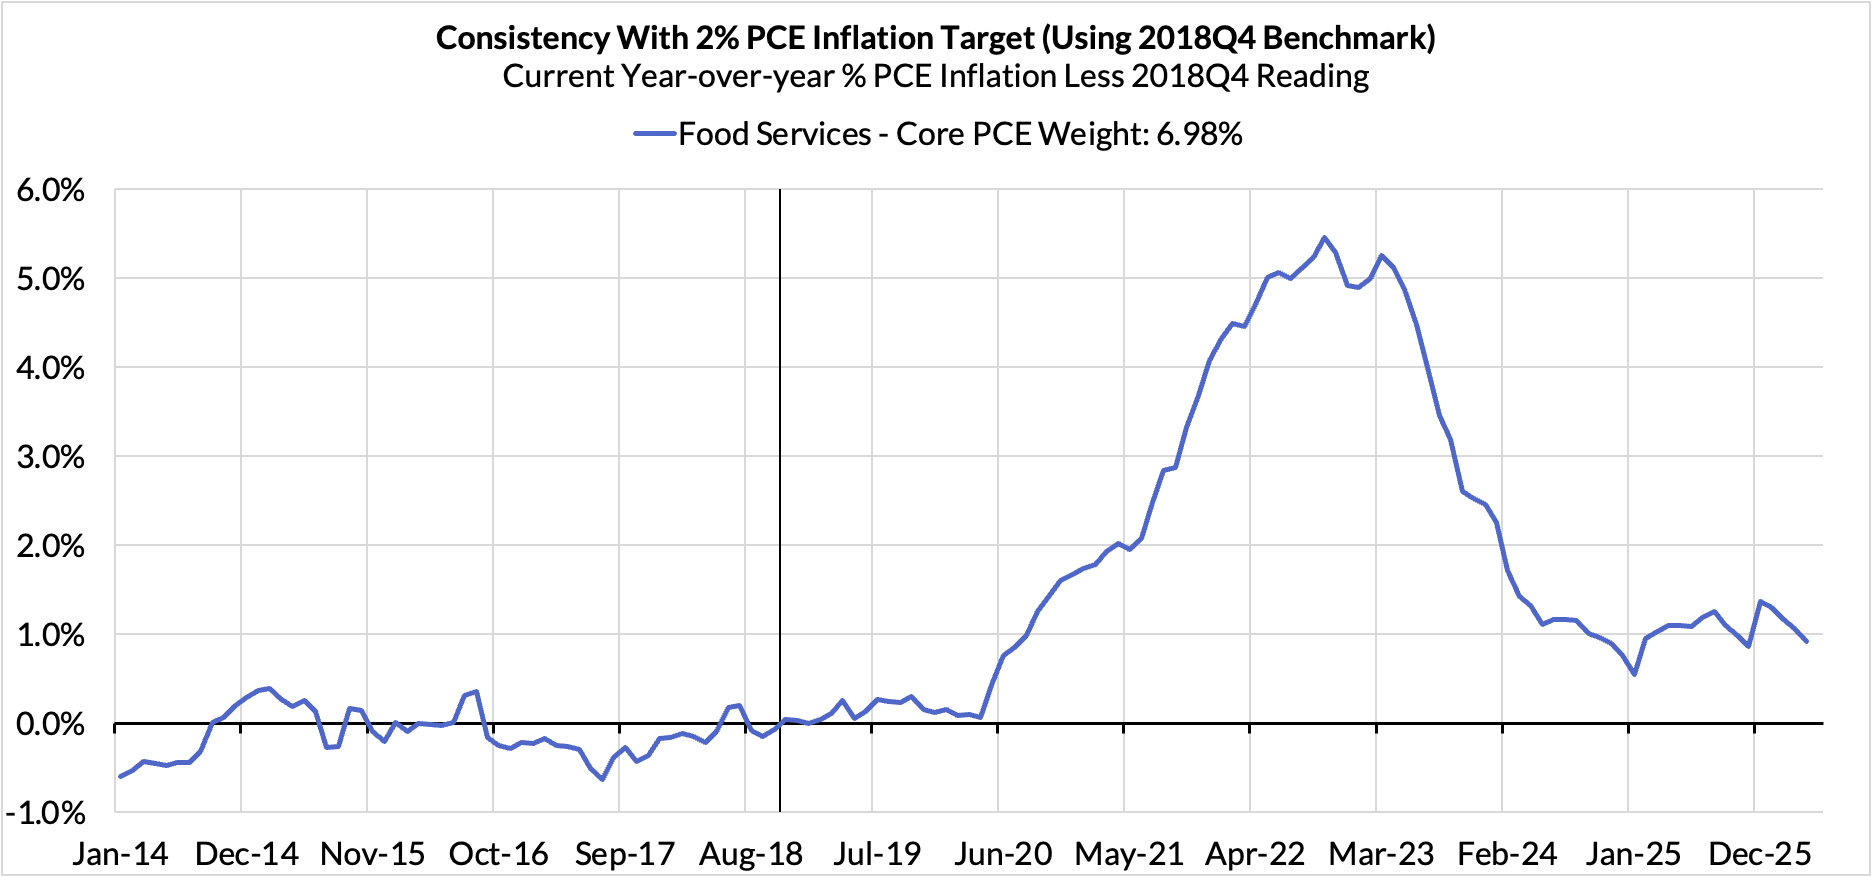
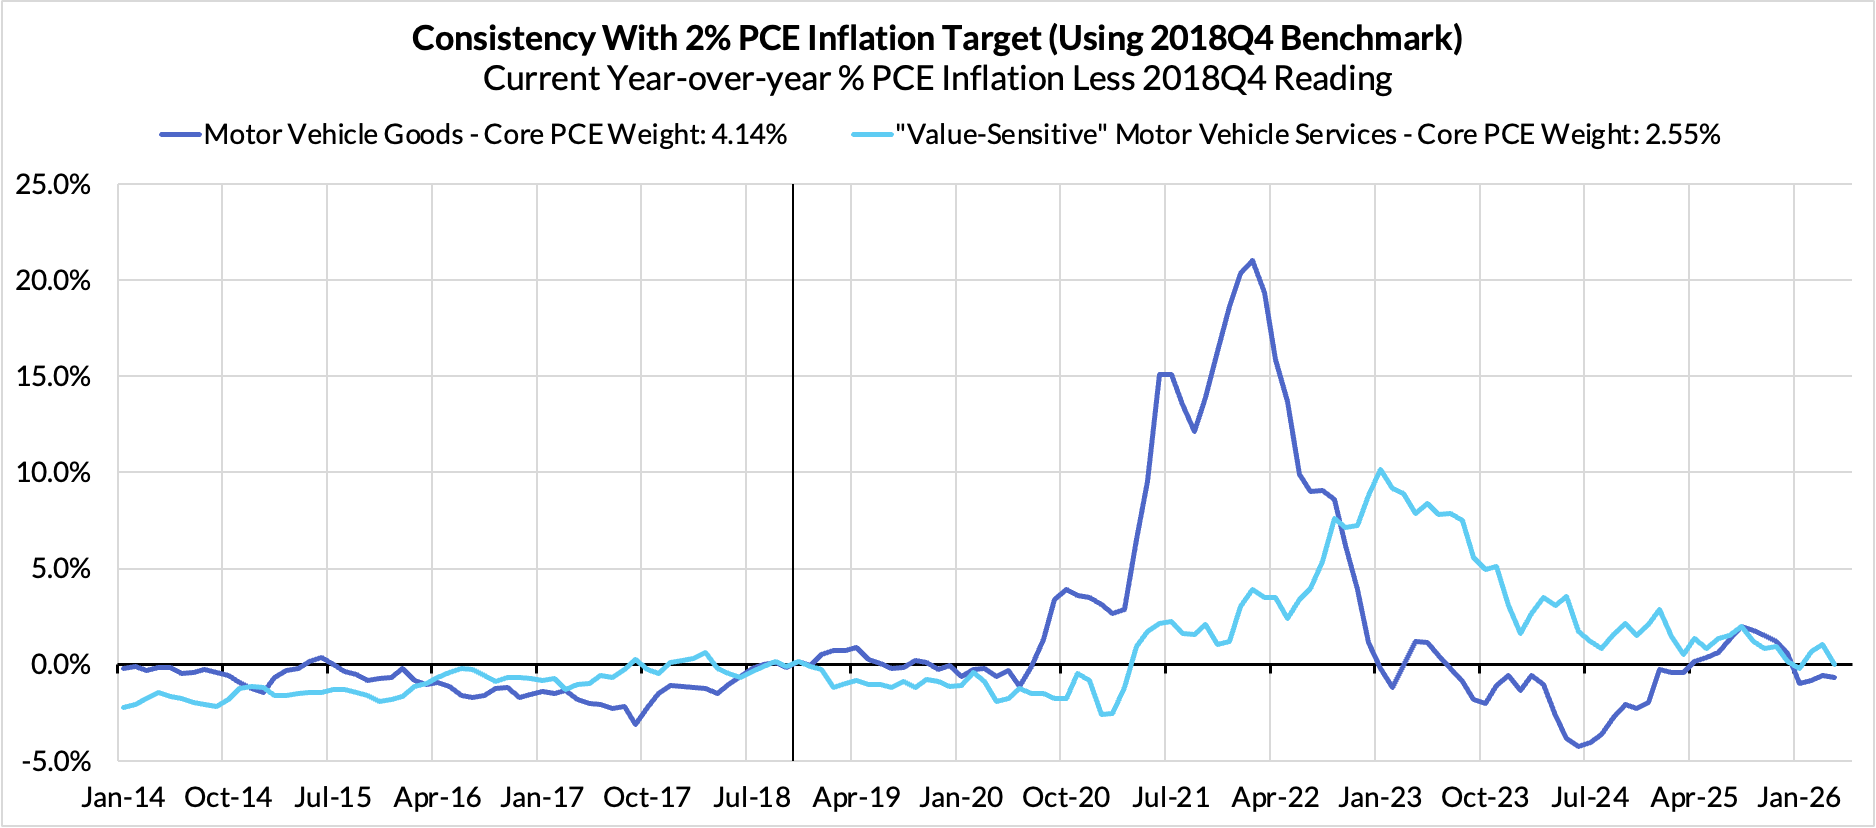
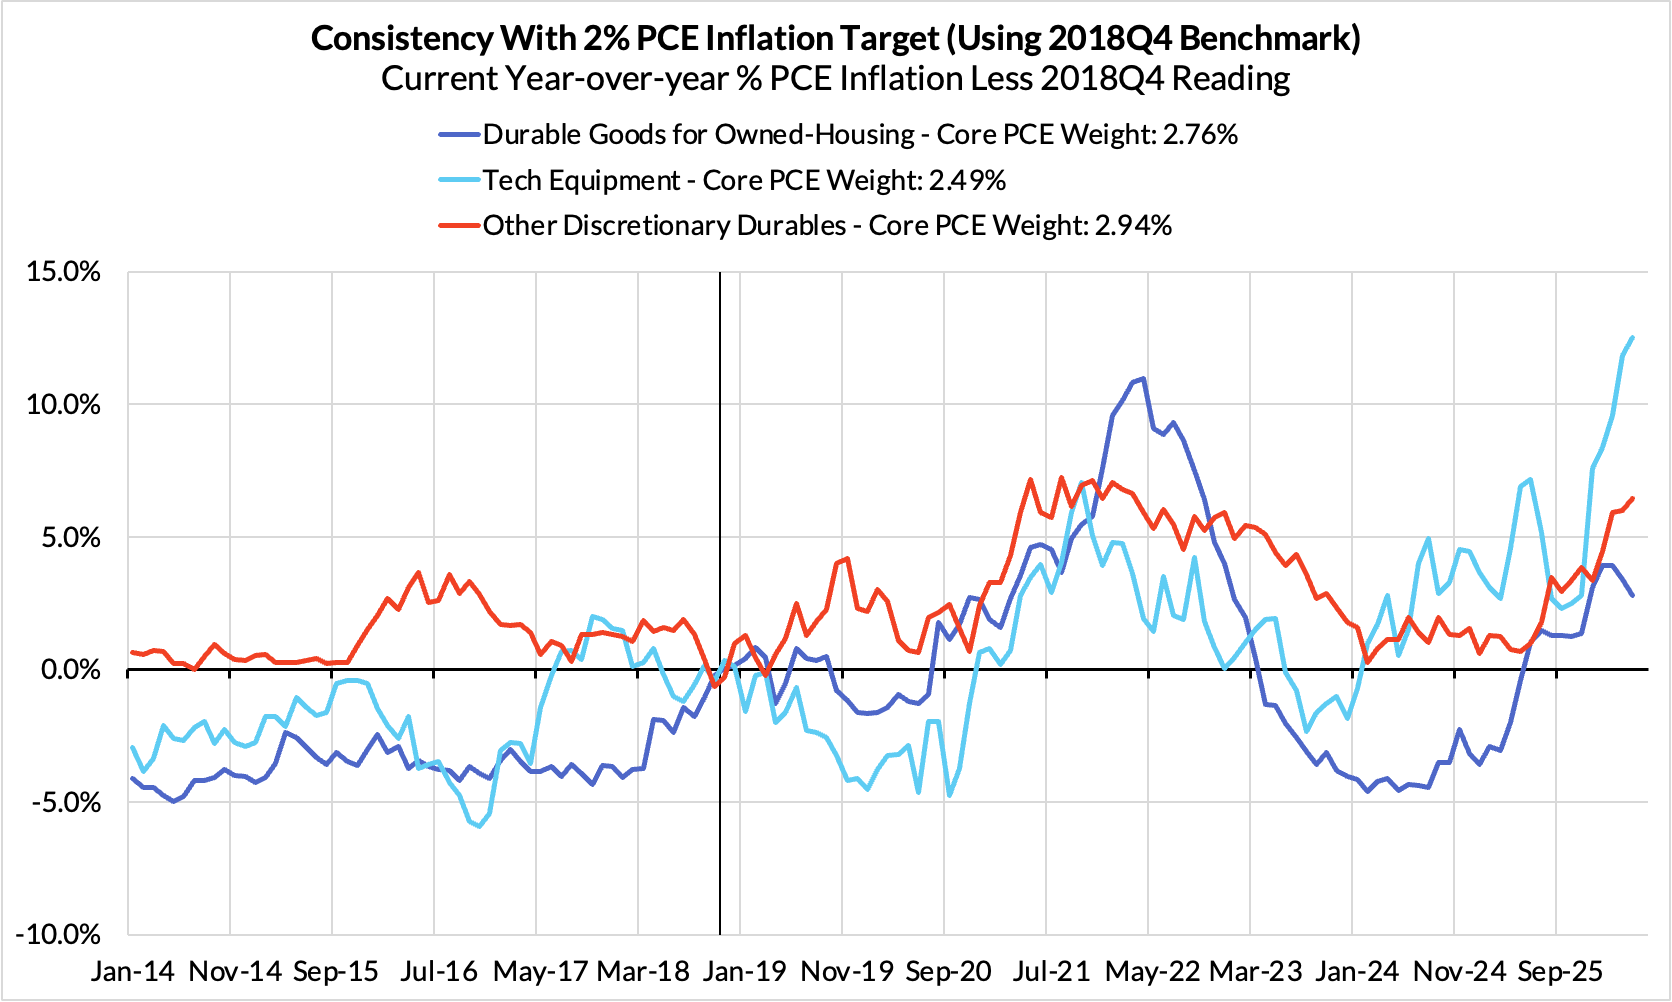
Even after cutting through the housing inflation quirk that greased up April monthly inflation and taking a holistic view that deals with the offsetting downside quirk in October, Core PCE is running at a 3.64% annualized rate over the last 7 months. That's a lot of inflation for the Fed to look through, and the causes are not uniform. Hormuz closure is clearly boosting airfares and may soon spillover to food and restaurant prices in H2. Tariffs are still seeping through more goods prices, with some major segments of unaffected prices vulnerable to upside risk (autos). And the AI boom is starting to have a broader impact on the prices of tech equipment as a result of data centers bidding up the price of hardware.
While we do think most of the inflationary overshoot is attributable to supply-side forces, it is also worth warning that these forces can also deliver broad-based and somewhat persistent inflationary effects. Even if such reasoning proves flawed and incomplete, that alone may motivate the Fed to hike later this year, especially if they feel compelled to stave off the risk of deanchoring inflation expectations.
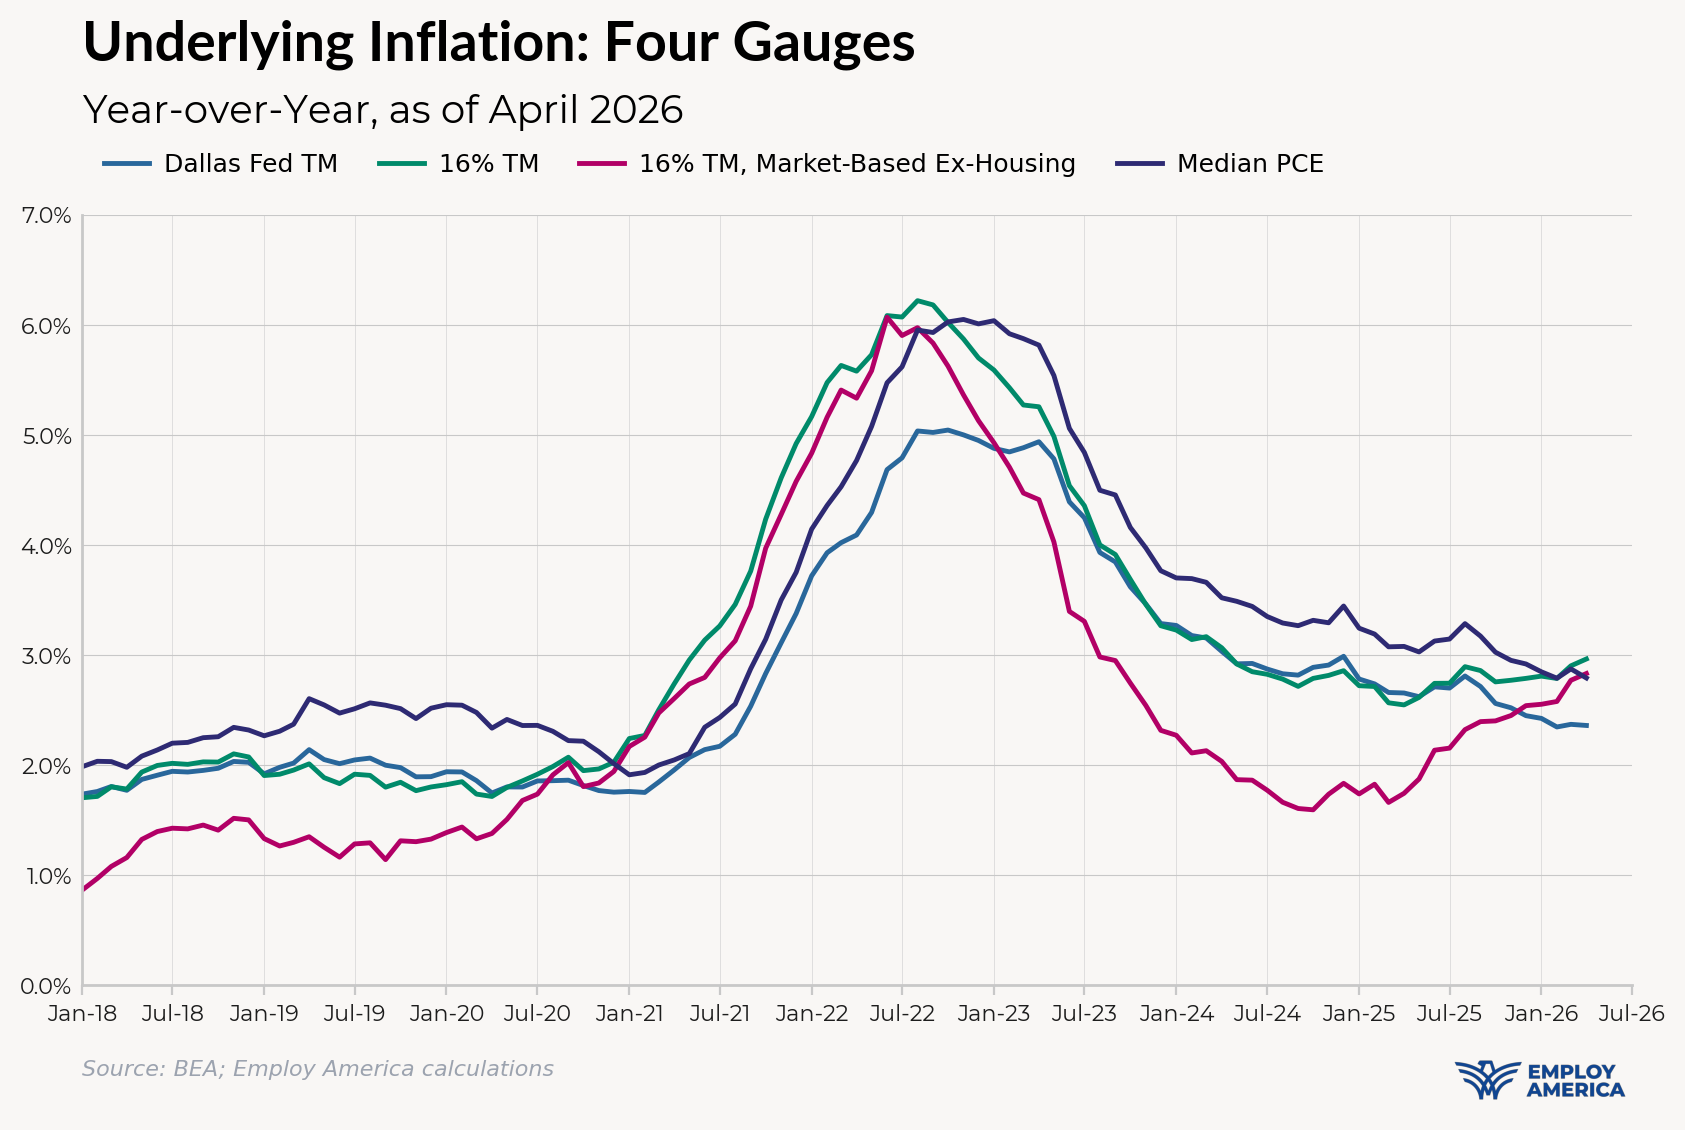
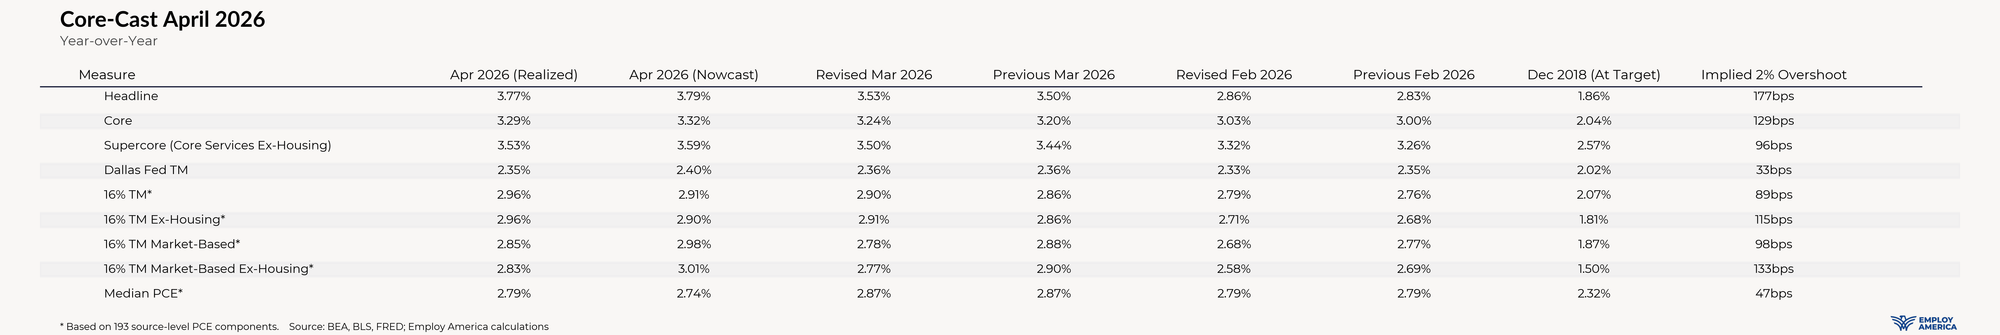
Kevin Warsh's recently favored gauge – the Dallas Fed Trimmed Mean – remained static in its year-over-year reading from March to April. Median PCE inflation also ticked down, but these two measures come with their own problems that belie what other measures of inflationary breadth reveal. The Dallas Fed Trimmed Mean is highly levered to price indices that are not based on market-observed prices ("non-market-based" prices and housing), but worse yet, the trimmed mean is not symmetric. There is forward-looking information about the trajectory of inflation located in the skew of price changes. Just looking at the median component or an intentionally asymemtric gauge that cuts off over half of PCE loses too much information.
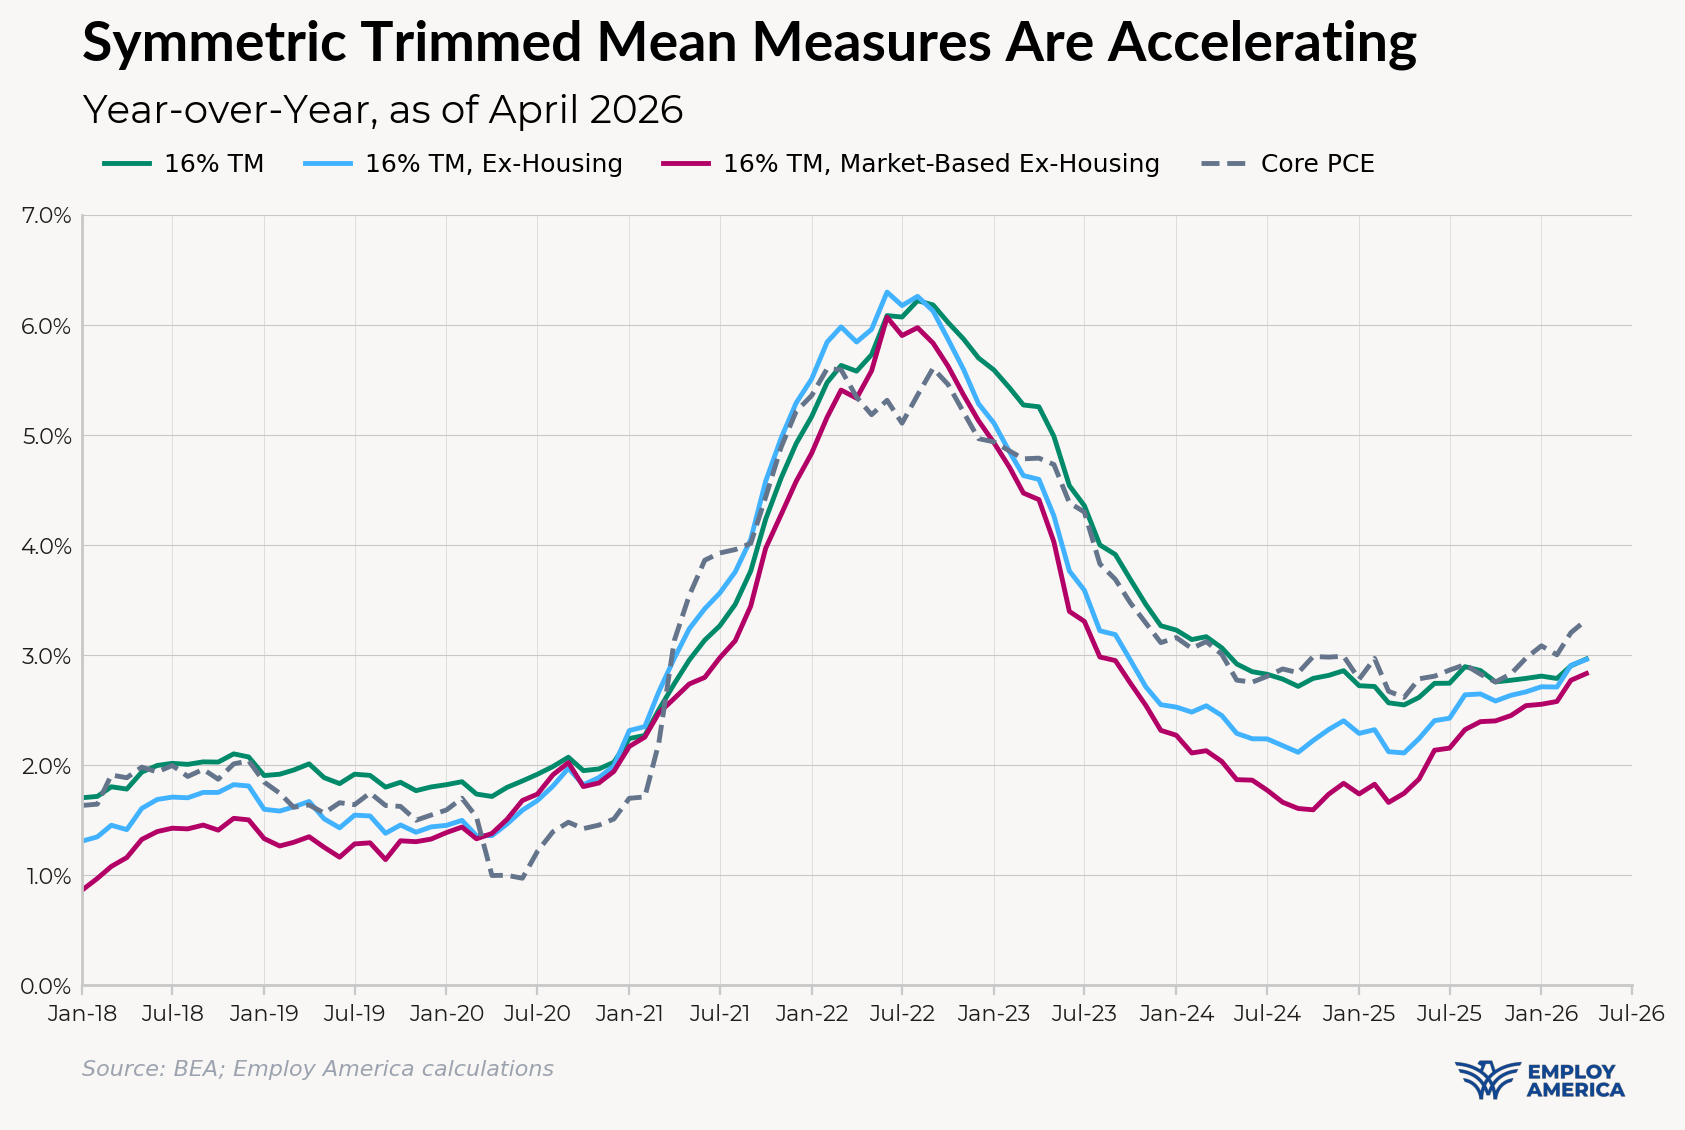
An agnostic symmetric approach to trimmed mean inflation shows clear acceleration since the first quarter of 2025. 16% trimmed means of PCE components (as is done for CPI by the Cleveland Fed) shows marginal acceleration. It grows more noticeable and forward-looking when the emphasis shifts to PCE components that are based on prices observed in actual markets for goods and services.
So while Chair Warsh has some opportunity now to median and Dallas Fed Trimmed Mean PCE to make the dovish case to his colleagues, a deeper dive into the data (as all Fed staff and FOMC members are likely to delve into) will reveal that inflation is getting more broad-based, not less. Cherry picking the most benign inflation data is not likely to encourage a skeptical FOMC already concerned about inflation's unanticipated persistence.
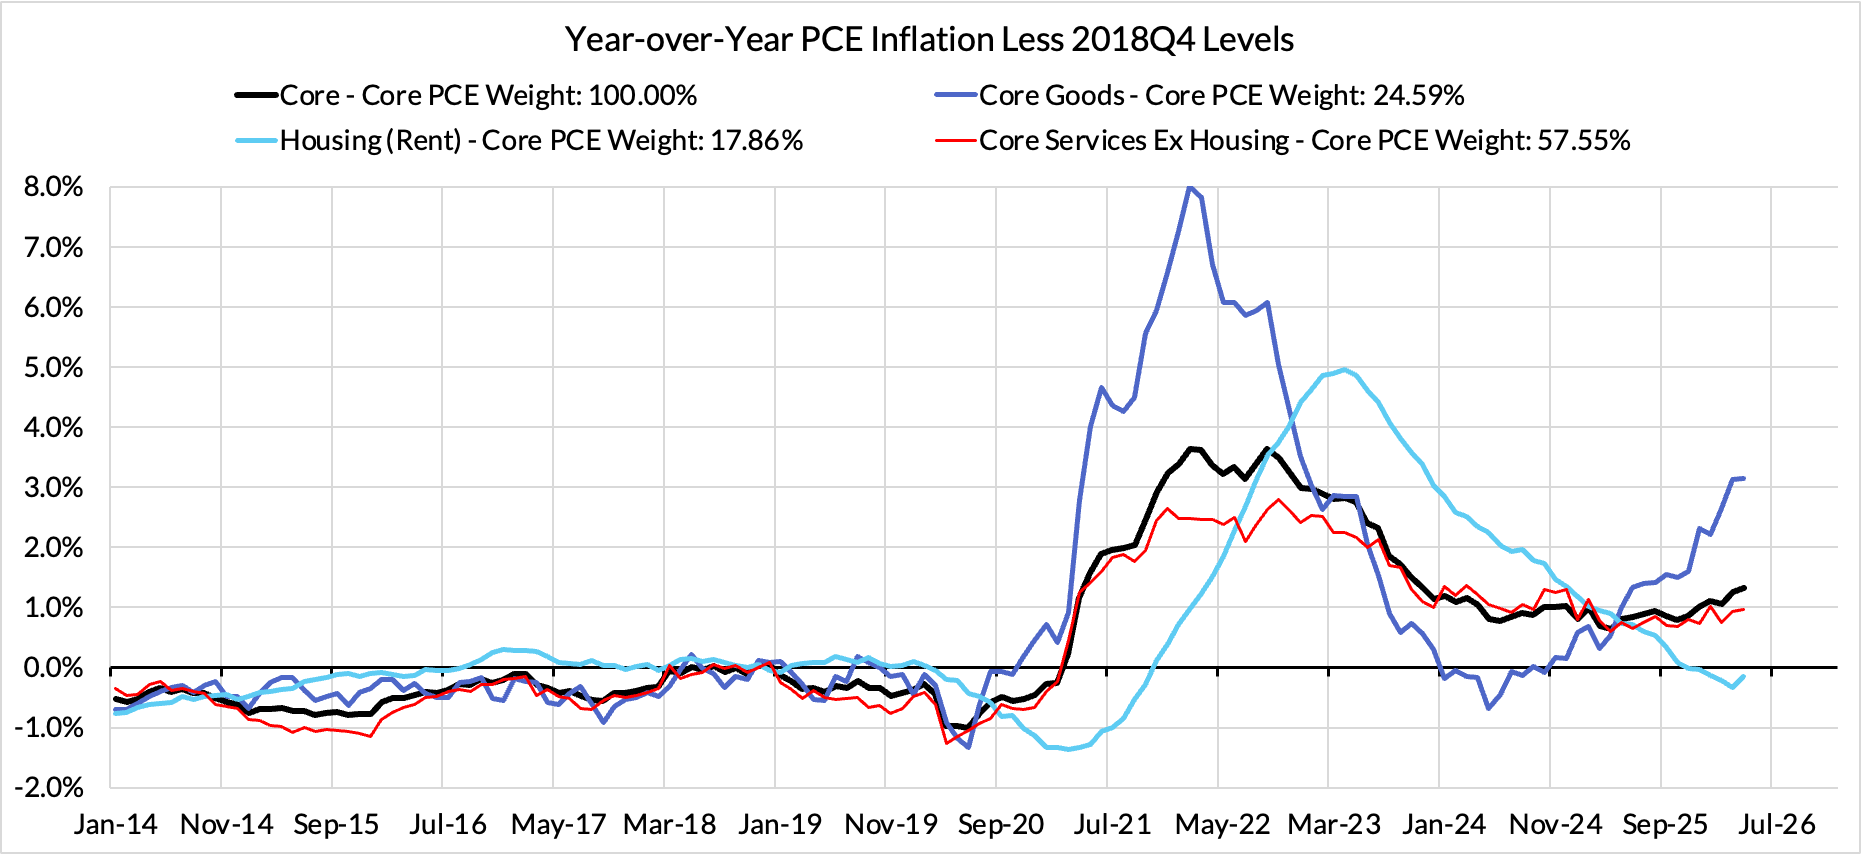
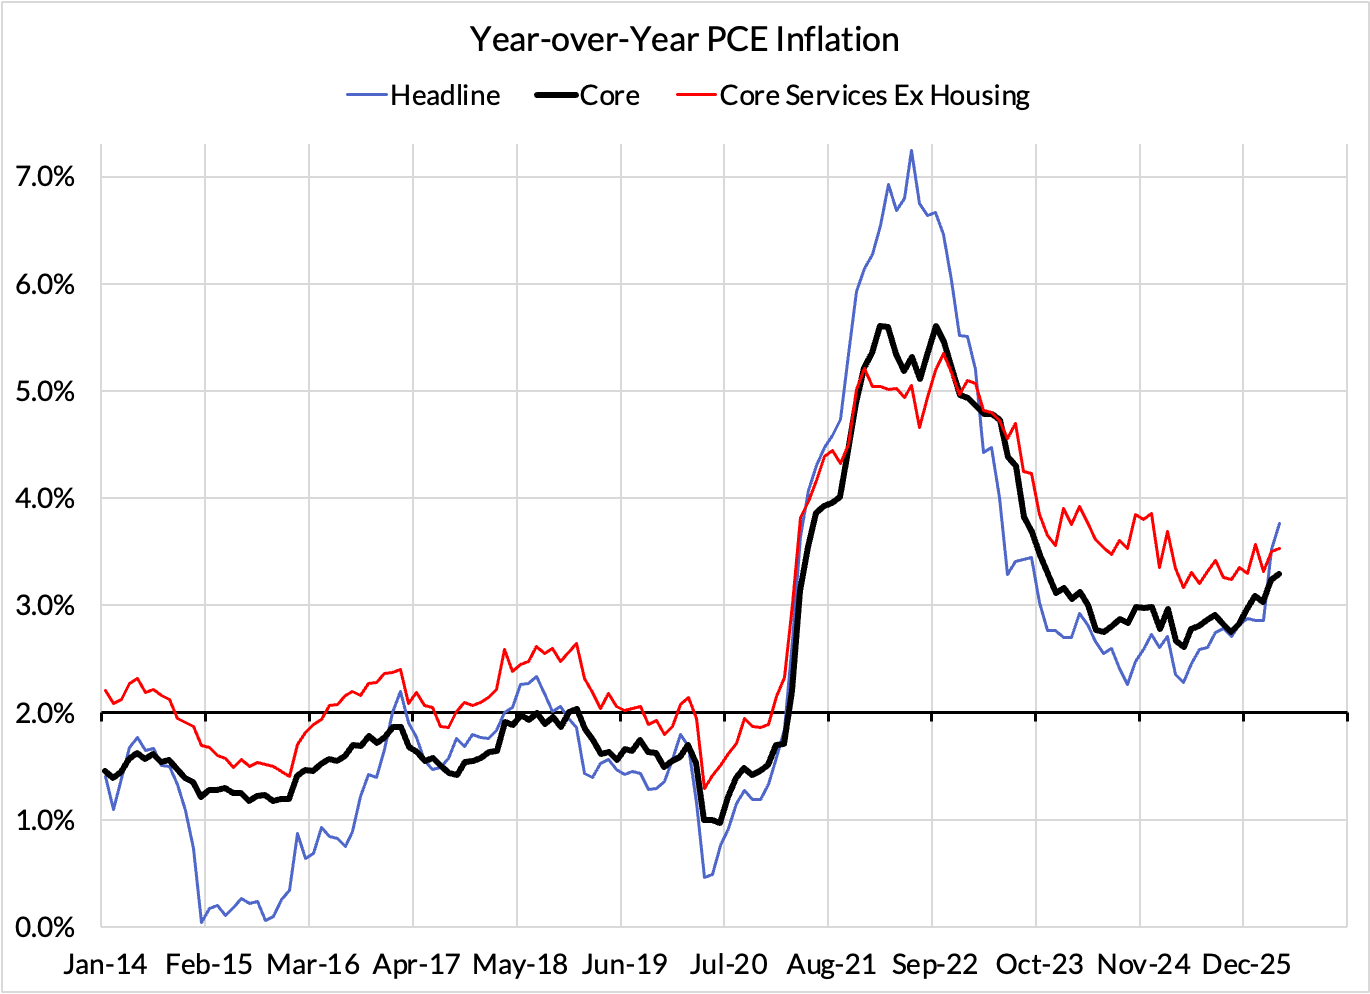
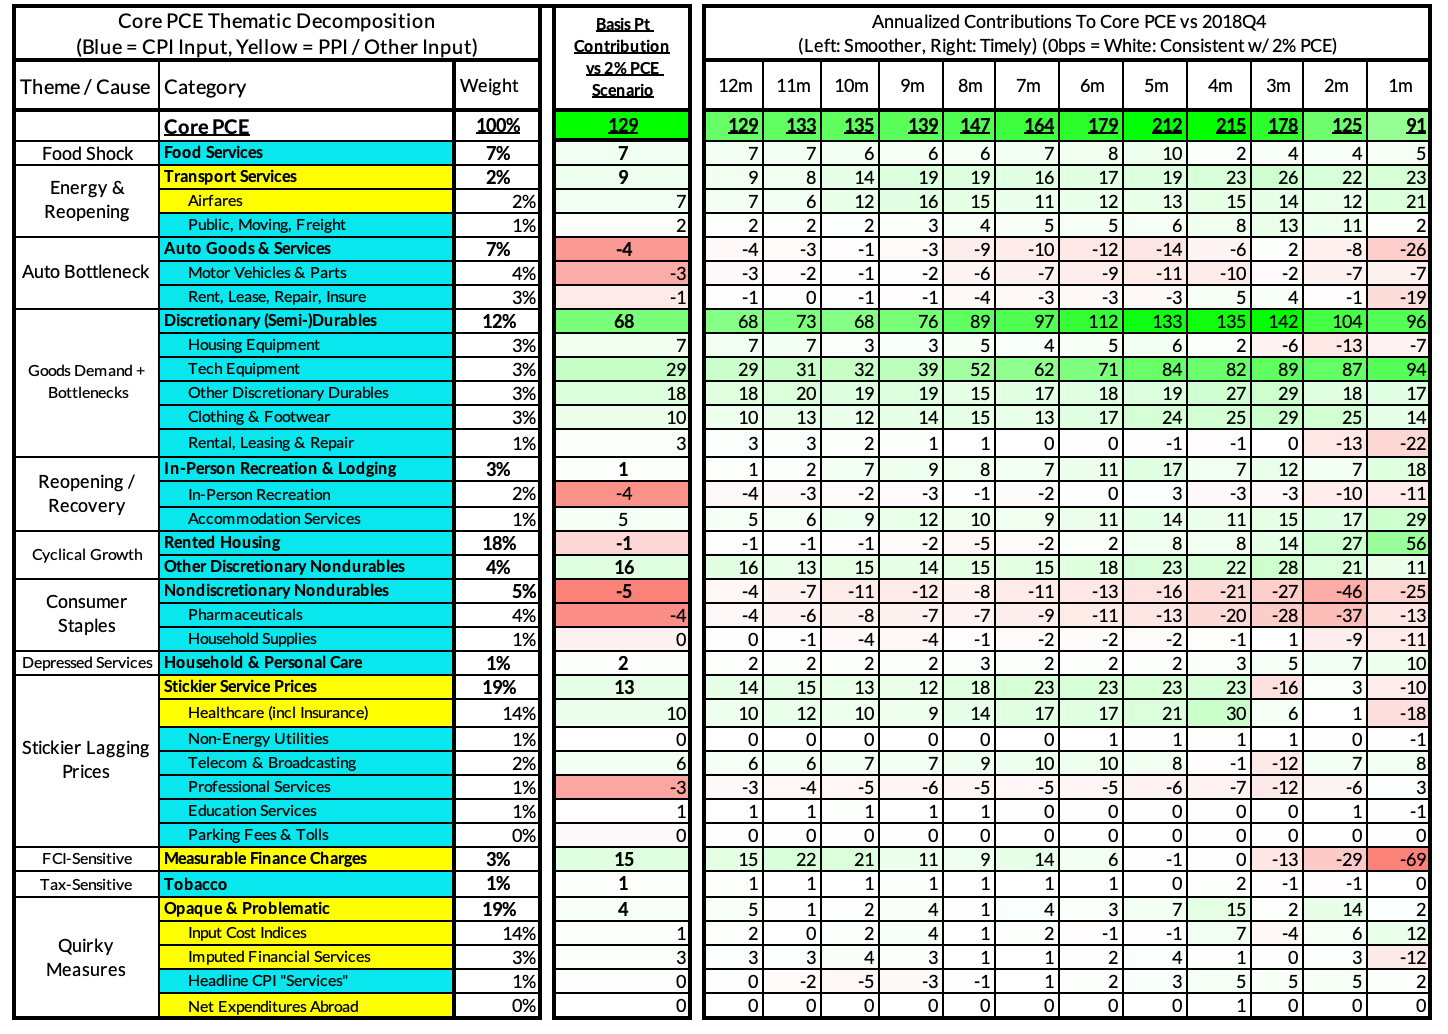
Right now Core PCE (PCE less food products and energy) is running at a 3.29% year-over-year pace as of April, 129 basis points above the Fed's 2% inflation target for PCE.
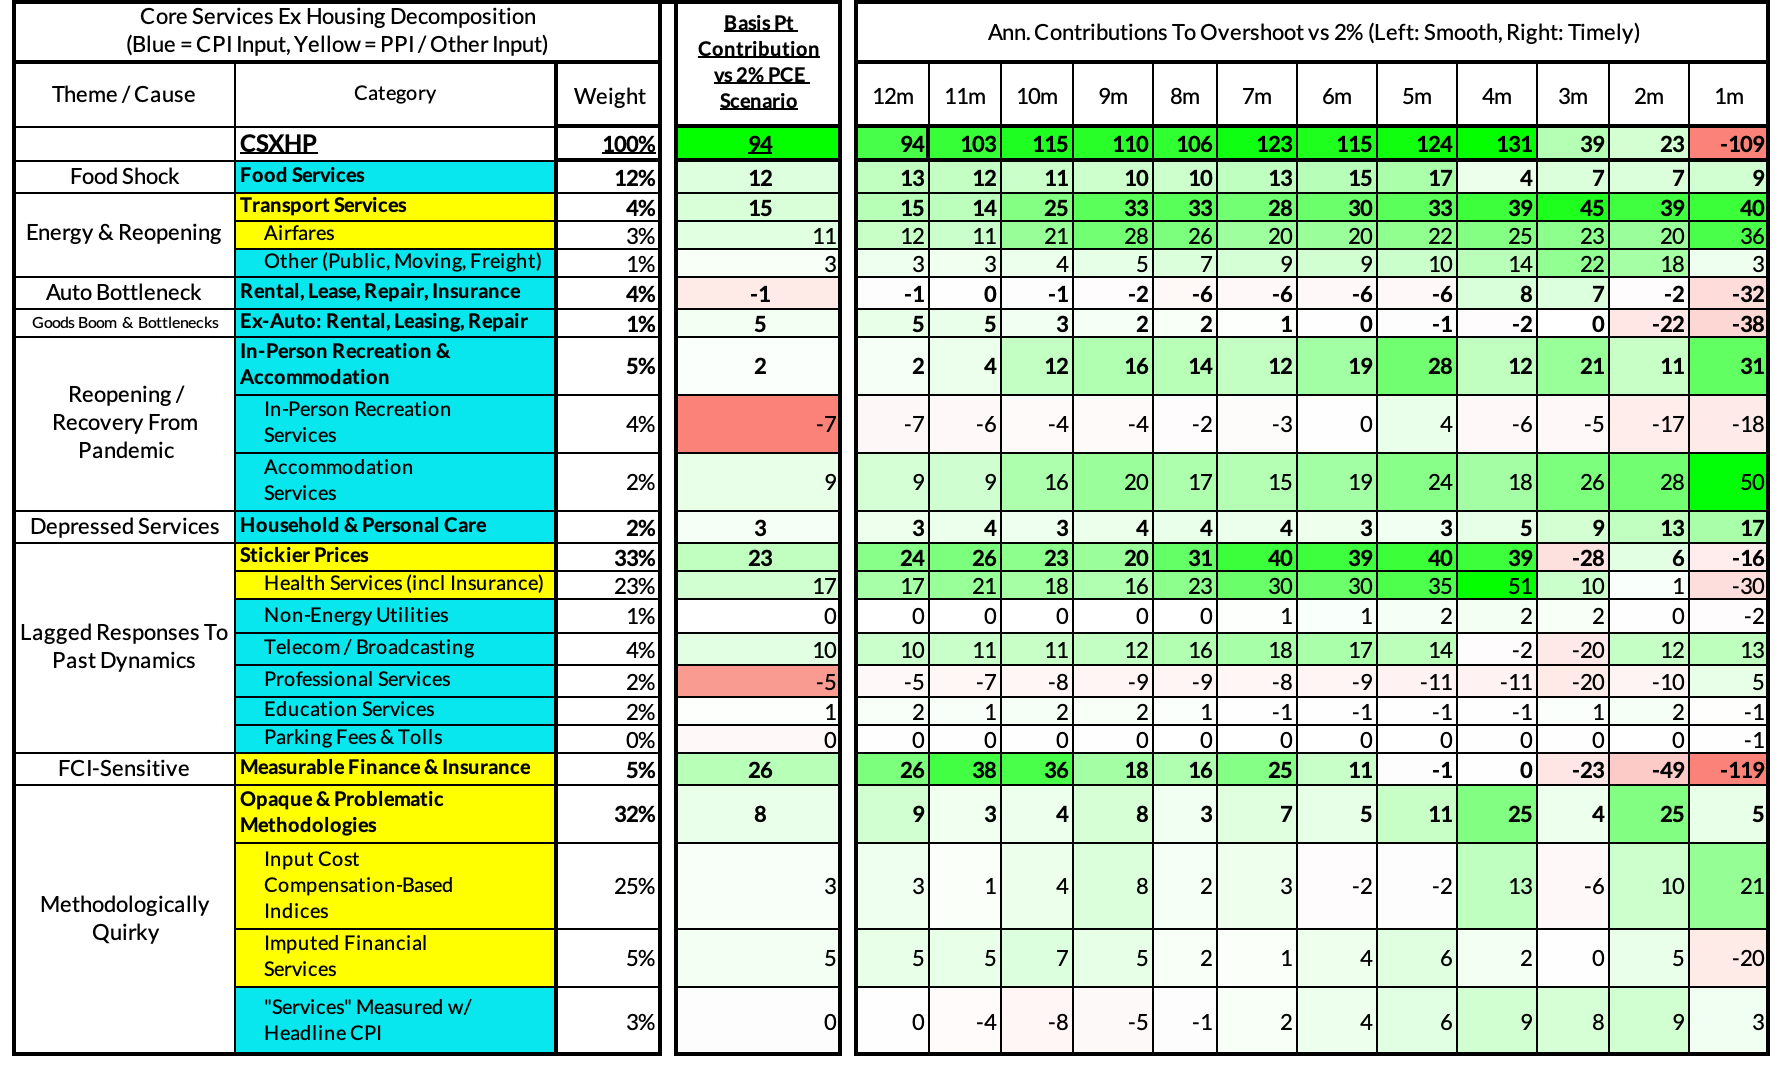
The contributors to the overshoot:
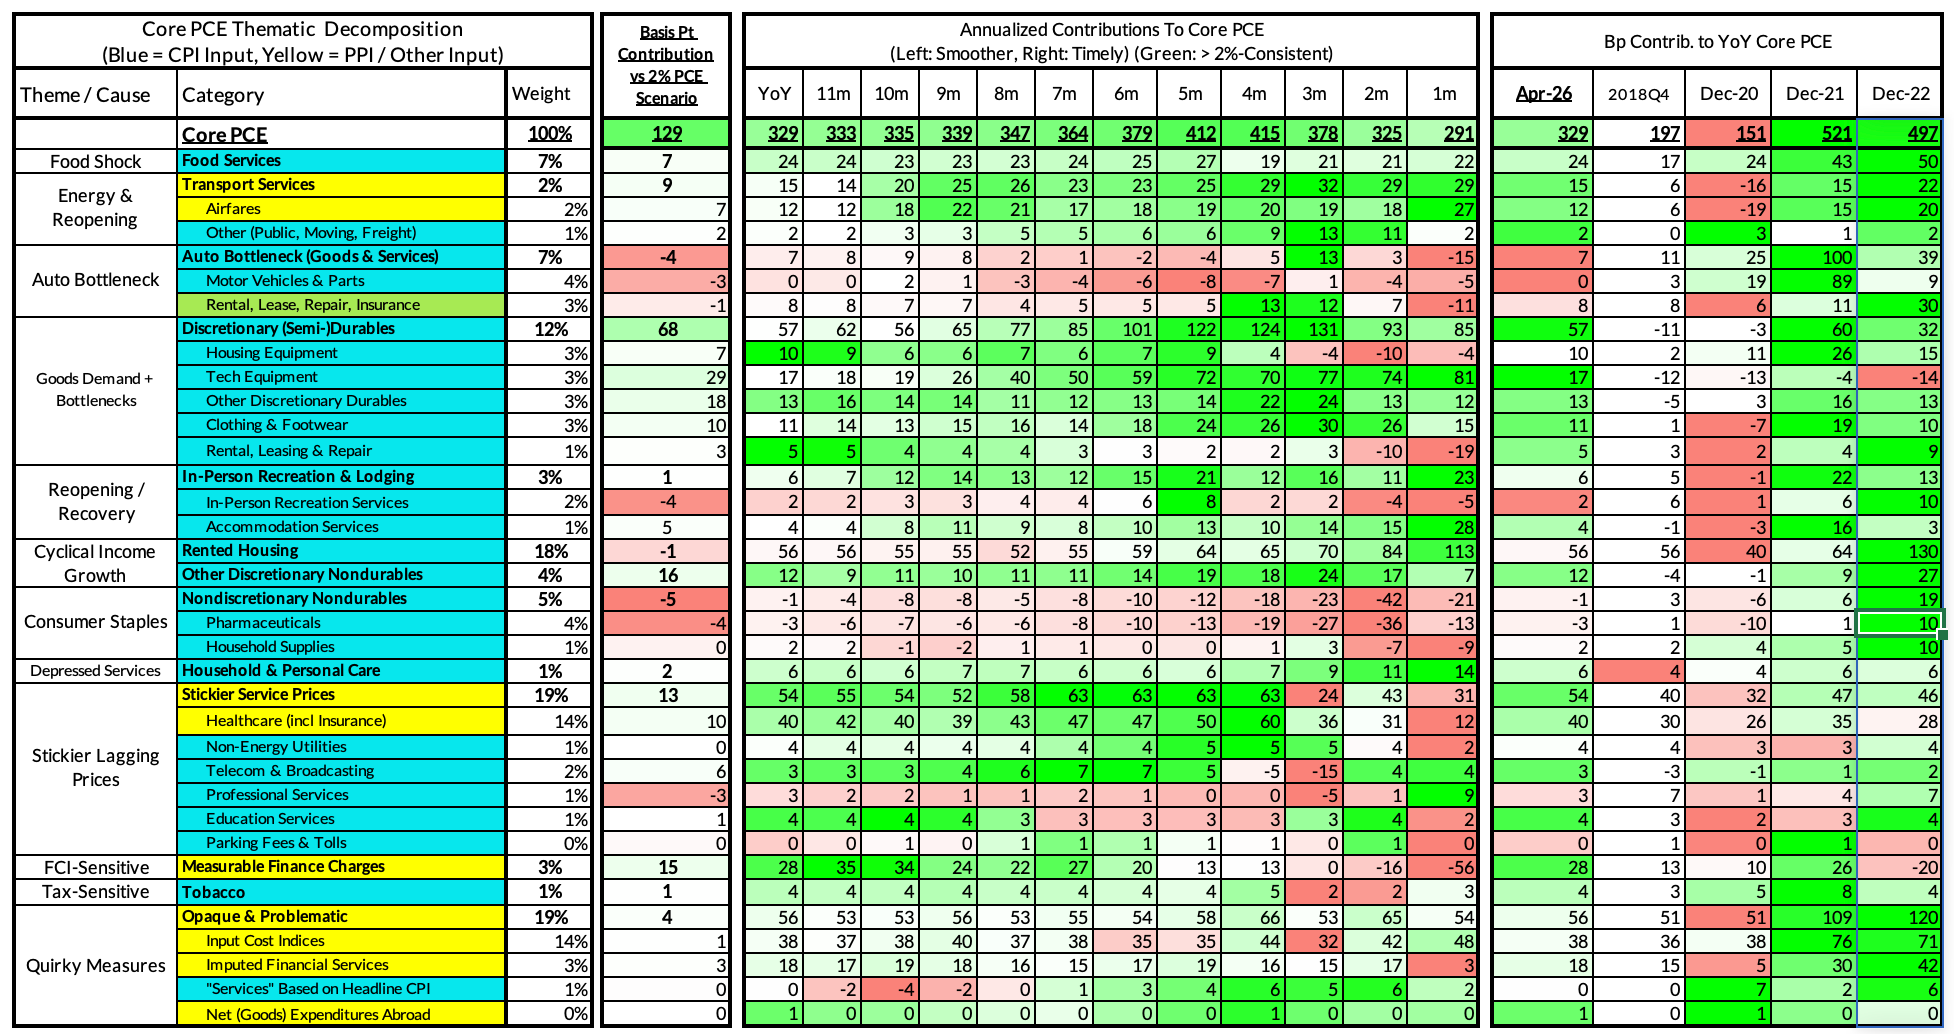
The second heatmap below gives you a sense of the overshoot on shorter annualized run-rates. April monthly annualized Core PCE is running at a 2.91% annualized pace, a 91 basis point overshoot vs 2% target inflation.
The April growth rate in "Core Services Ex Housing" ('Supercore') PCE is running at a 3.53% year-over-year pace, a 94 basis point overshoot versus the ~2.59% run rate that coincided with ~2% Headline and Core PCE inflation.
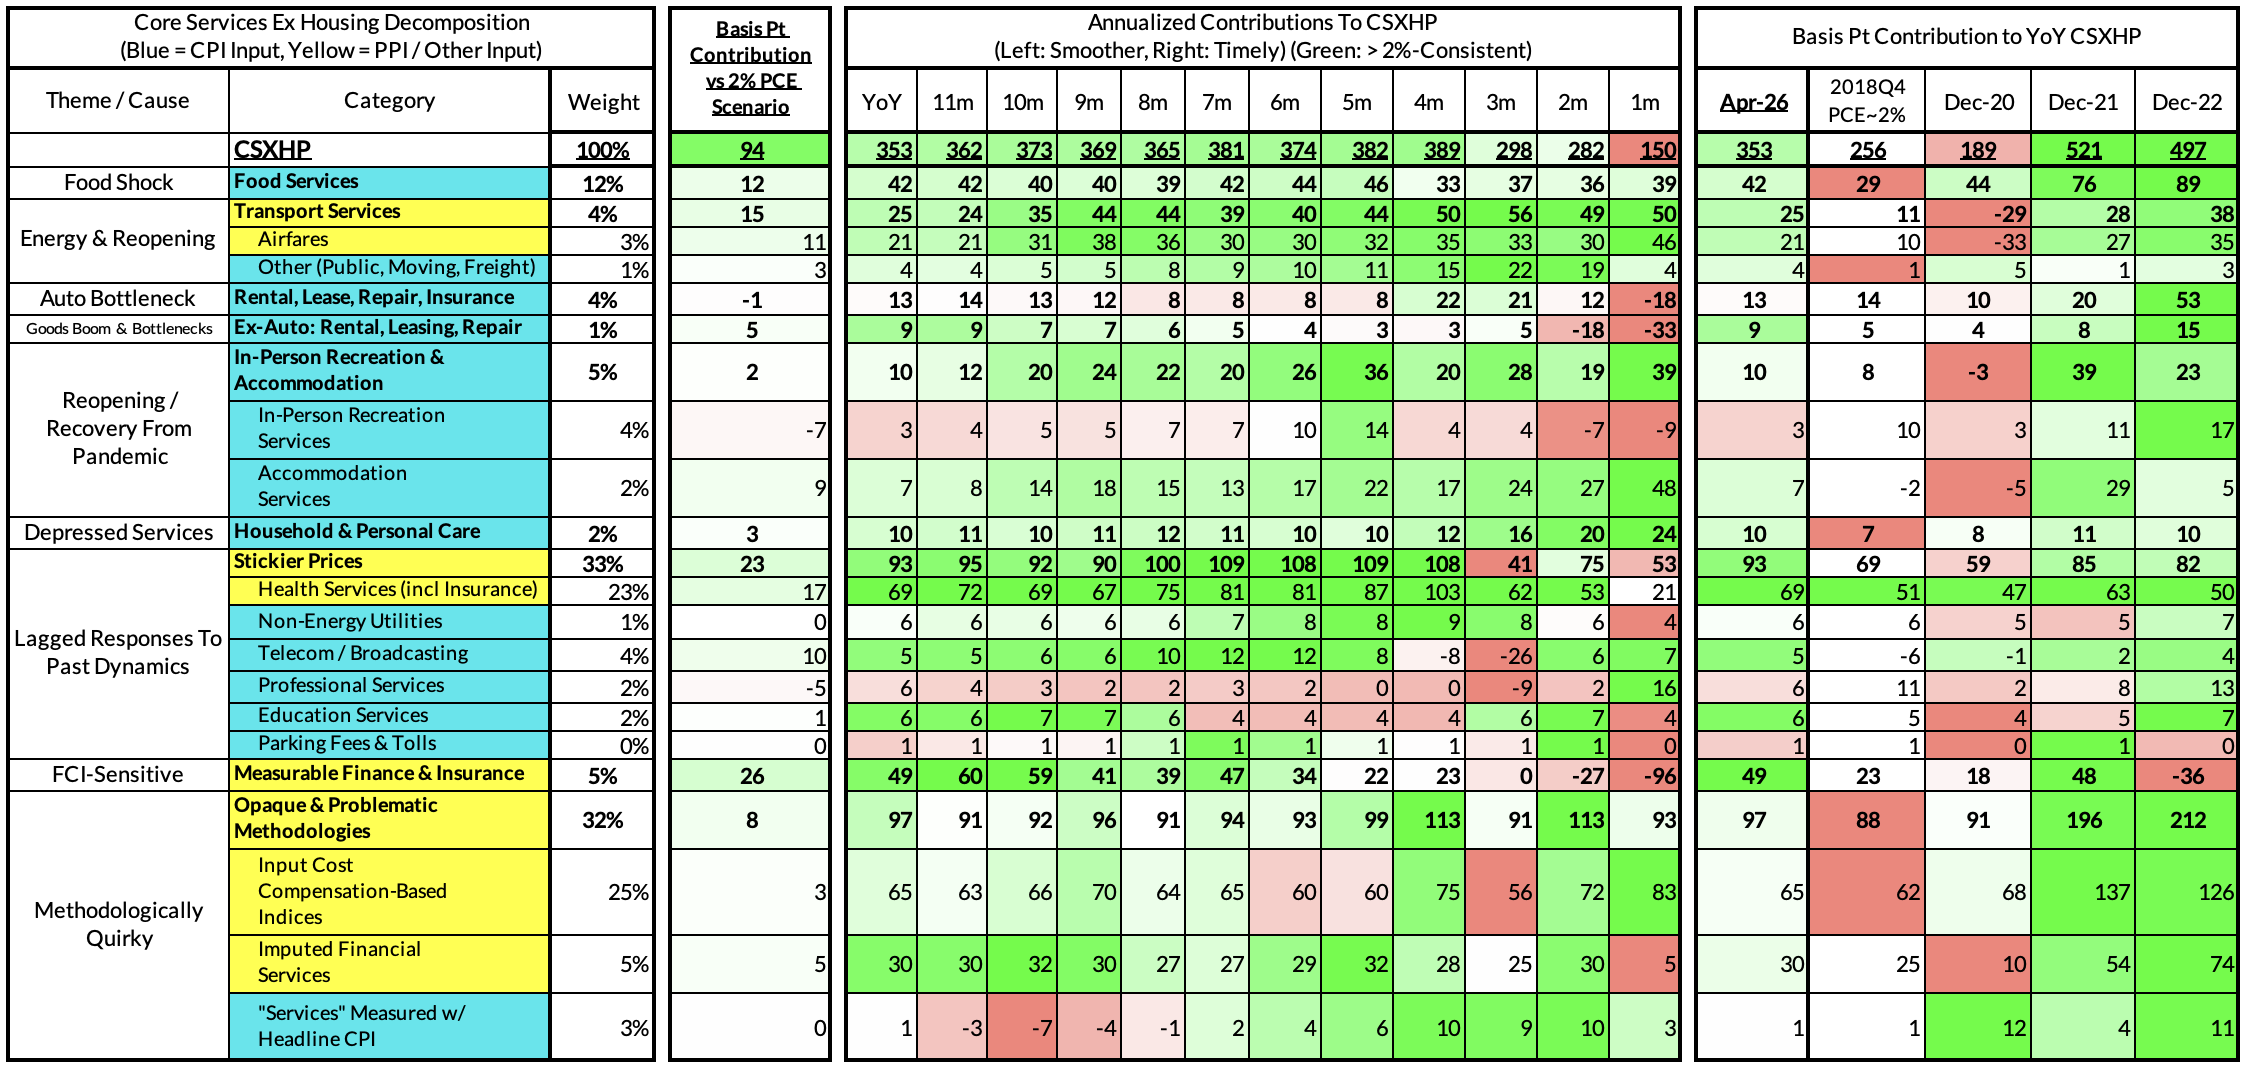
The April monthly supercore is is running at a 1.50% monthly annualized rate, a 109 basis point annualized undershoot of what would be consistent with 2% Headline and Core PCE.