Labor Market Recap July 2026
The Fed is confident that the labor market is steady enough that they can turn their eye towards inflation. Is the negative payrolls print today enough to shake that confidence? We don’t think so


The Fed is confident that the labor market is steady enough that they can turn their eye towards inflation. Is the negative payrolls print today enough to shake that confidence? We don’t think so
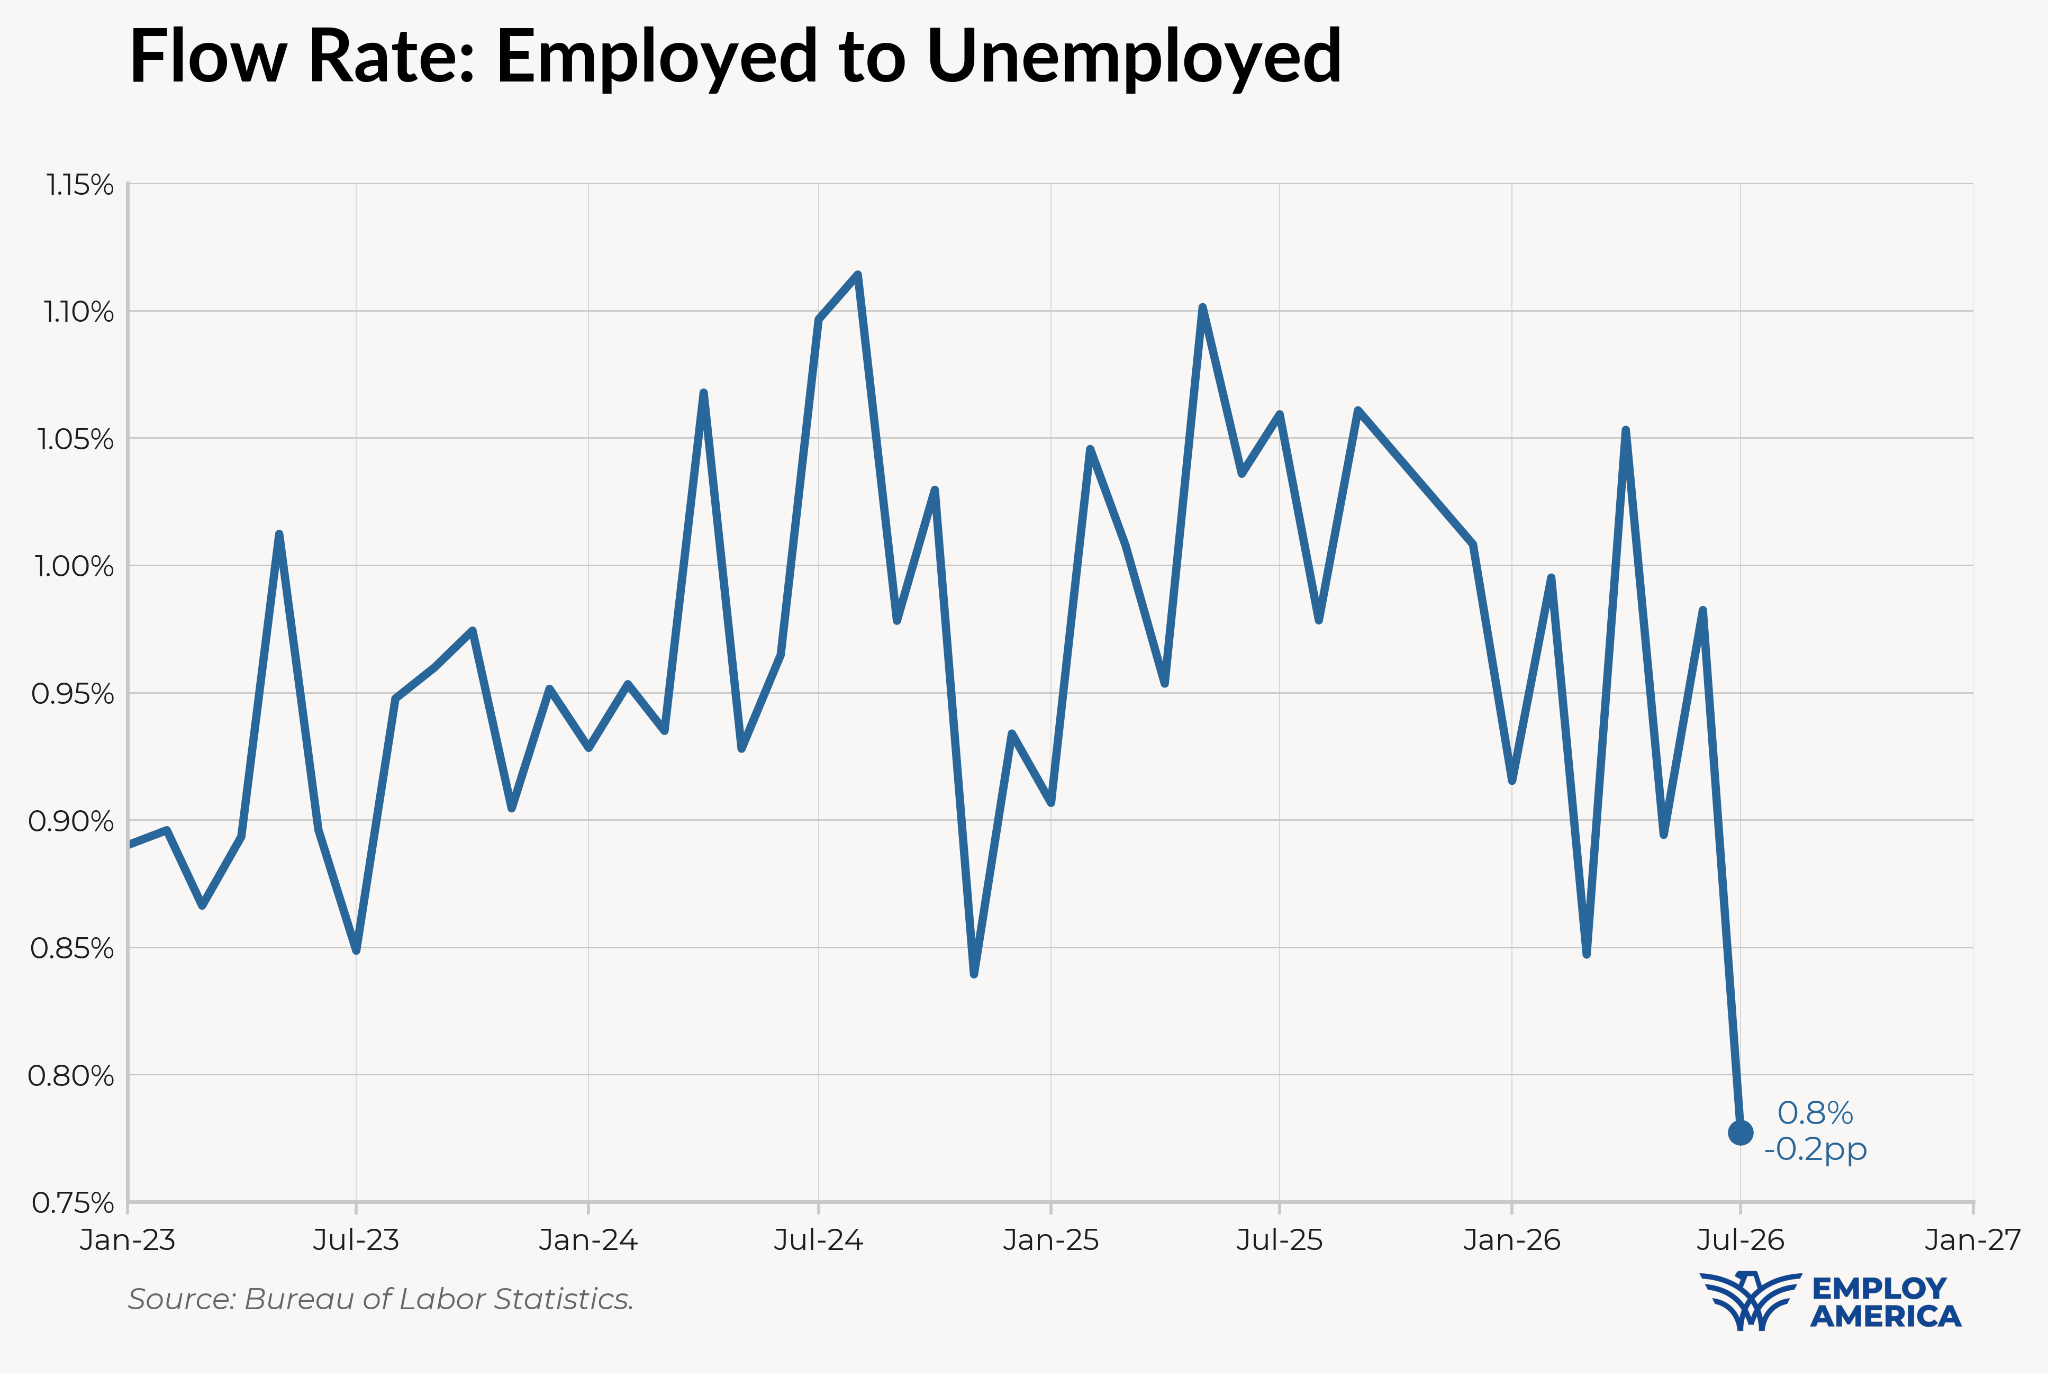
The unemployment rate fell by 0.10pp in July, while non-farm payrolls fell by 23,000 jobs and May and June payrolls were significantly revised down. Local government education payrolls accounted for the bulk of the decline in employment, losing 50,000 jobs (seasonally adjusted). This is another strange report, but after digesting all the details of the data, the labor market still looks pretty stable. Perhaps payrolls growth is not as strong as previously thought, but the breakeven payrolls growth target has been a moving target for a while. Meanwhile, the unemployment rate continues to stay steady and even grind lower as the flow of the employed into unemployment reaches new lows.
Despite the negative payrolls print, after the Fed fully digests the data, we don’t think they will be concerned about labor market risk. The bar to hikes is still high, and only a soft inflation print will deter them from a September hike.
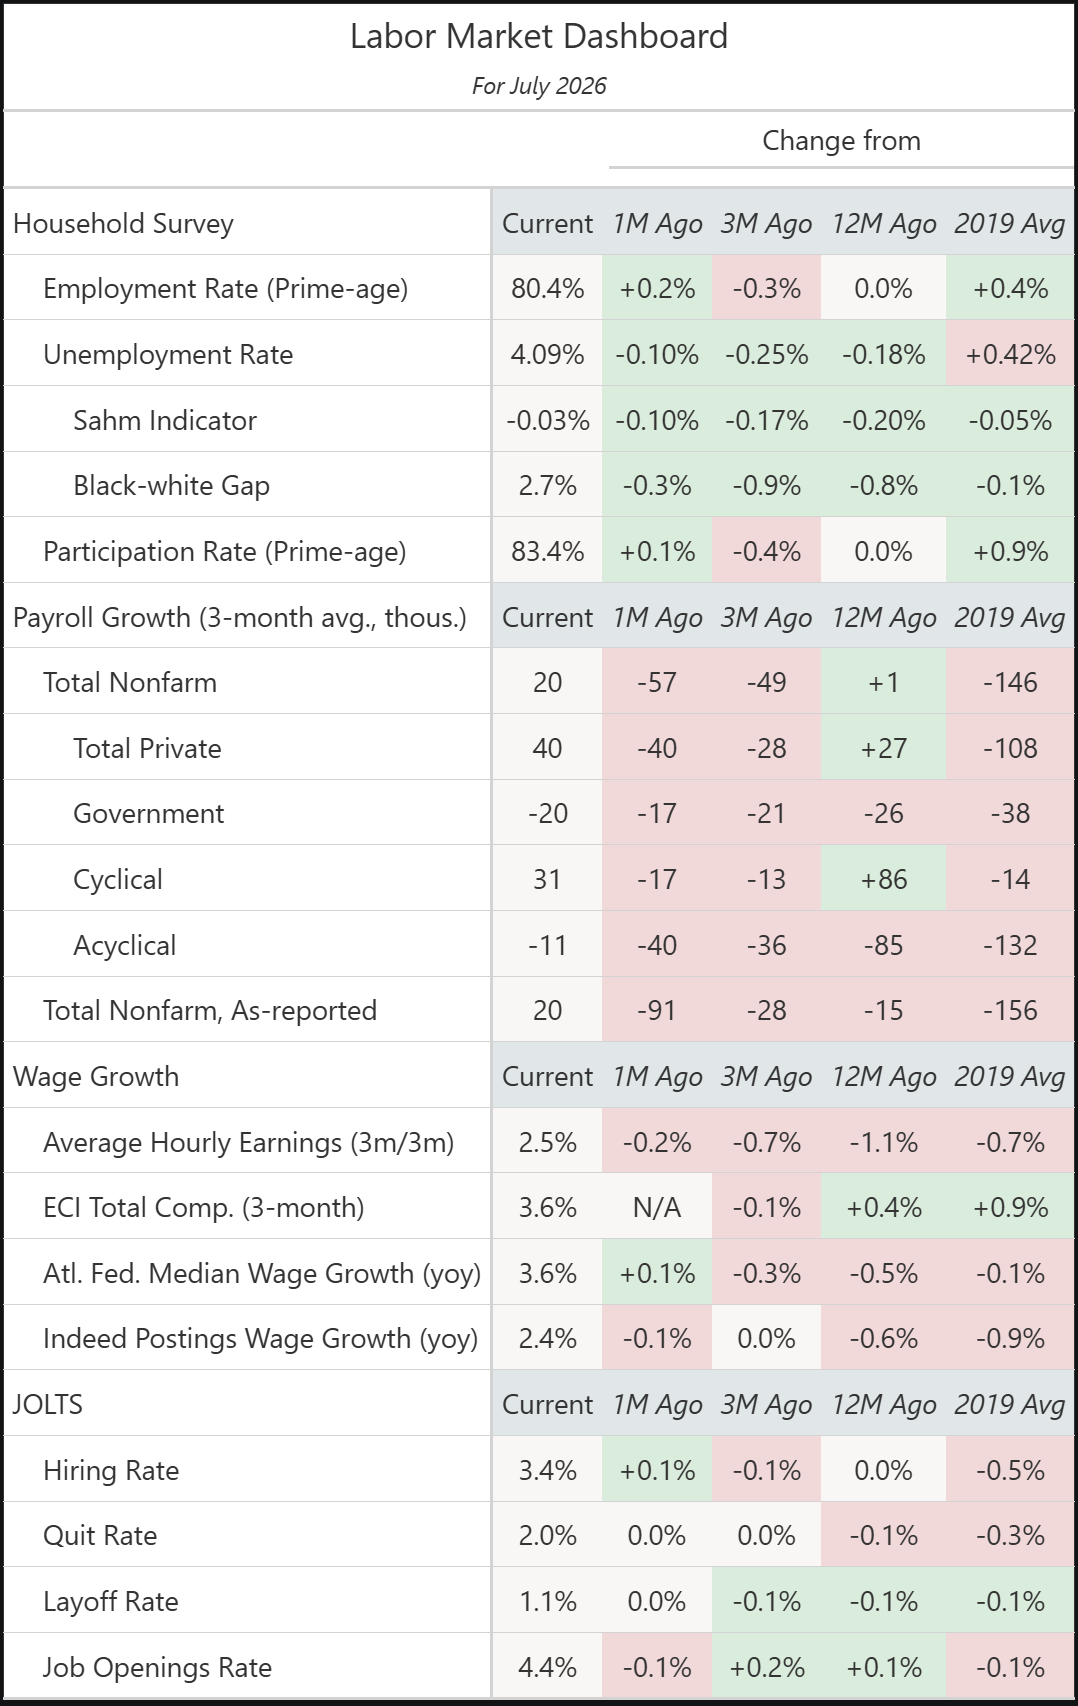
Nonfarm payrolls looked like it might have been reaccelerating over the past couple months, but July disappointed in a major way: We saw not only negative payrolls growth, but also substantial negative revisions to the previous two months. May’s growth was revised down by 66,000 and June’s was revised down by 37,000.
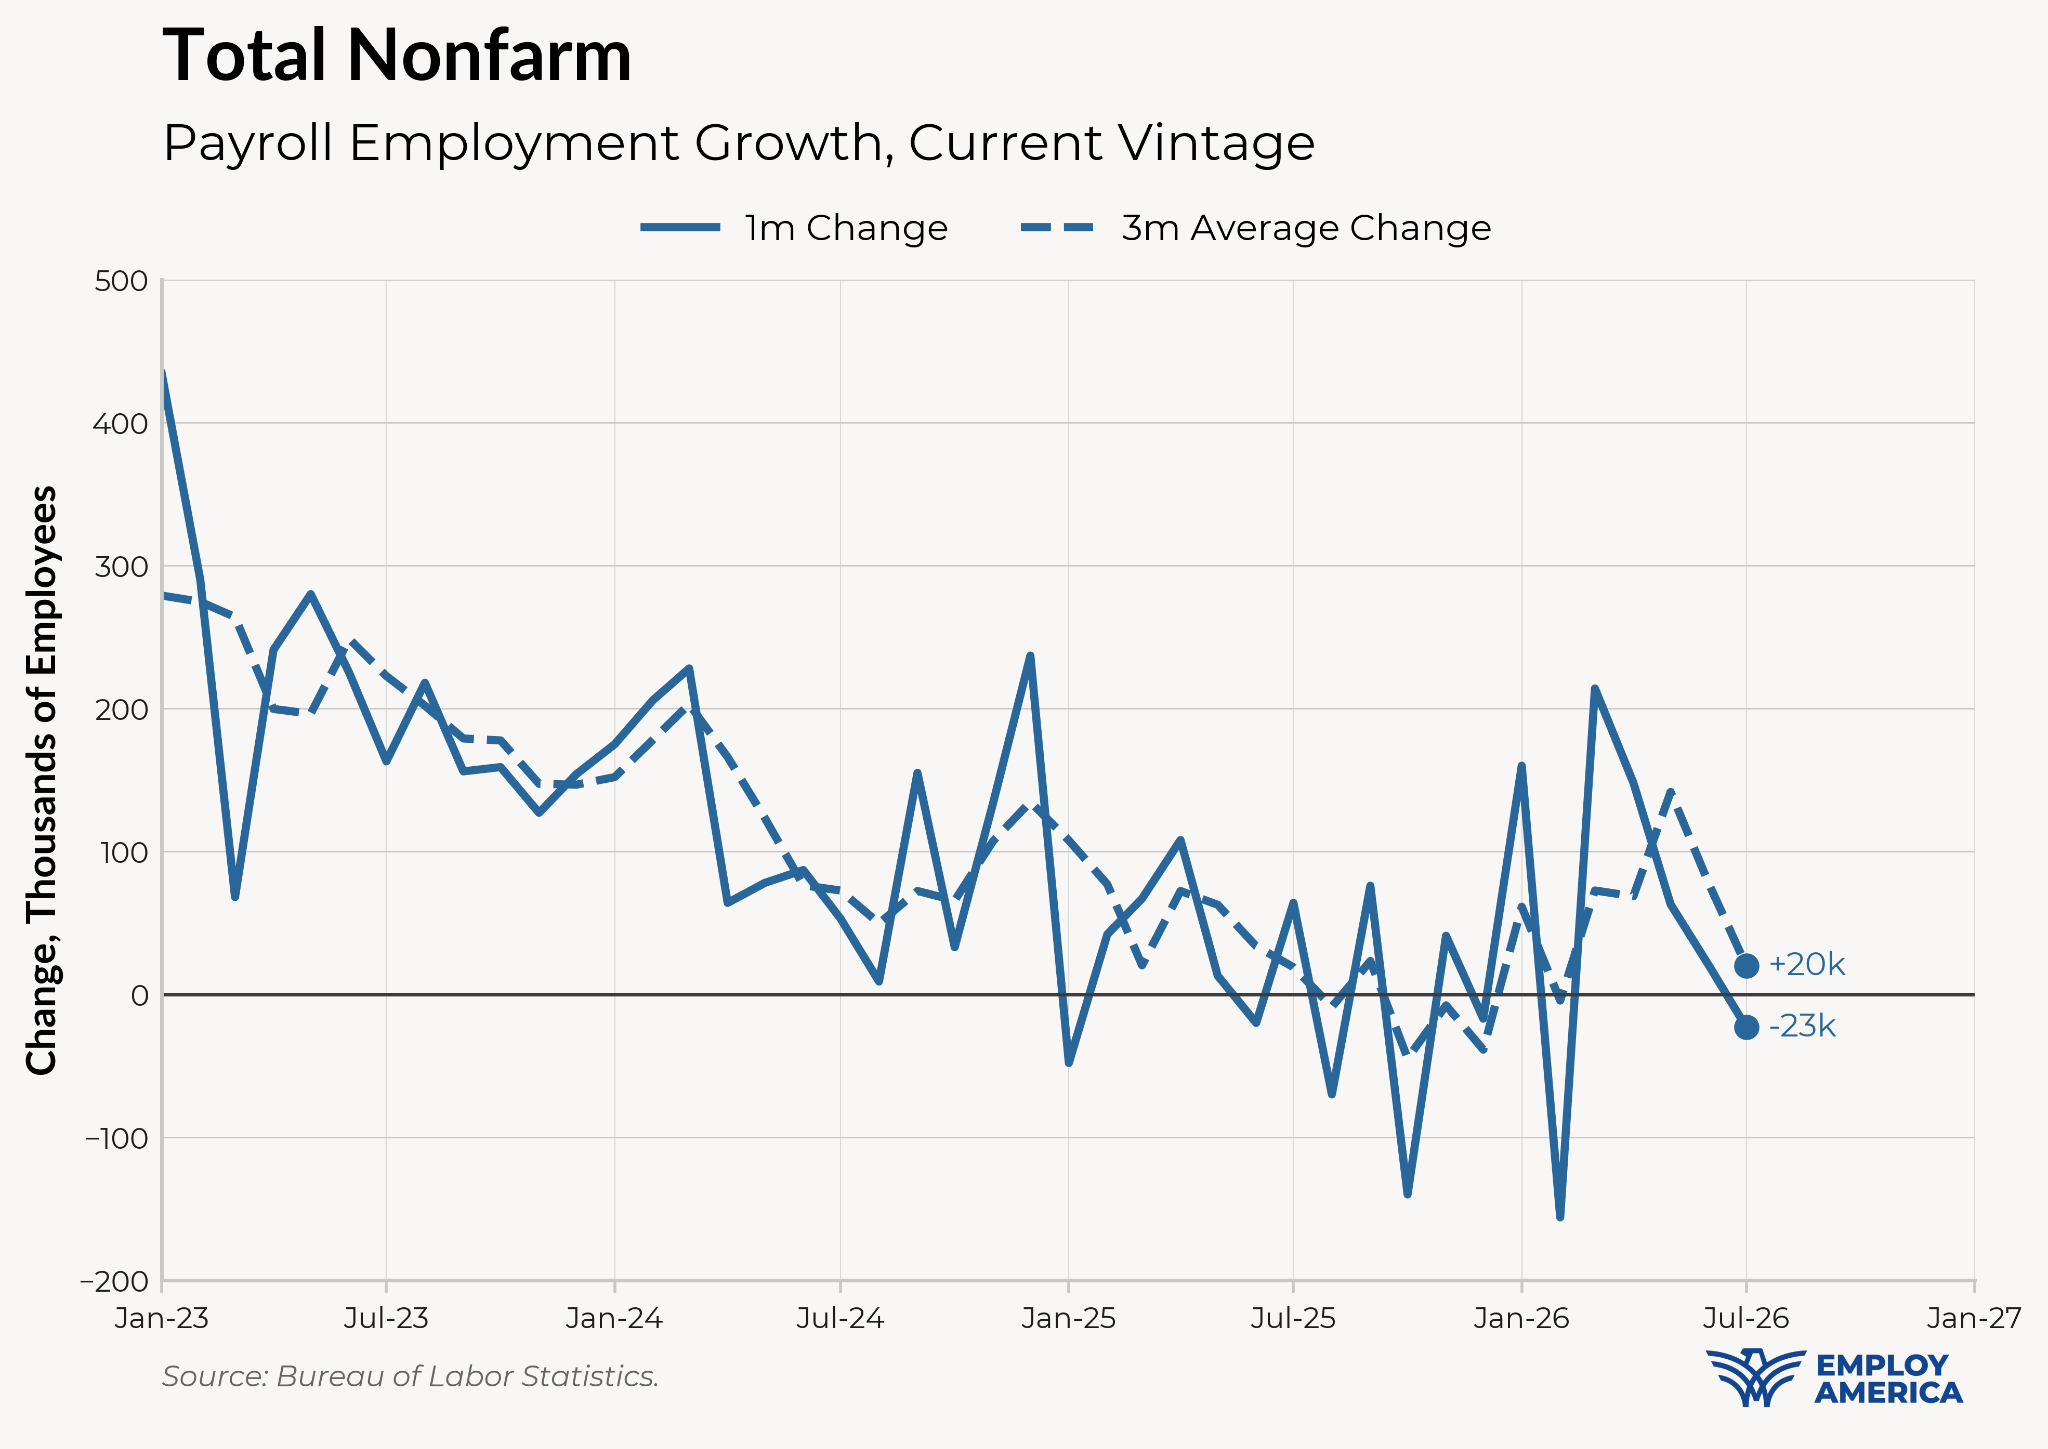
The miss in payrolls is almost entirely due to a decline in government employment, in particular local government education employment. This may be a seasonal quirk as local governments lose a lot of education workers every July; the miss is best thought of as a larger-than-expected decline in that sector this month. Since local government education is swinging so much during the summer, it’s totally possible that this is a seasonal quirk that will be ironed out over the next few months.
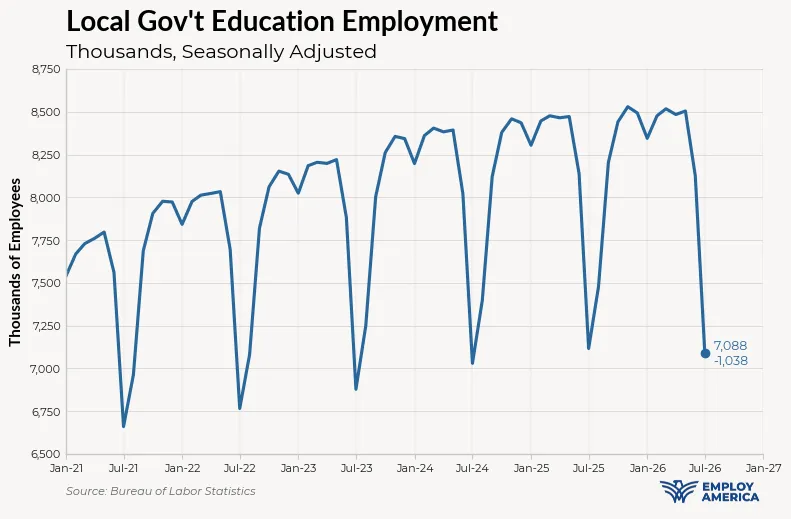
The other weak sector this month was leisure and hospitality employment, in particular food services. This is probably at least somewhat related to roll-off from the World Cup boost fading away.
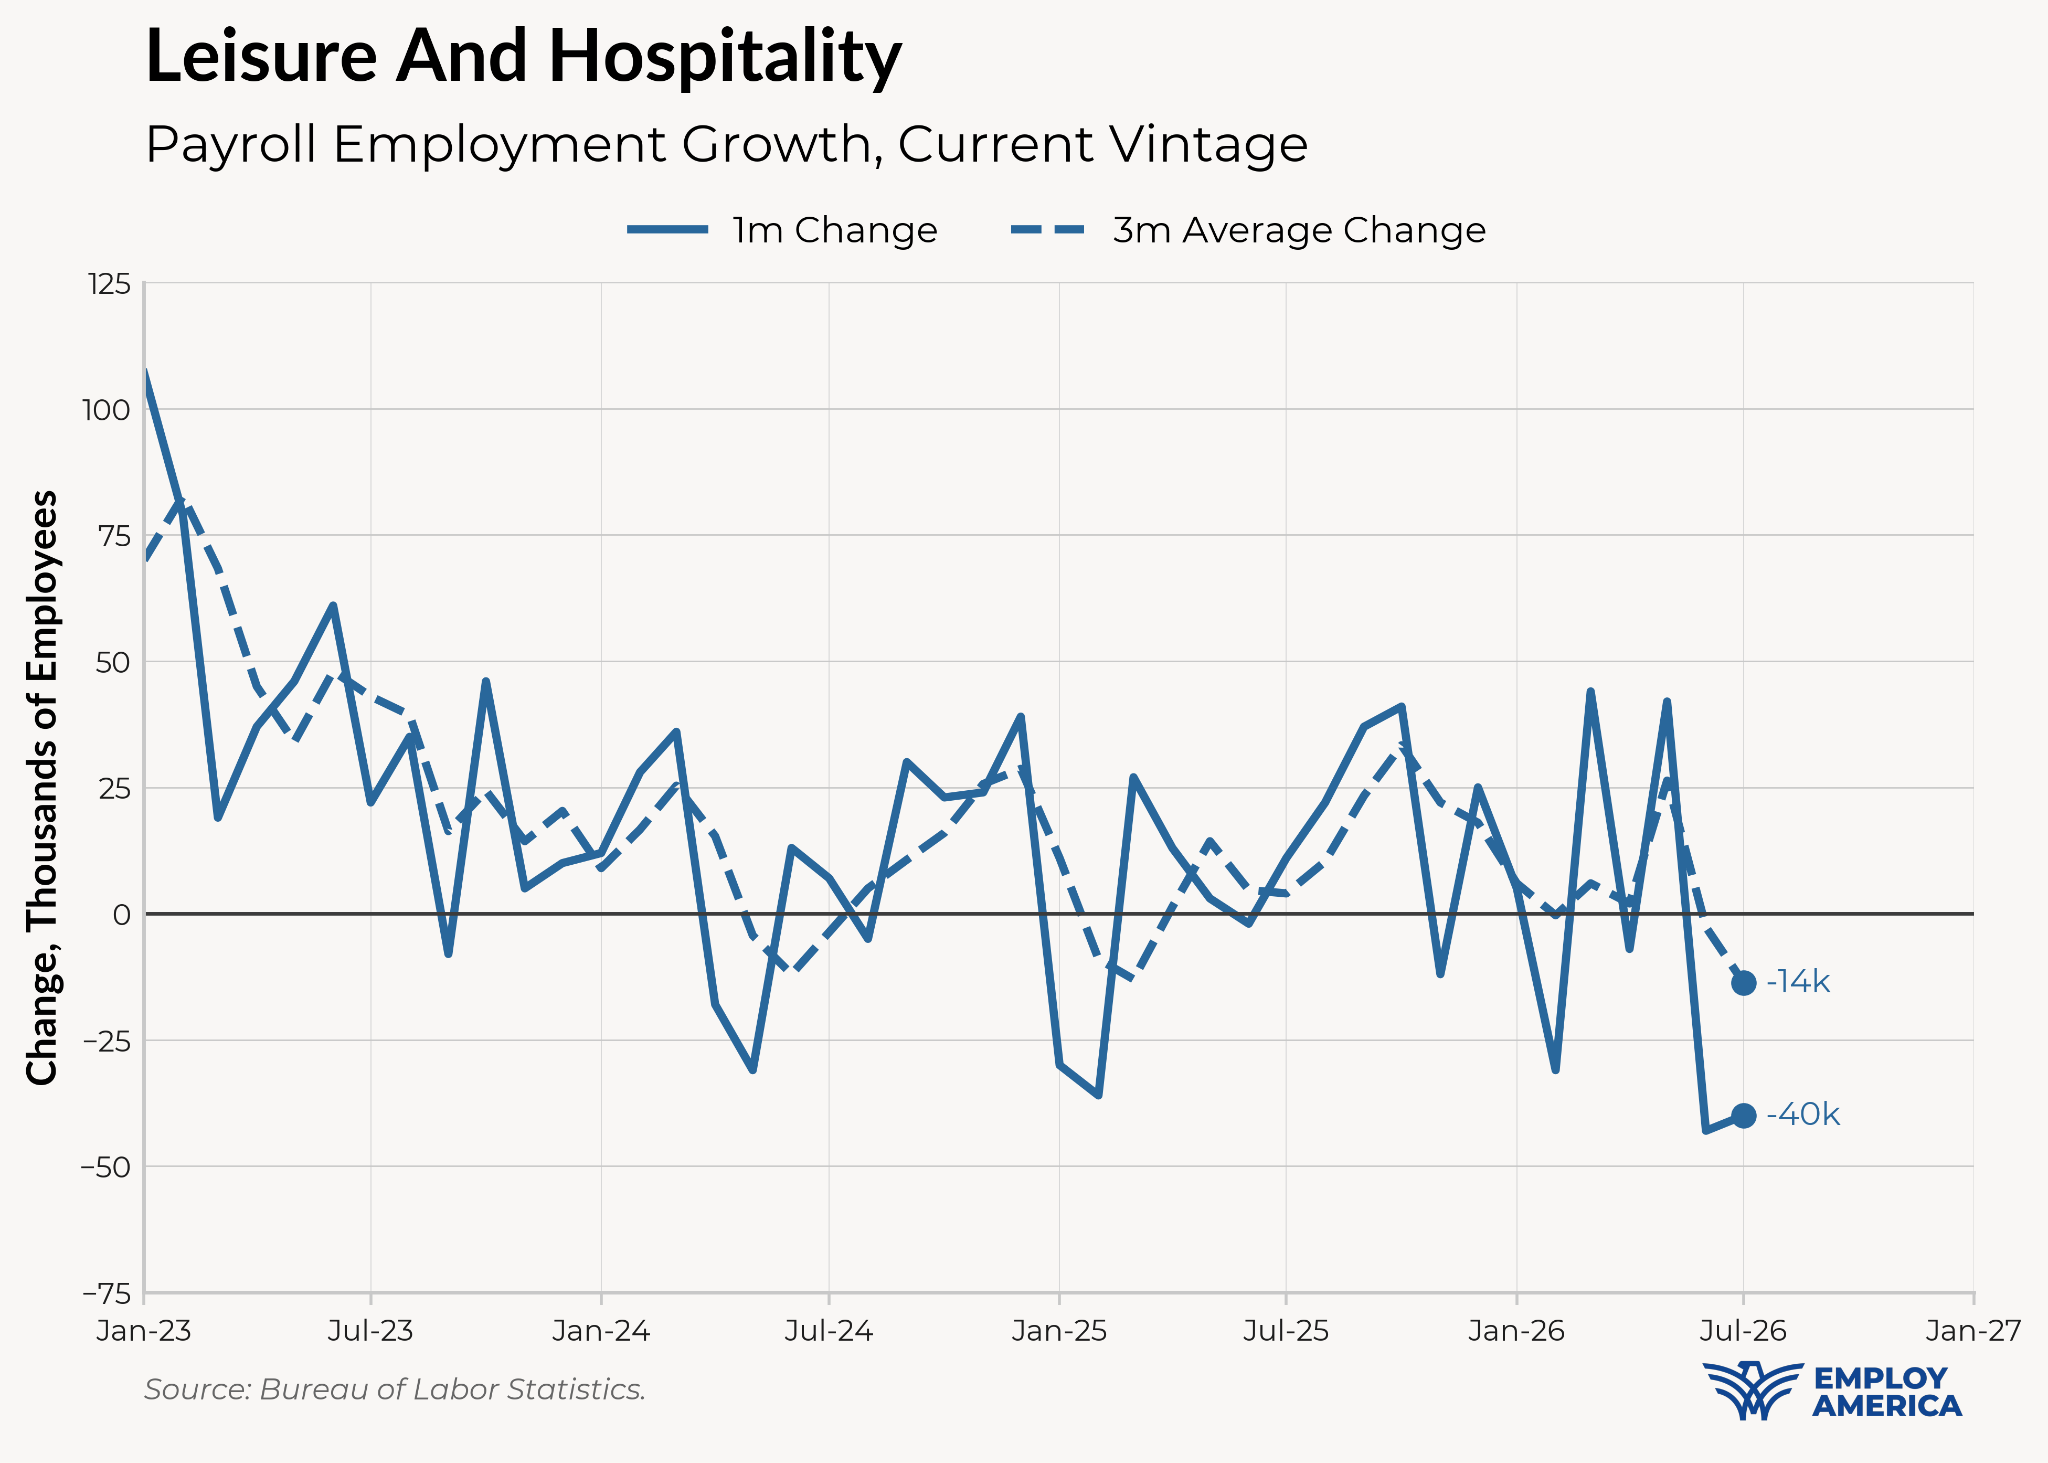
On the other hand, the household survey looks pretty good this month. The unemployment rate fell another 0.10pp to 4.10%. As a reminder, the Fed’s June Summary of Economic Projections put the unemployment rate at 4.3% to end the year. At 4.1%, the unemployment rate has completely retreated from its mini-surge in the second half of 2025—exactly the surge that prompted the Fed to implement “insurance cuts” in Q4.
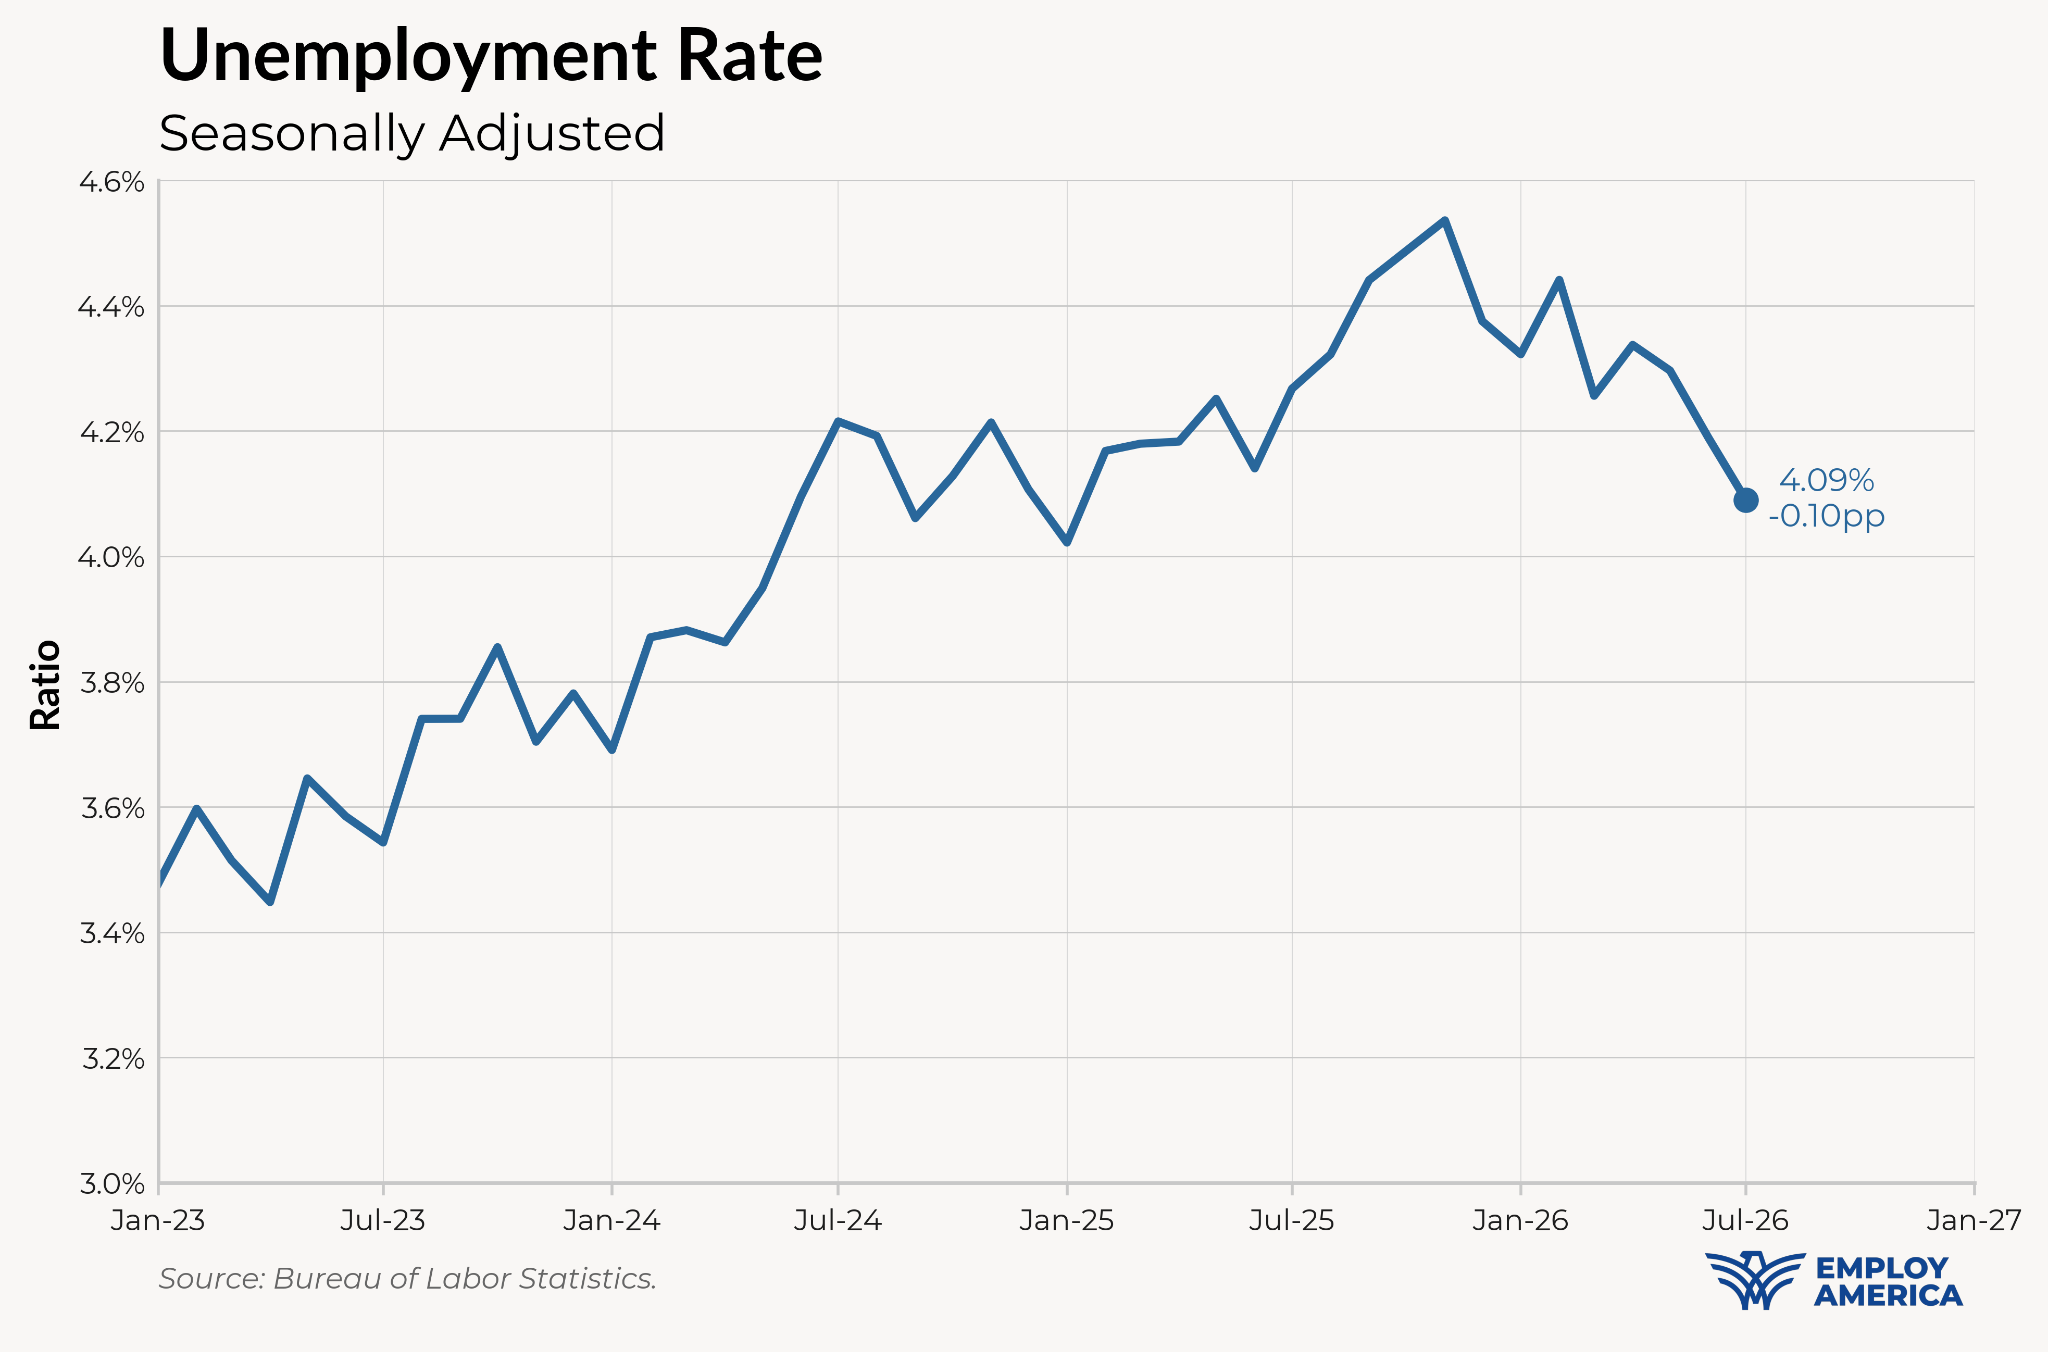
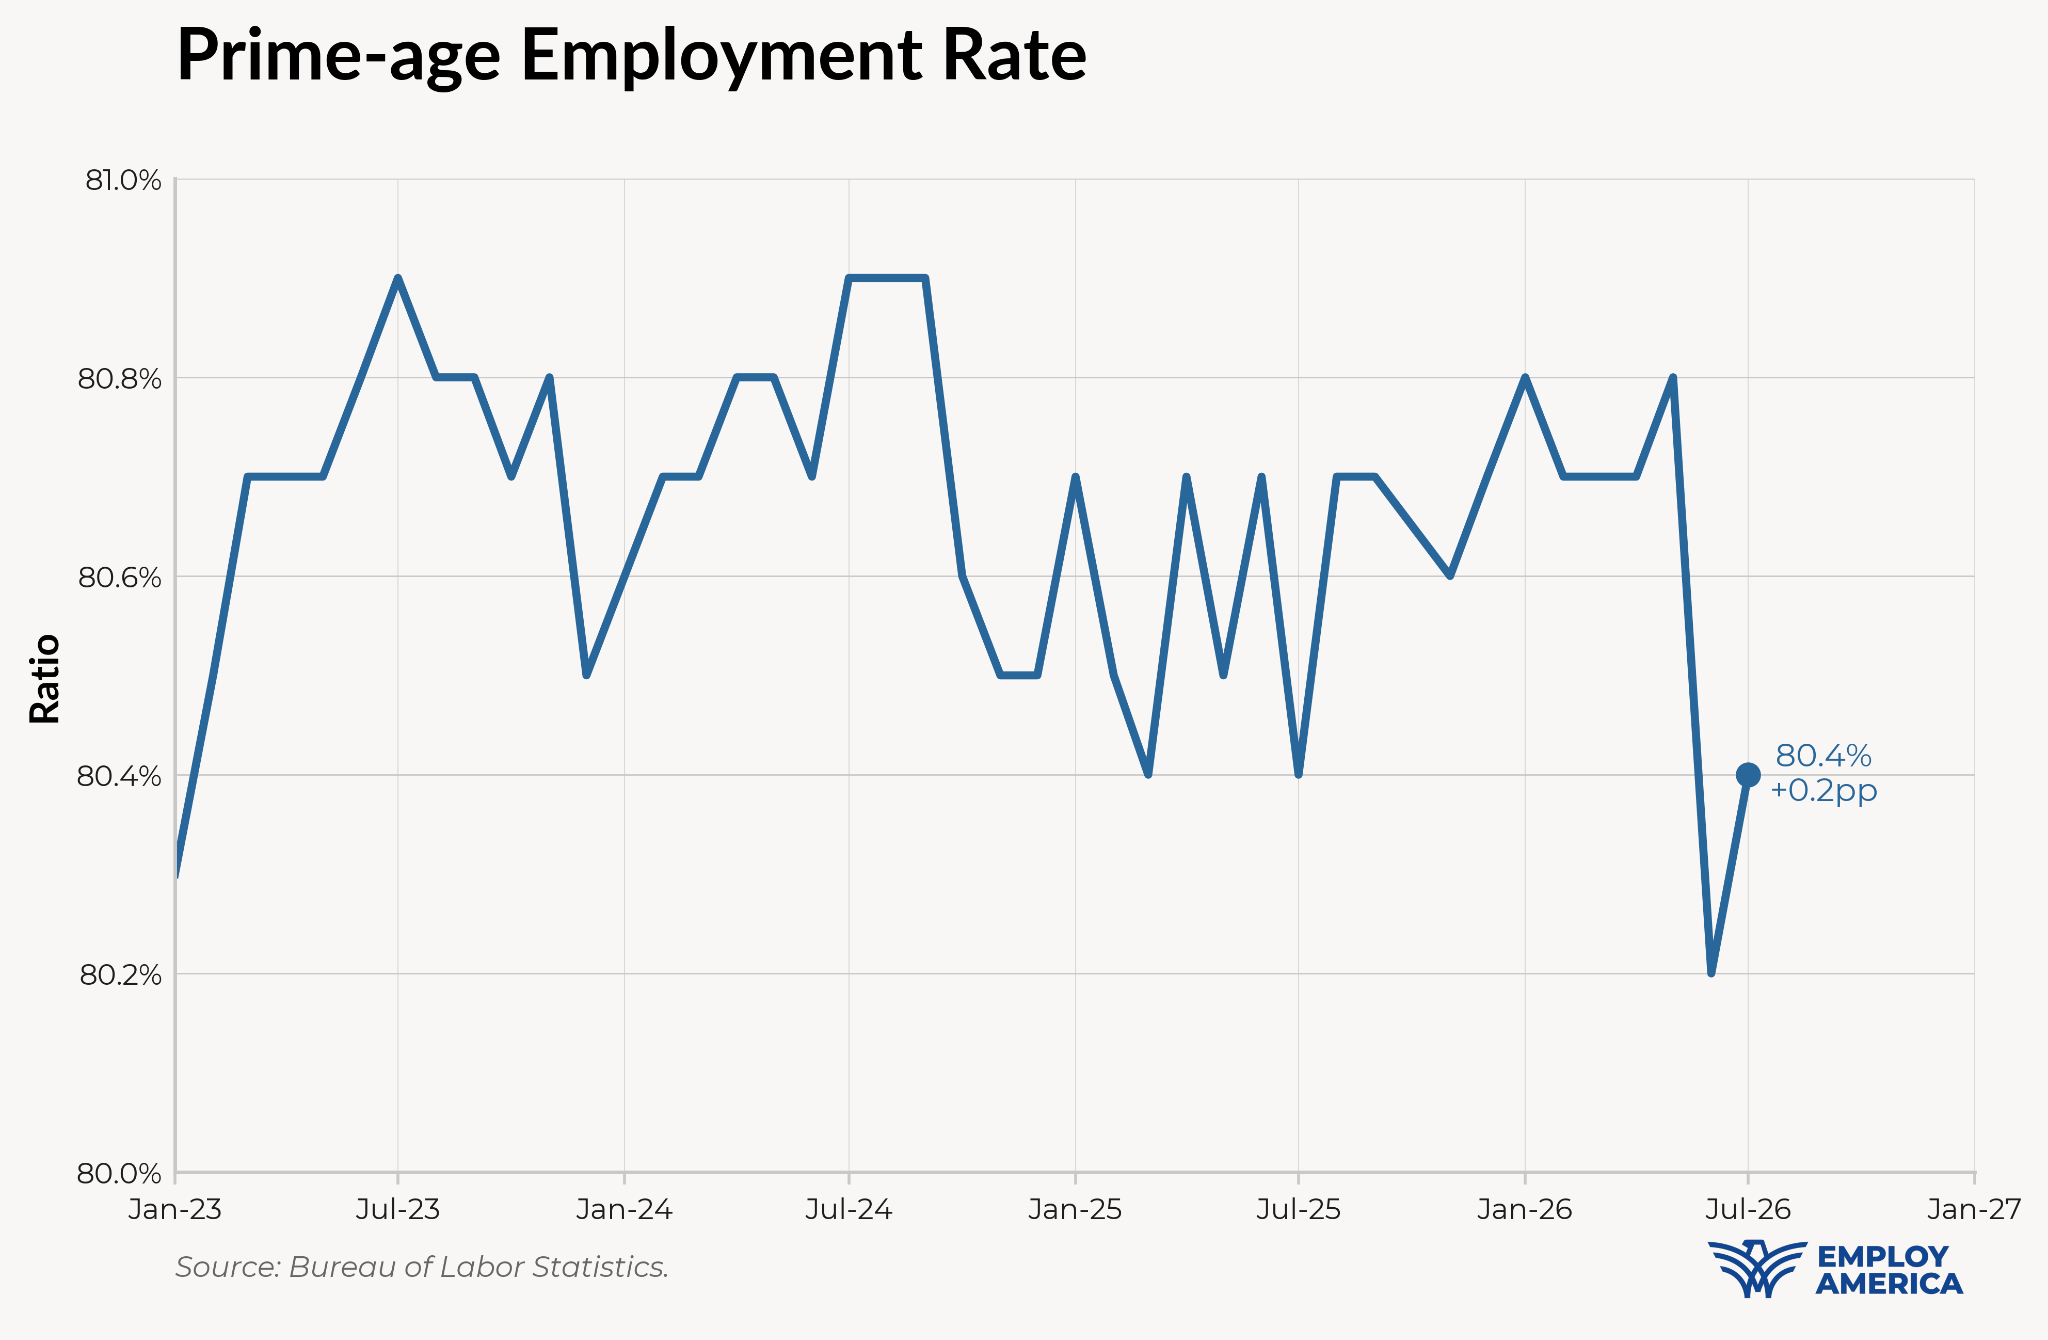
In aggregate, the unemployment rate fell for the “wrong reasons” since employment and participation rates have been falling over the past few months. That’s mostly an artifact of the aging of the population and weakening participation and employment amongst the elderly. Both prime-age employment and participation are up, and prime-age unemployment rates are down.
Another key reason why the unemployment rate is declining is that the “low-fire” part of “low-hire, low-fire” is really strong this month. The transition rate of employed persons to unemployment is the lowest it’s been in years.
Last month, we flagged an extreme drop in the prime-age employment rate. This month, the prime-age employment rate rebounded somewhat, but that drop still hasn’t reversed.
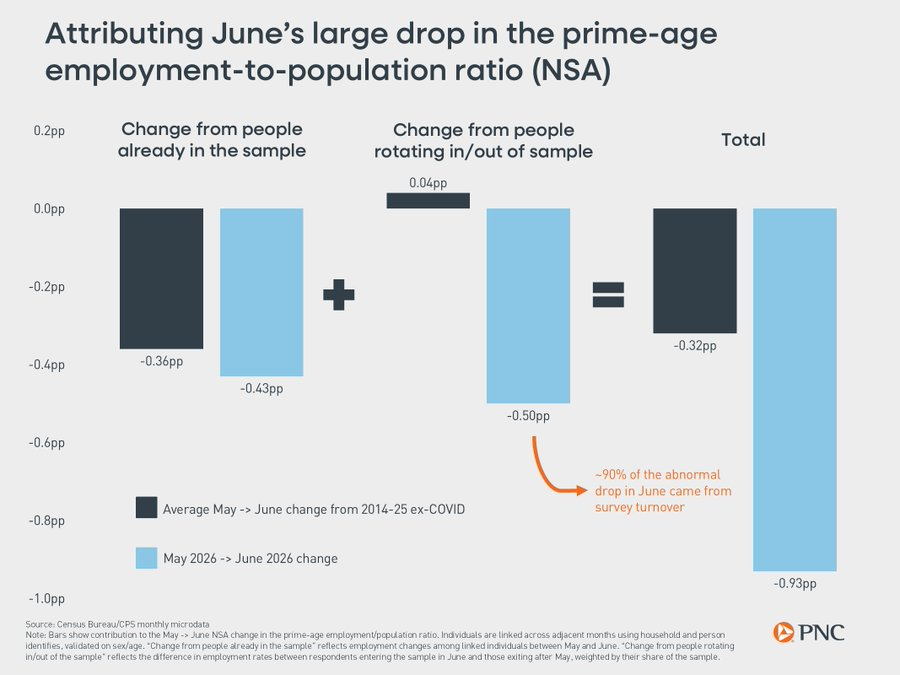
We still aren’t concerned about the prime-age employment drop. Now that the microdata is out, it looks like the drop in June is likely a statistical quirk related to the way that the Current Population Survey (CPS) is constructed. To reduce respondent burden, the CPS is a panel survey where households are in the survey for four months, out for eight, and back in for four. This means that in any given month, about a quarter of households leave the sample and are replenished by new or returning households.
In June, the change in the prime-age employment rate was almost all due to differences in the outgoing households versus the incoming households. It seems less likely that the prime-age employment drop is due to any underlying weakness in the labor market. Since last month’s incoming sample will still be here for the next couple months, we would not expect prime-age employment to recover until the October report.
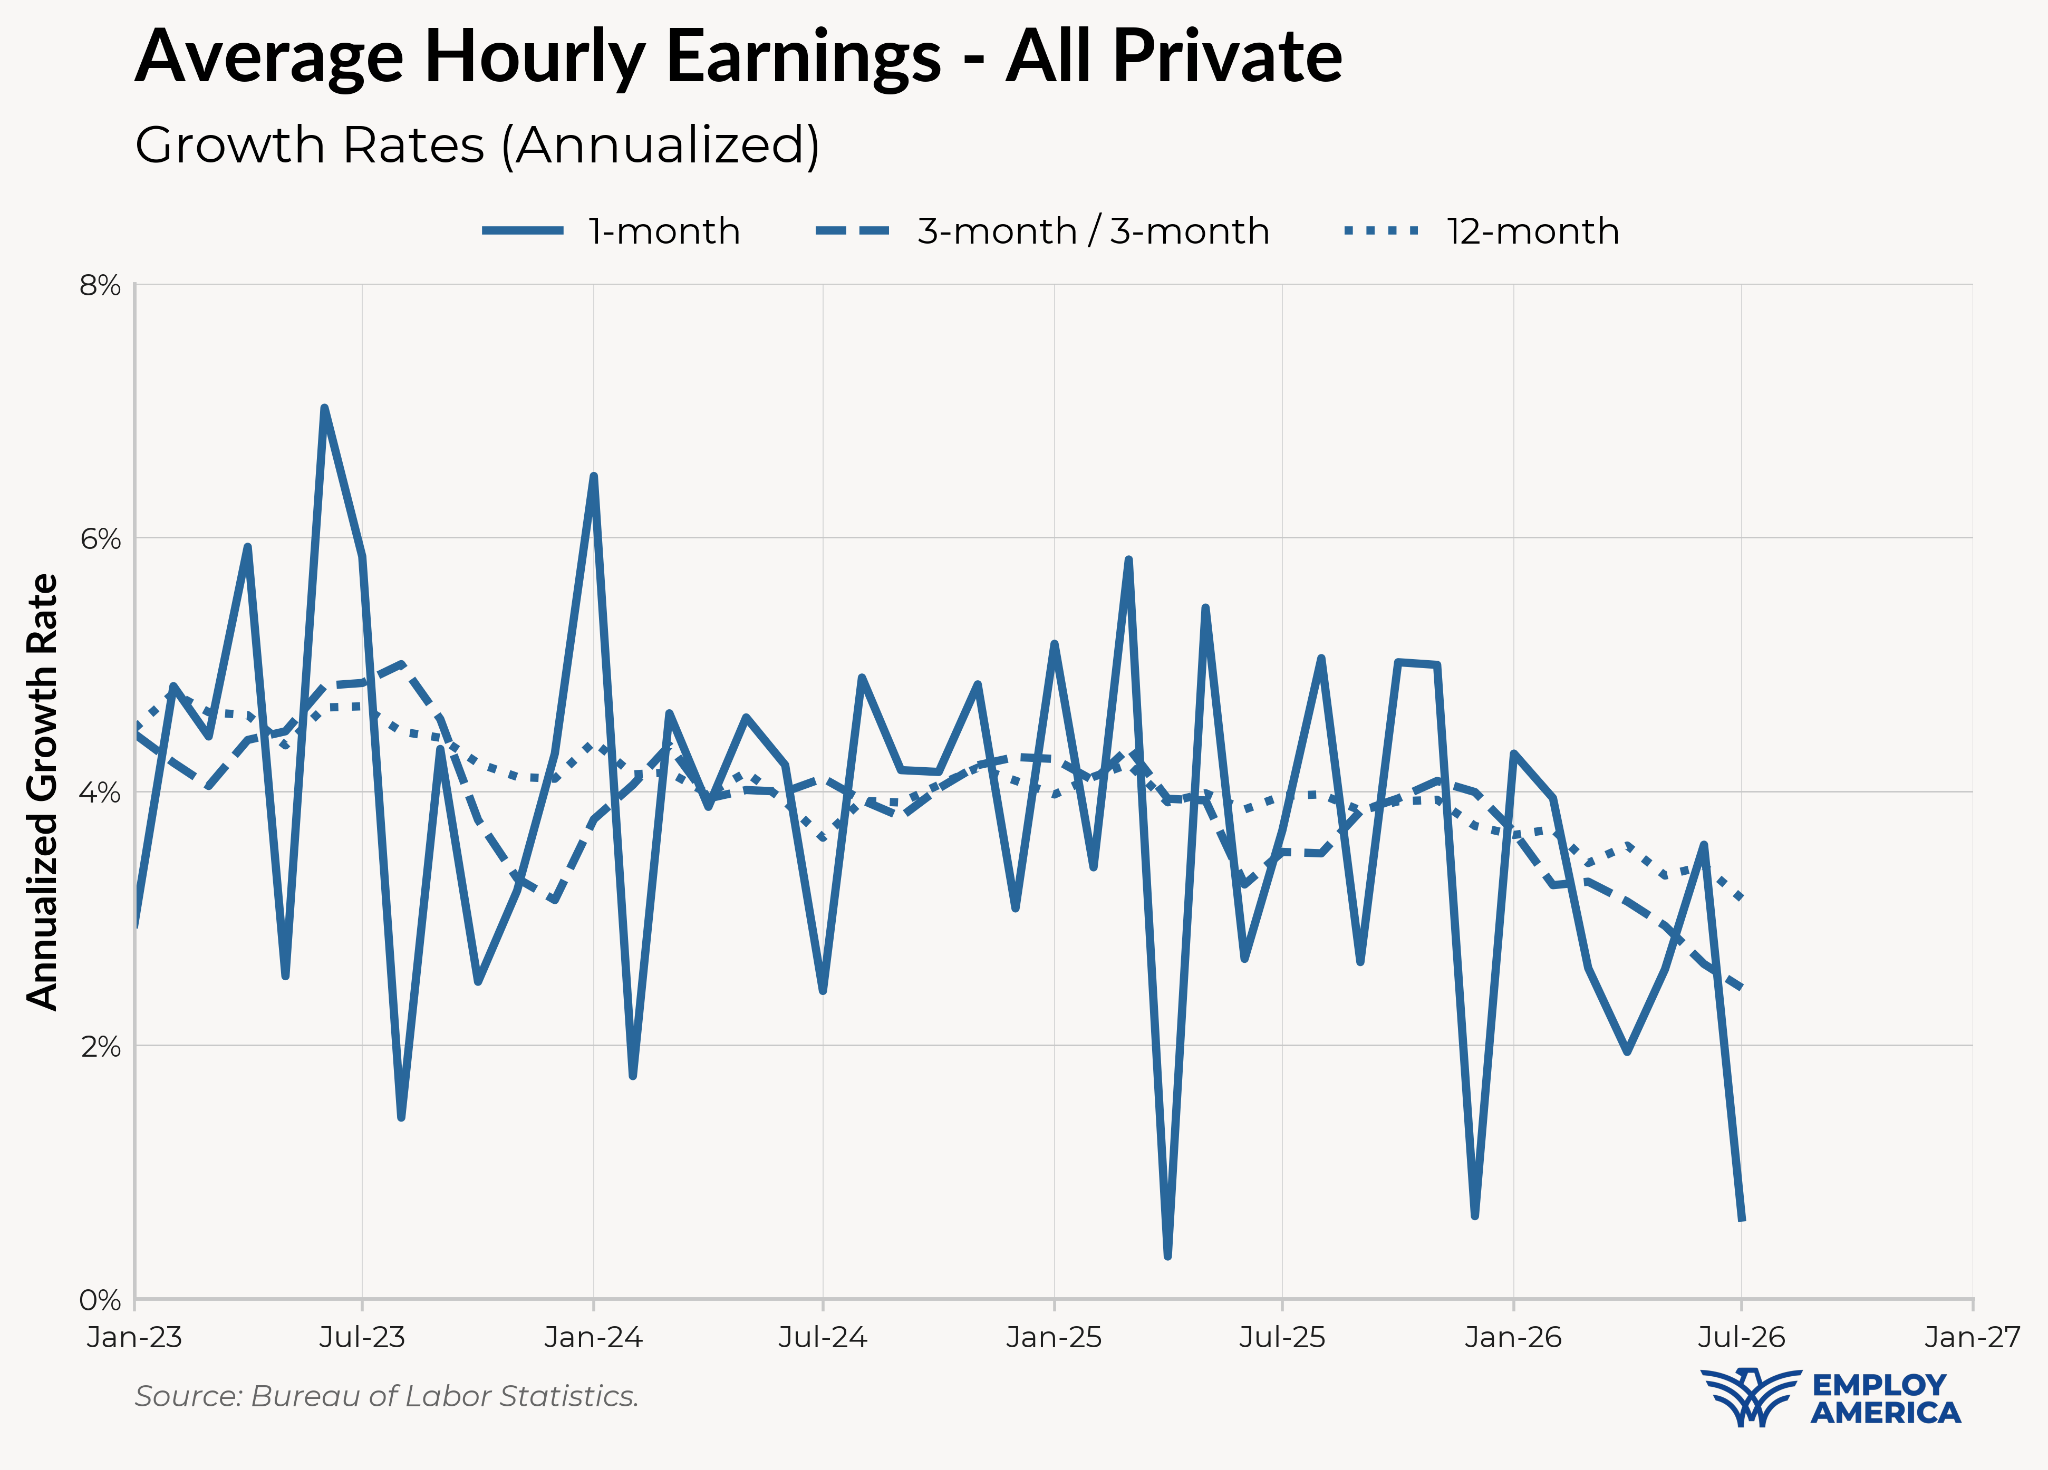
We saw pretty paltry wage growth in July, with average hourly earnings growing at just 0.6% annualized. Wage growth exhibits sharp swings from month to month, and we’ve previously seen months with similar readings that rebounded quickly. However, if one looks at the longer-run trend, wage growth is dropping relatively quickly. 12-month wage growth is just 3.15%, under 2019 averages, and 3-month / 3-month annualized wage growth is just 2.5%.
The negative payrolls number may look scary, but we don’t think it’s likely, on its own, to deter the Fed from raising rates on. If you listen to the core of the Committee, they are confident that the labor market is steady enough that they can turn their eye towards inflation. Is the negative payrolls print today enough to shake that confidence? We don’t think so, when you combine it with the fact that the unemployment rate fell and that Fed officials are open to the idea of breakeven payrolls growth being near-zero.
What the recent labor market does show is that unlike previous years, it’s hard to point to the labor market as a source of inflation. But we’ve already heard many Fed officials, including the hawkish ones, say this; it’s baked into the Fed outlook already. In fact, the Fed seems almost indifferent to the causes of inflation at this point; it’s simply the case that inflation has gone on for too long. Perhaps if they’d adopted a framework sensitive to supply-driven inflation, they’d be able to better navigate this moment.