Feb Core-Cast Post-PCE: Marginally Softer Than Our Nowcast & Shores Up Prospects For A June Rate Cut

Core-Cast is our nowcasting model to track the Fed's preferred inflation gauges before and through their release date. The heatmaps below give a comprehensive view of how inflation components and themes are performing relative to what transpires when inflation is running at 2%.
Most of the Personal Consumption Expenditures (PCE) inflation gauges are sourced from Consumer Price Index (CPI) data, but Producer Price Index (PPI) input data is of increasing relevance, import price index (IPI) data can prove occasionally relevant. There are also some high-leverage components that only come out on the day of the PCE release.
If you'd like to start a 90-day free trial of our exclusive content, you can do so using this link. If you have any questions or would like to see samples of our past content, feel free to get in touch with us.
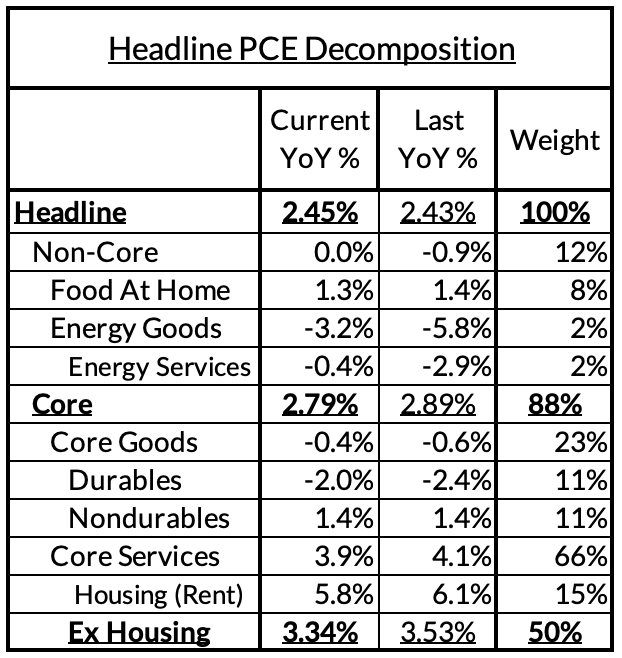
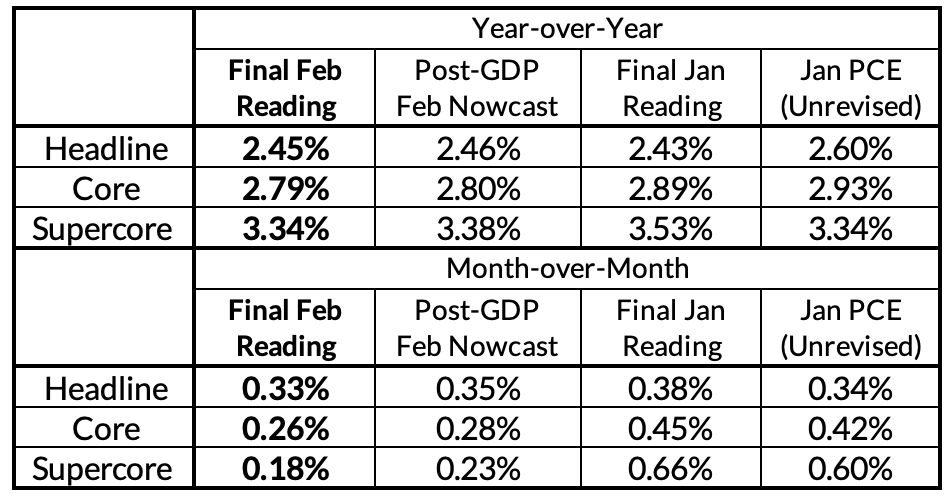
Core PCE came in marginally softer than our final nowcast yesterday, with year-over-year Core PCE now running at 2.79% and the monthly Core PCE reading was 26 basis points (2 basis points lighter than our nowcast but with offsetting upward revisions for January).
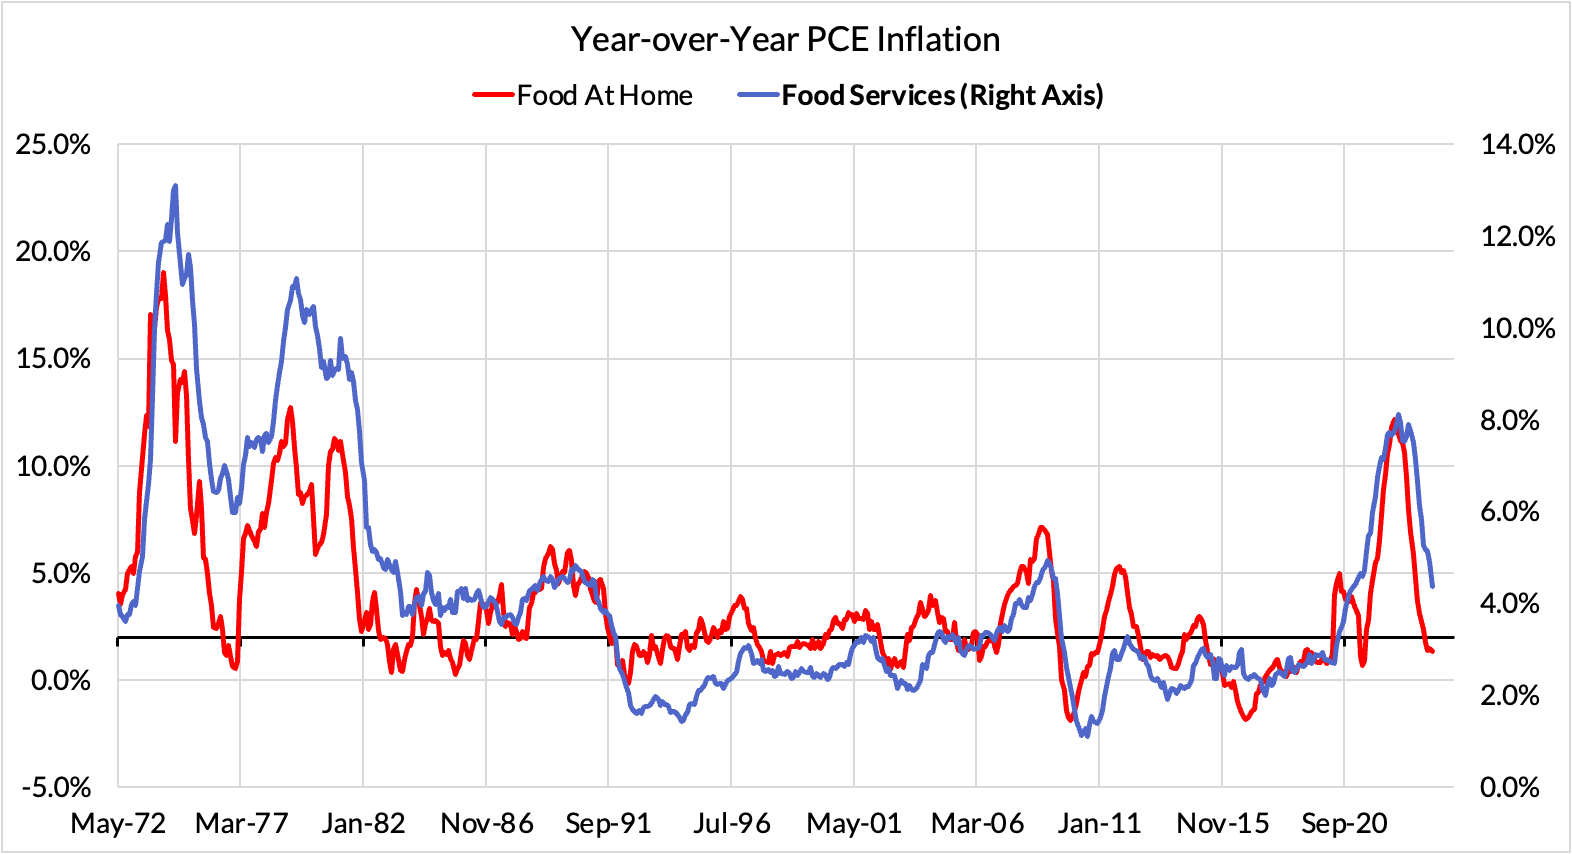
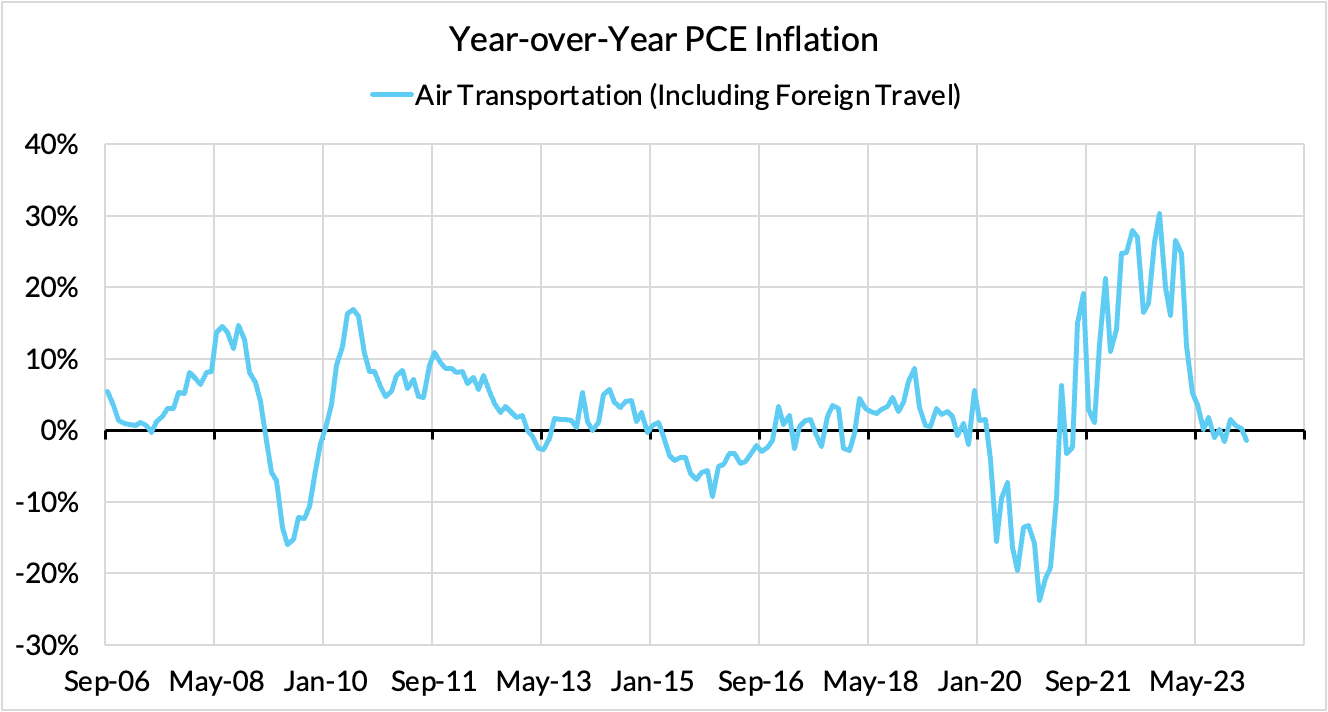
We are not the biggest fans of "supercore" as an inflation concept (or at least would warn that it is not tethered to the labor market as the Fed and others have posited). Nevertheless, supercore inflation came in meaningfully softer in February, running at a monthly pace that is otherwise consistent with below-target inflation. Some dovish Fed officials may take heart in this development, which was driven by surprisingly slower airfares, food services, legal services, and imputed financial services. Energy and food price stabilization have likely helped airfare and food service pricing, while the growing convergence between deposit rates and the Fed Funds Rate in recent quarters have helped imputed financial service pricing.
We see today's information as cementing our current baseline for the Fed to begin reducing interest rates at the June FOMC meeting. It would take especially soft March inflation data plus downside inflation revisions to put the May FOMC meeting in play; the most realistically dovish outcome of the May FOMC meeting would be a "tee-up" of a June interest rate reduction. Risks are more firmly tilted to delaying the timeline for interest rate normalization and will be shaped by inflation developments in the coming months.
The inflation outlook should materially improve from here. January and February are plagued by residual seasonality issues tied to "new year, new prices" because most price changes in the CPI are based on bimonthly surveying processes. While March may still have a slight whisper of residual seasonality upside, it should be meaningfully lower than what's transpired over the past two months (35-36bps/month). Ideally for the Fed to cut in June, Core PCE is printing rounded 0.2%/month readings from here.
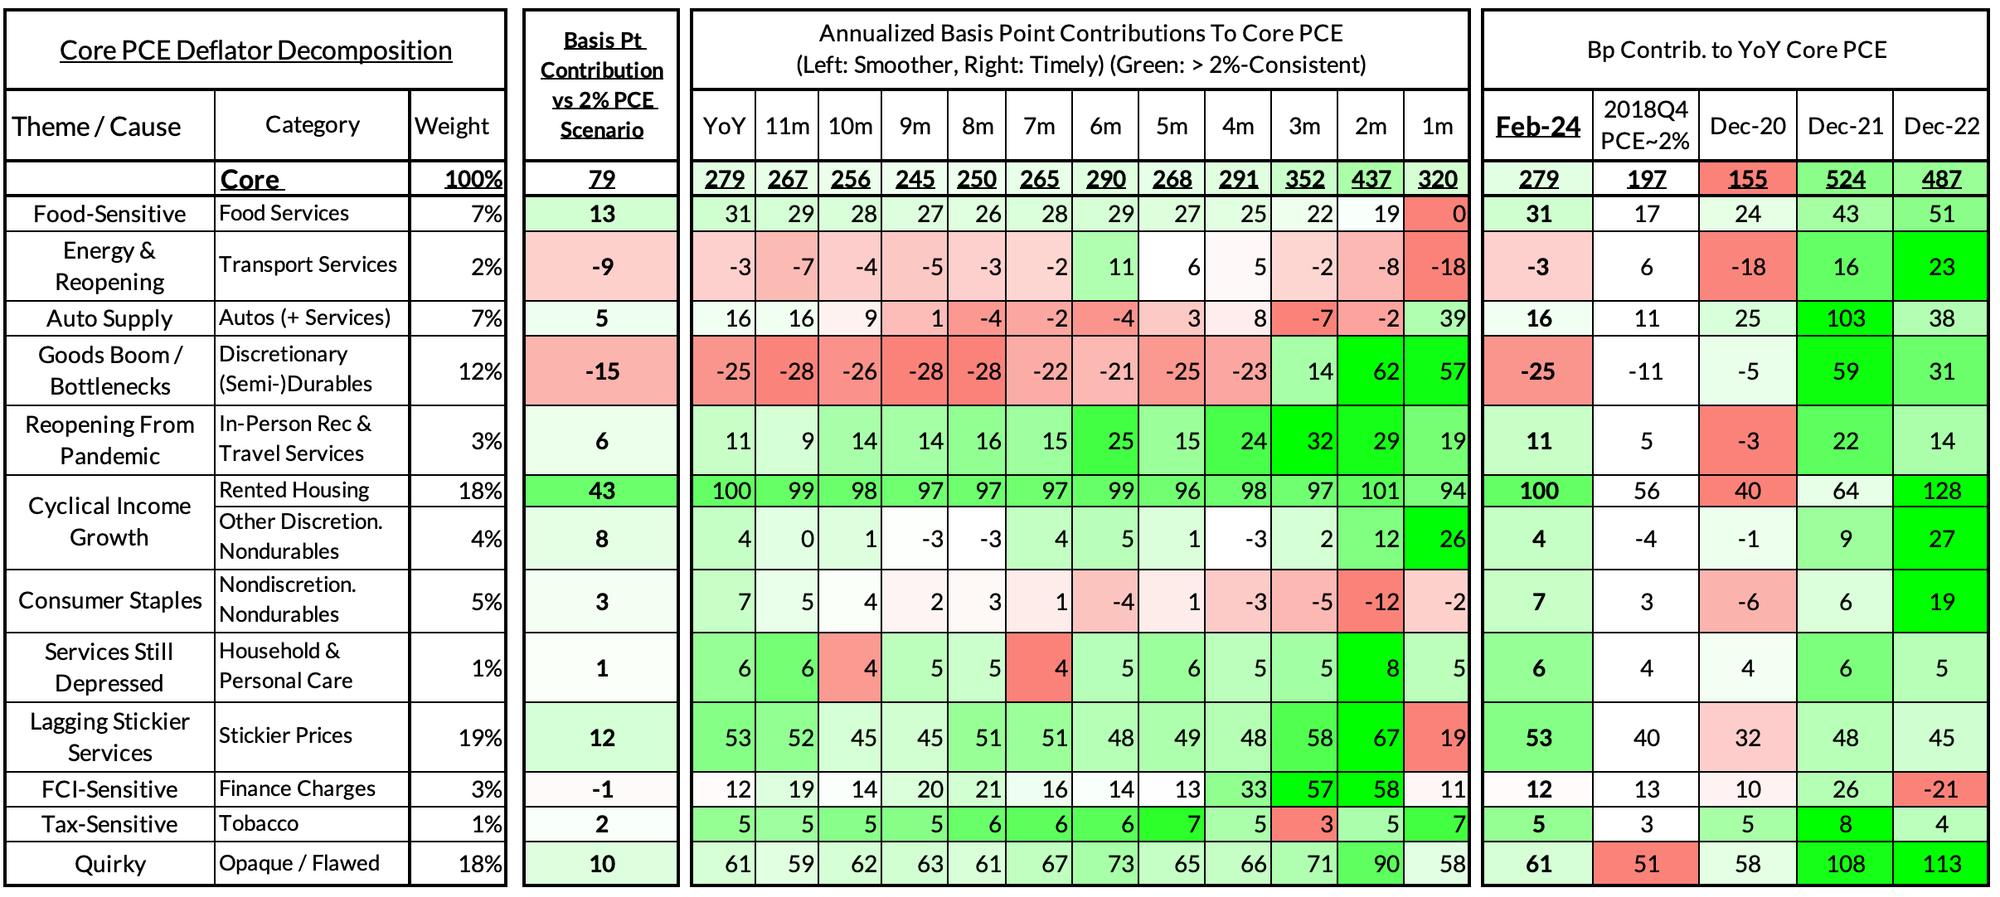
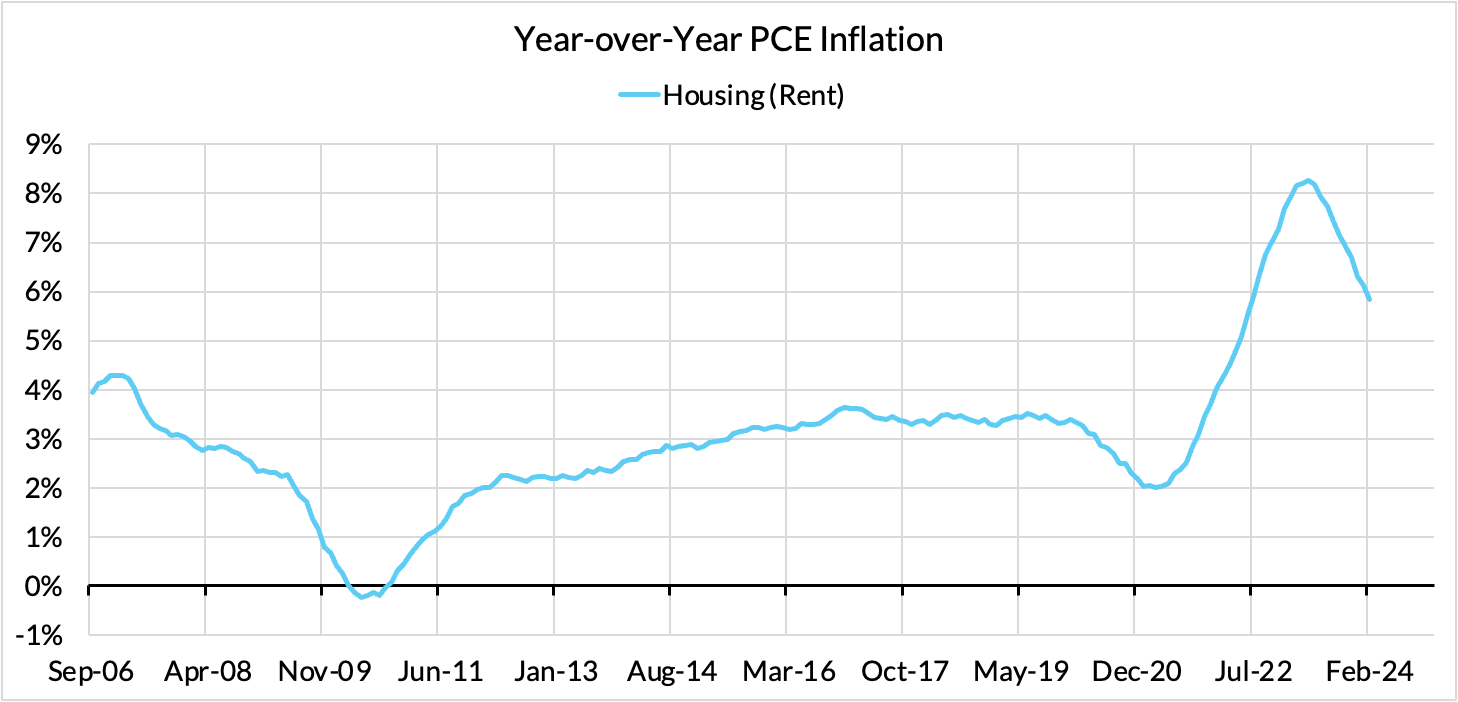
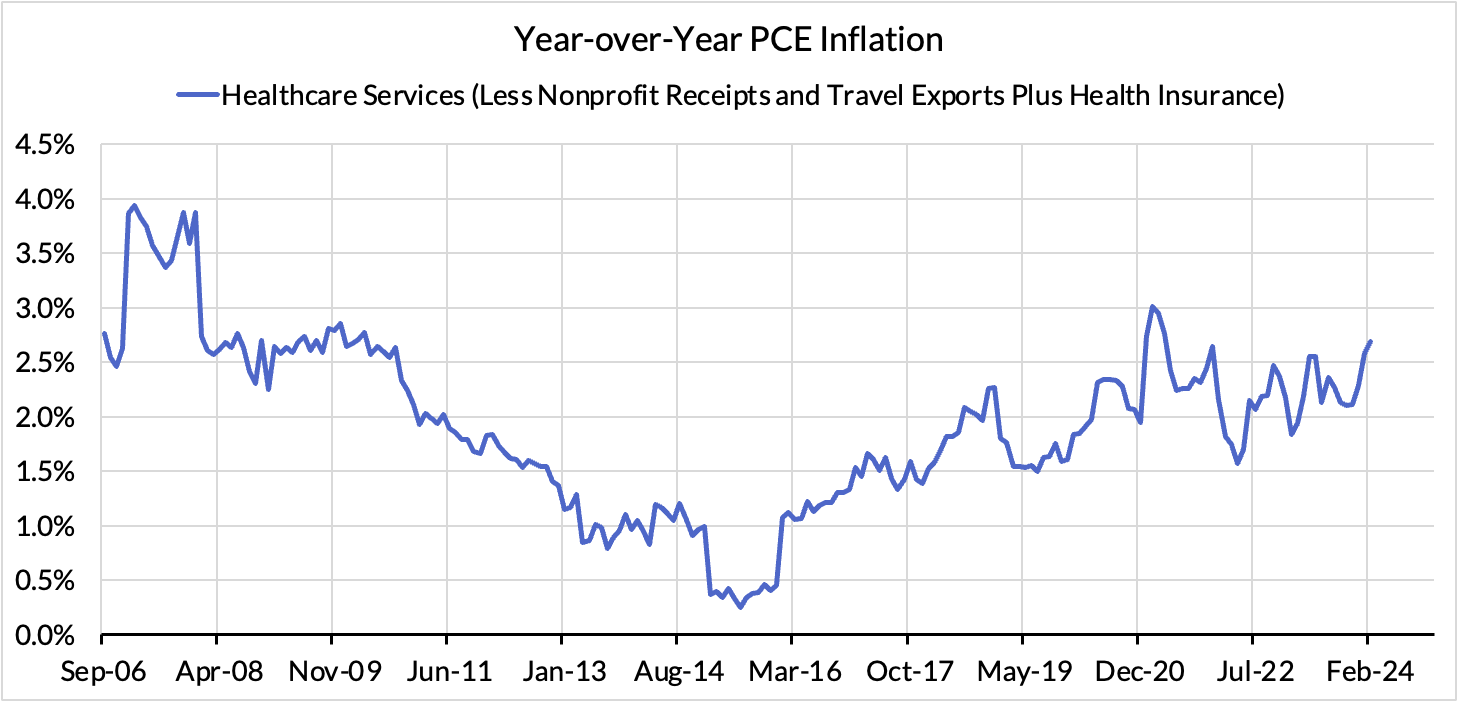
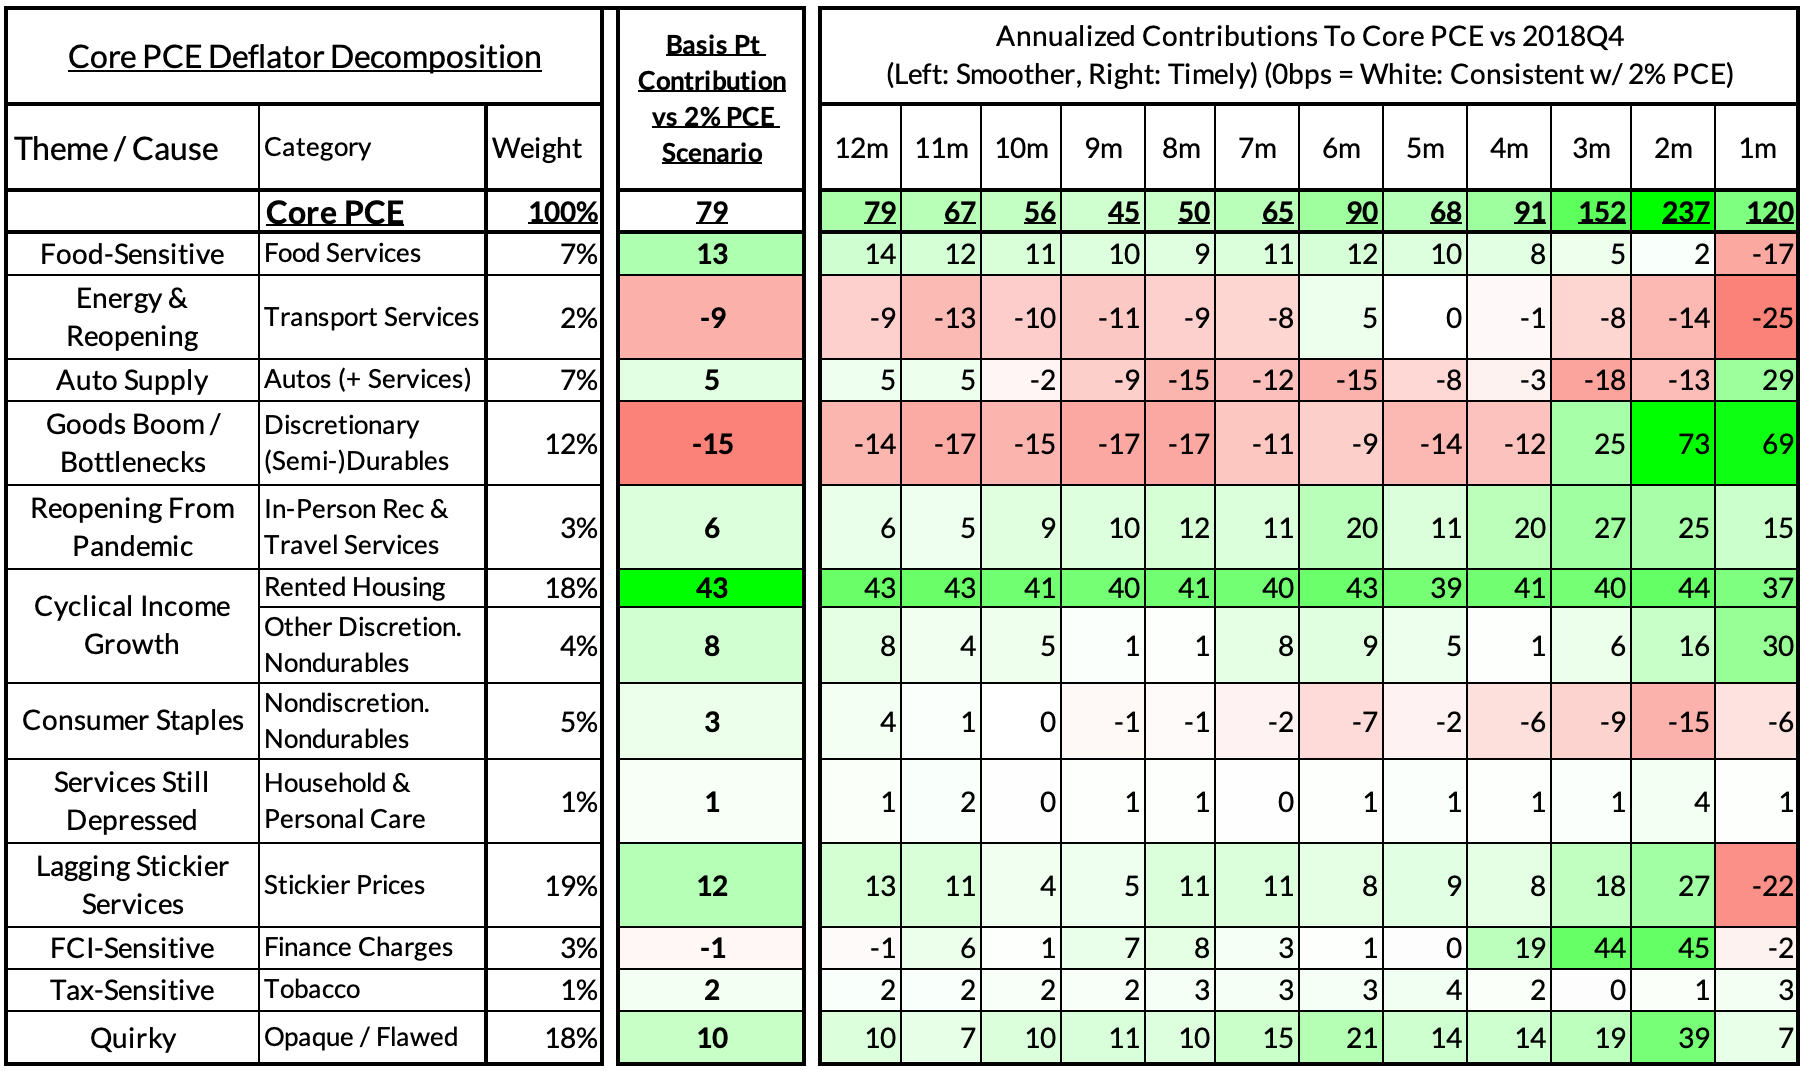
Core PCE (PCE less food products and energy) ran at a 2.79% year-over-year pace as of February, 79 basis points above the Fed's 2% inflation target for PCE. That overshoot is disproportionately driven by catch-up rent CPI inflation in response to the surge in household formation (a byproduct of rapidly recovering job growth) and market rents in 2021-22. Rent is contributing 43 basis points to the 79 basis point core PCE overshoot.
There are other contributors to the overshoot:
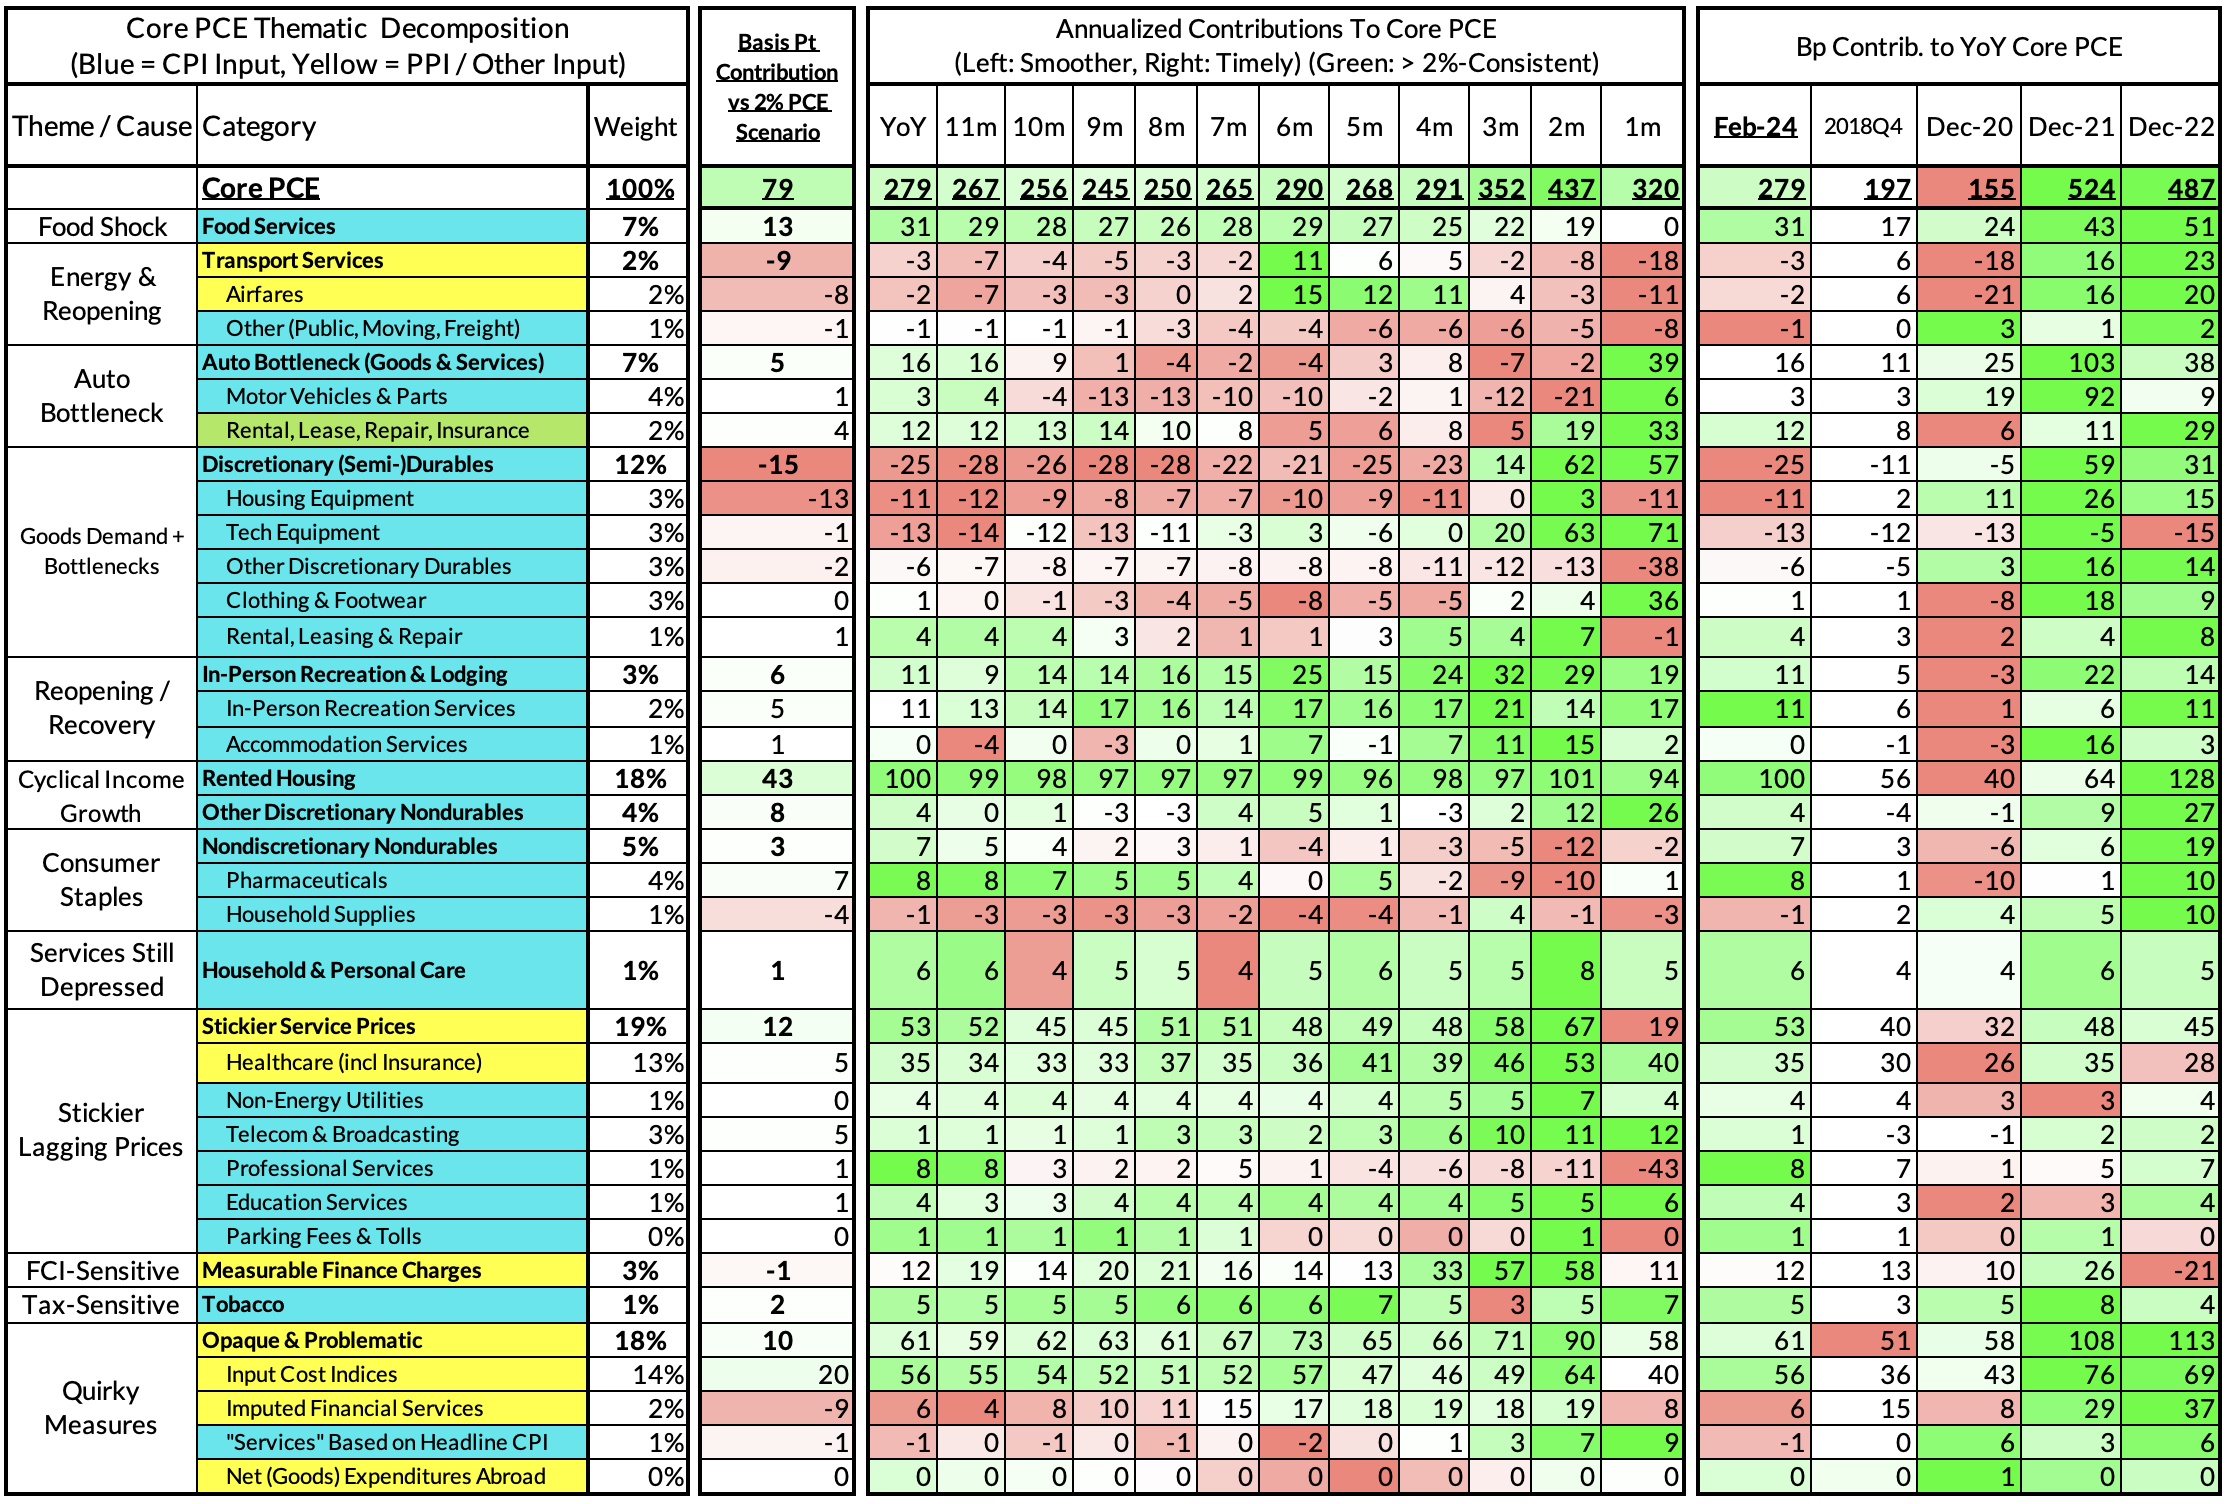
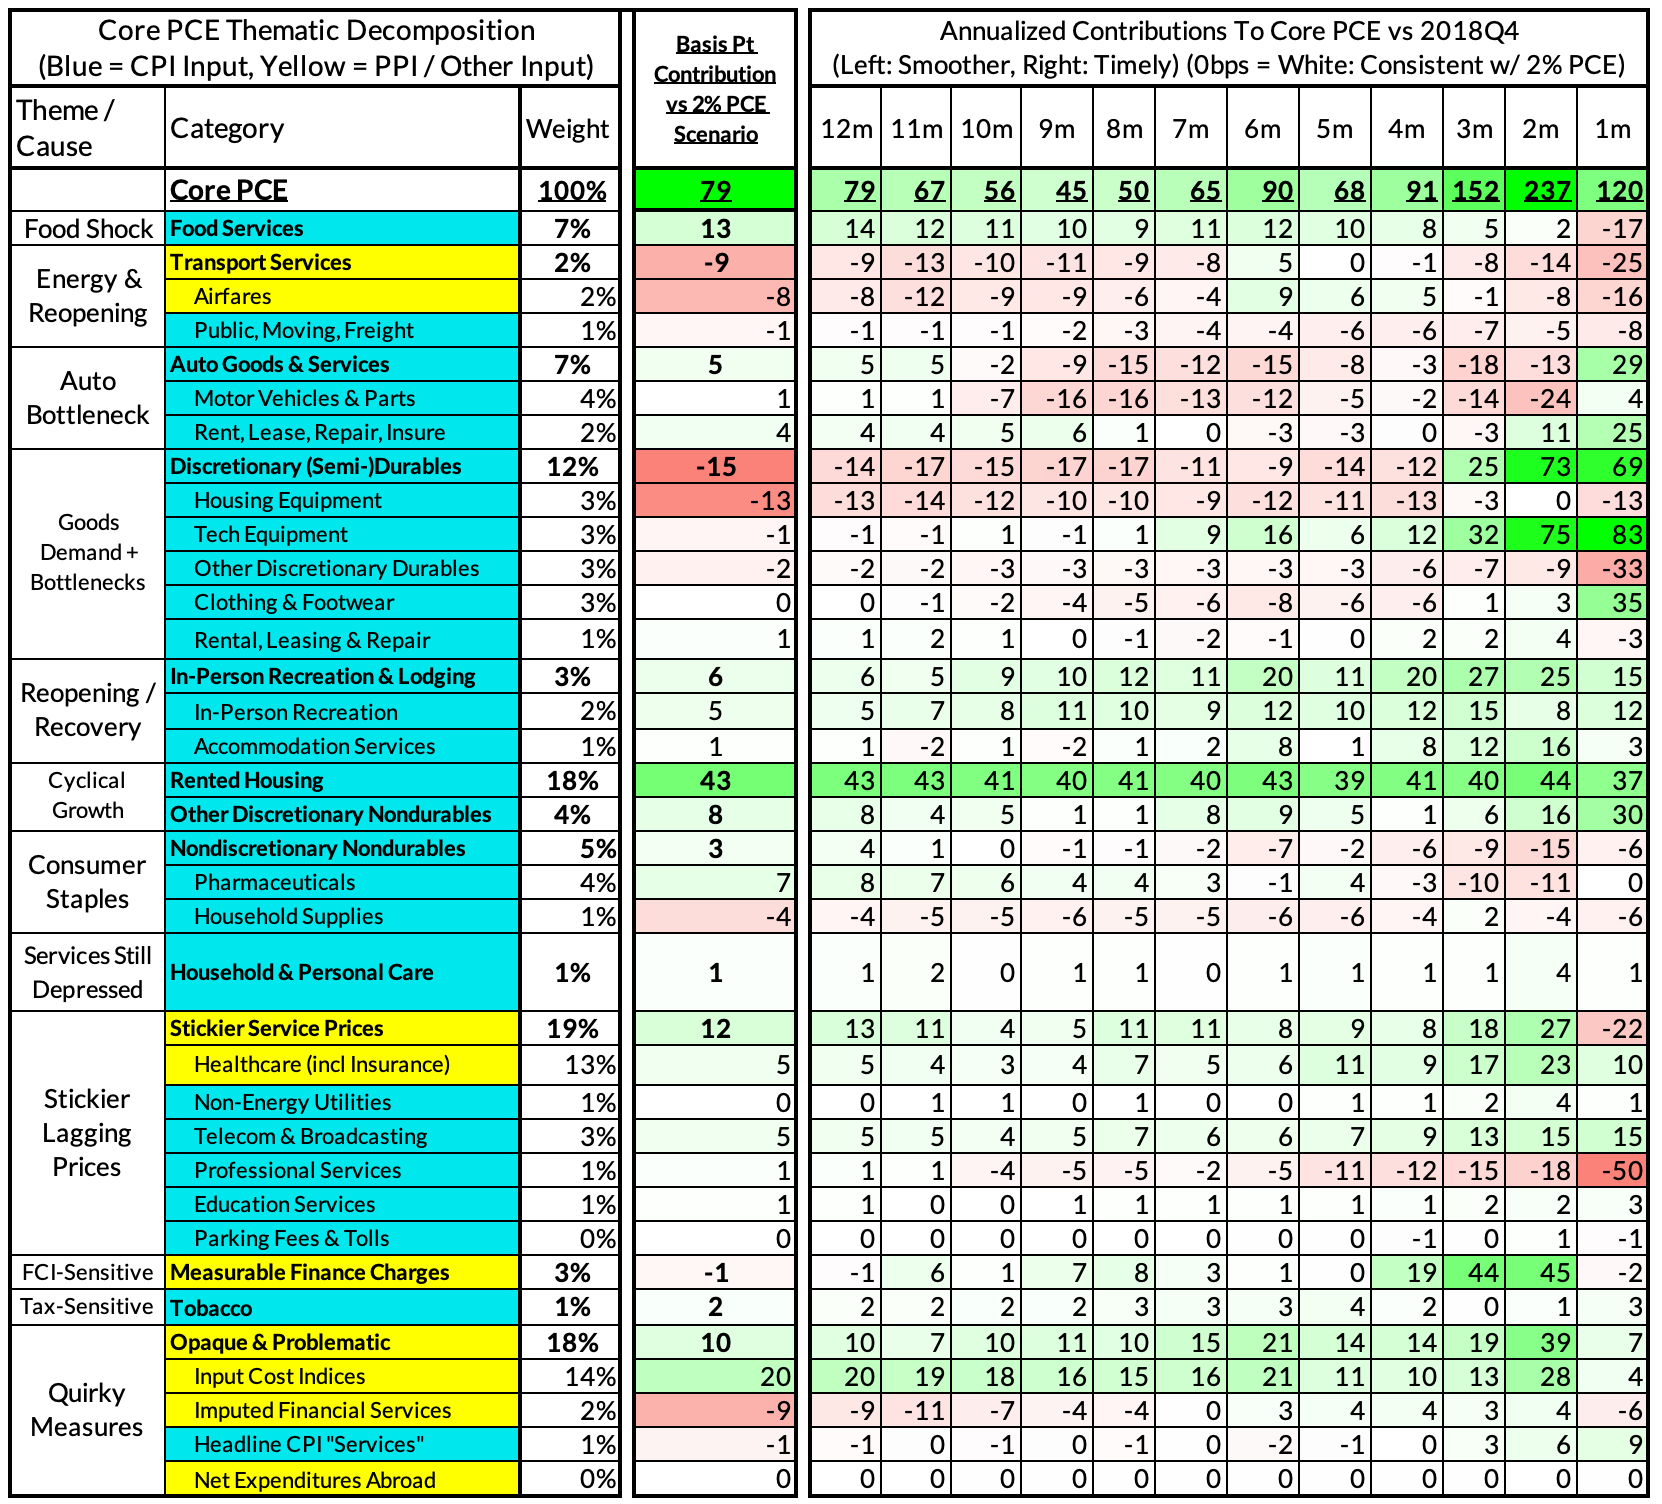
The subsequent heatmap below gives you a sense of the overshoot on shorter annualized run-rates. February monthly annualized core PCE yielded a 120 basis point overshoot vs 2% target inflation (3.20% annualized).
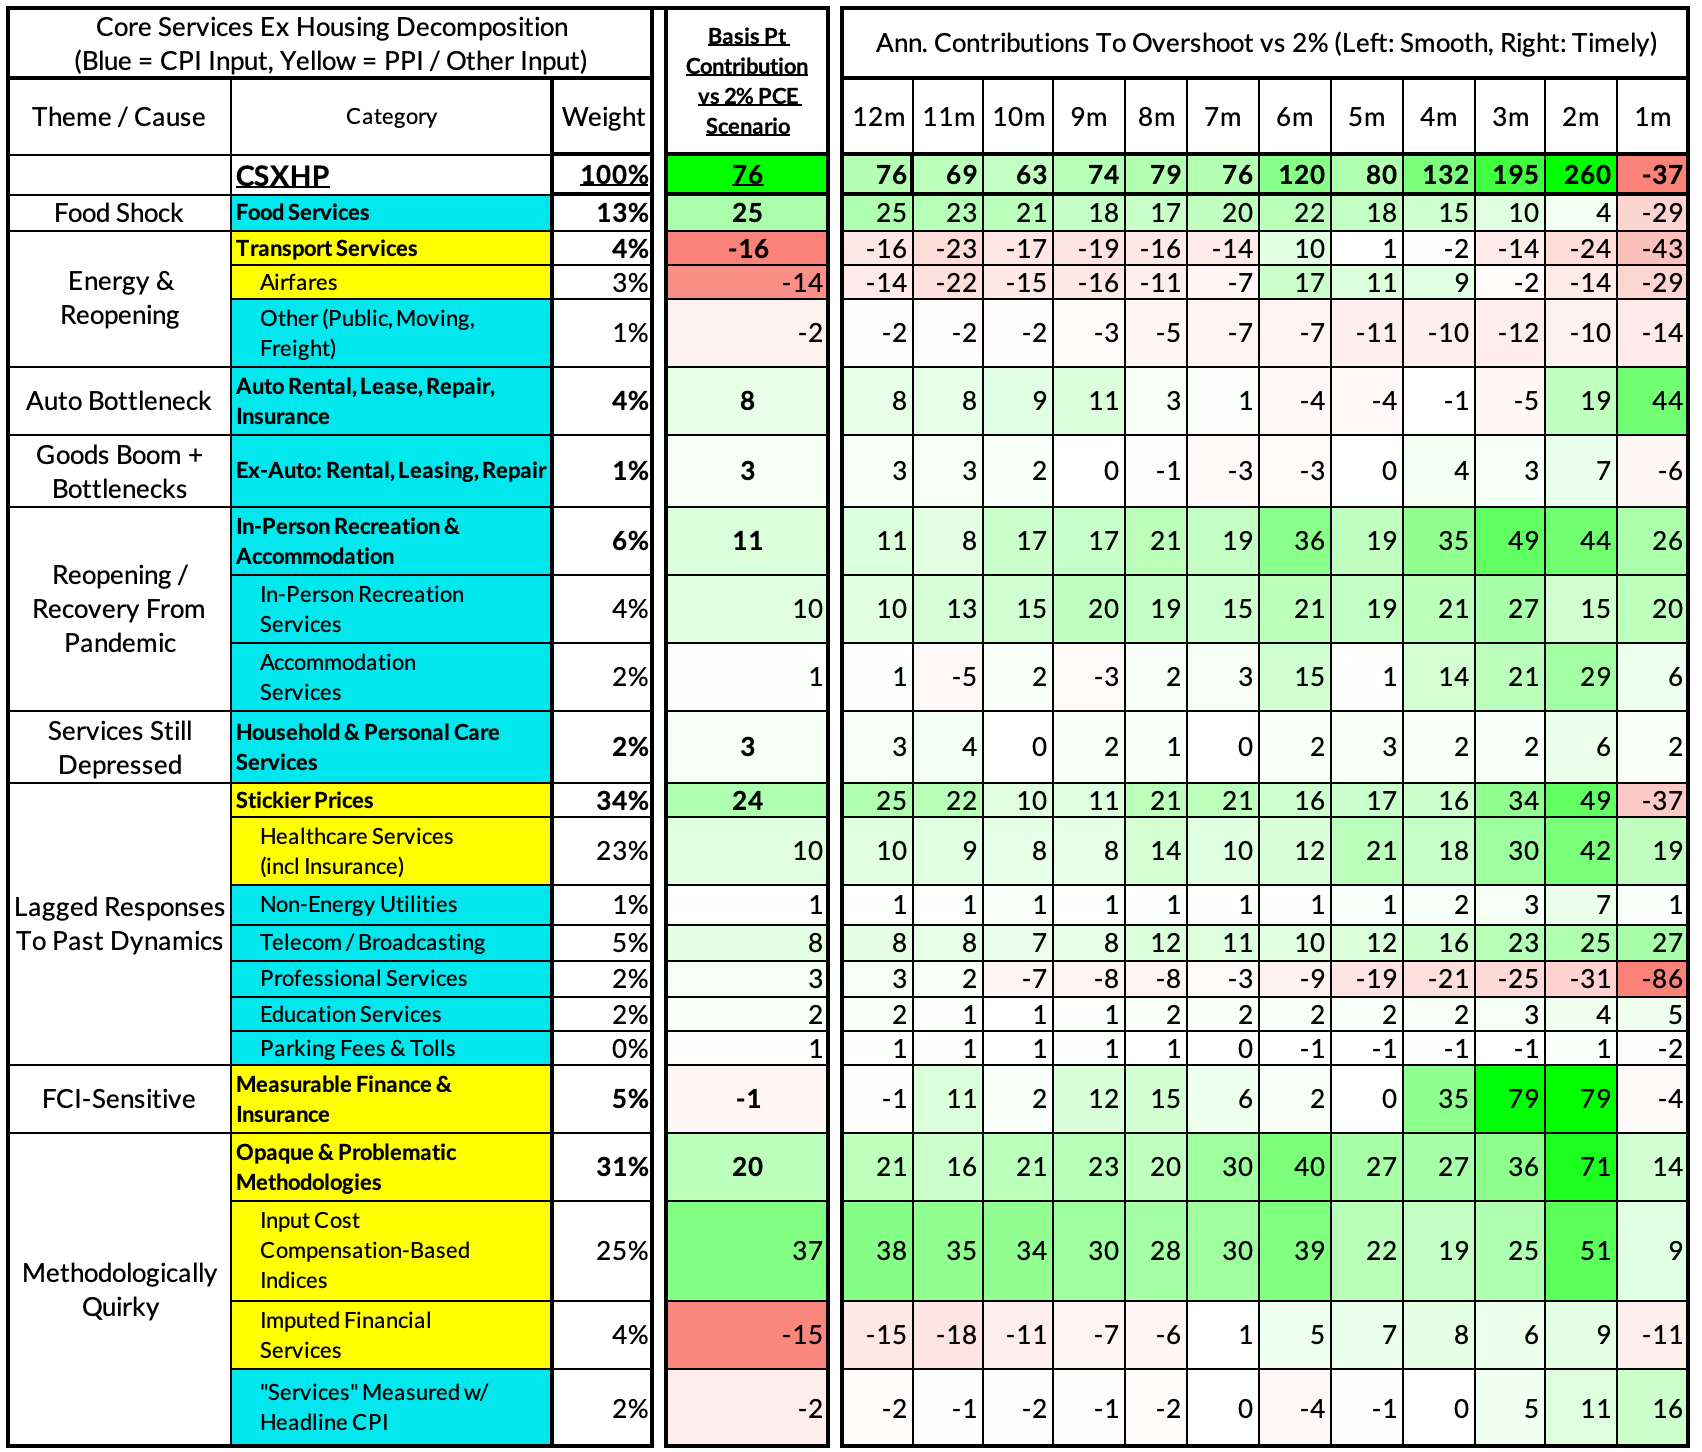
The February growth rate in "Core Services Ex Housing" ('supercore') PCE ran at a 3.34% year-over-year, a 76 basis point overshoot versus the ~2.59% run rate that coincided with ~2% headline and core PCE.
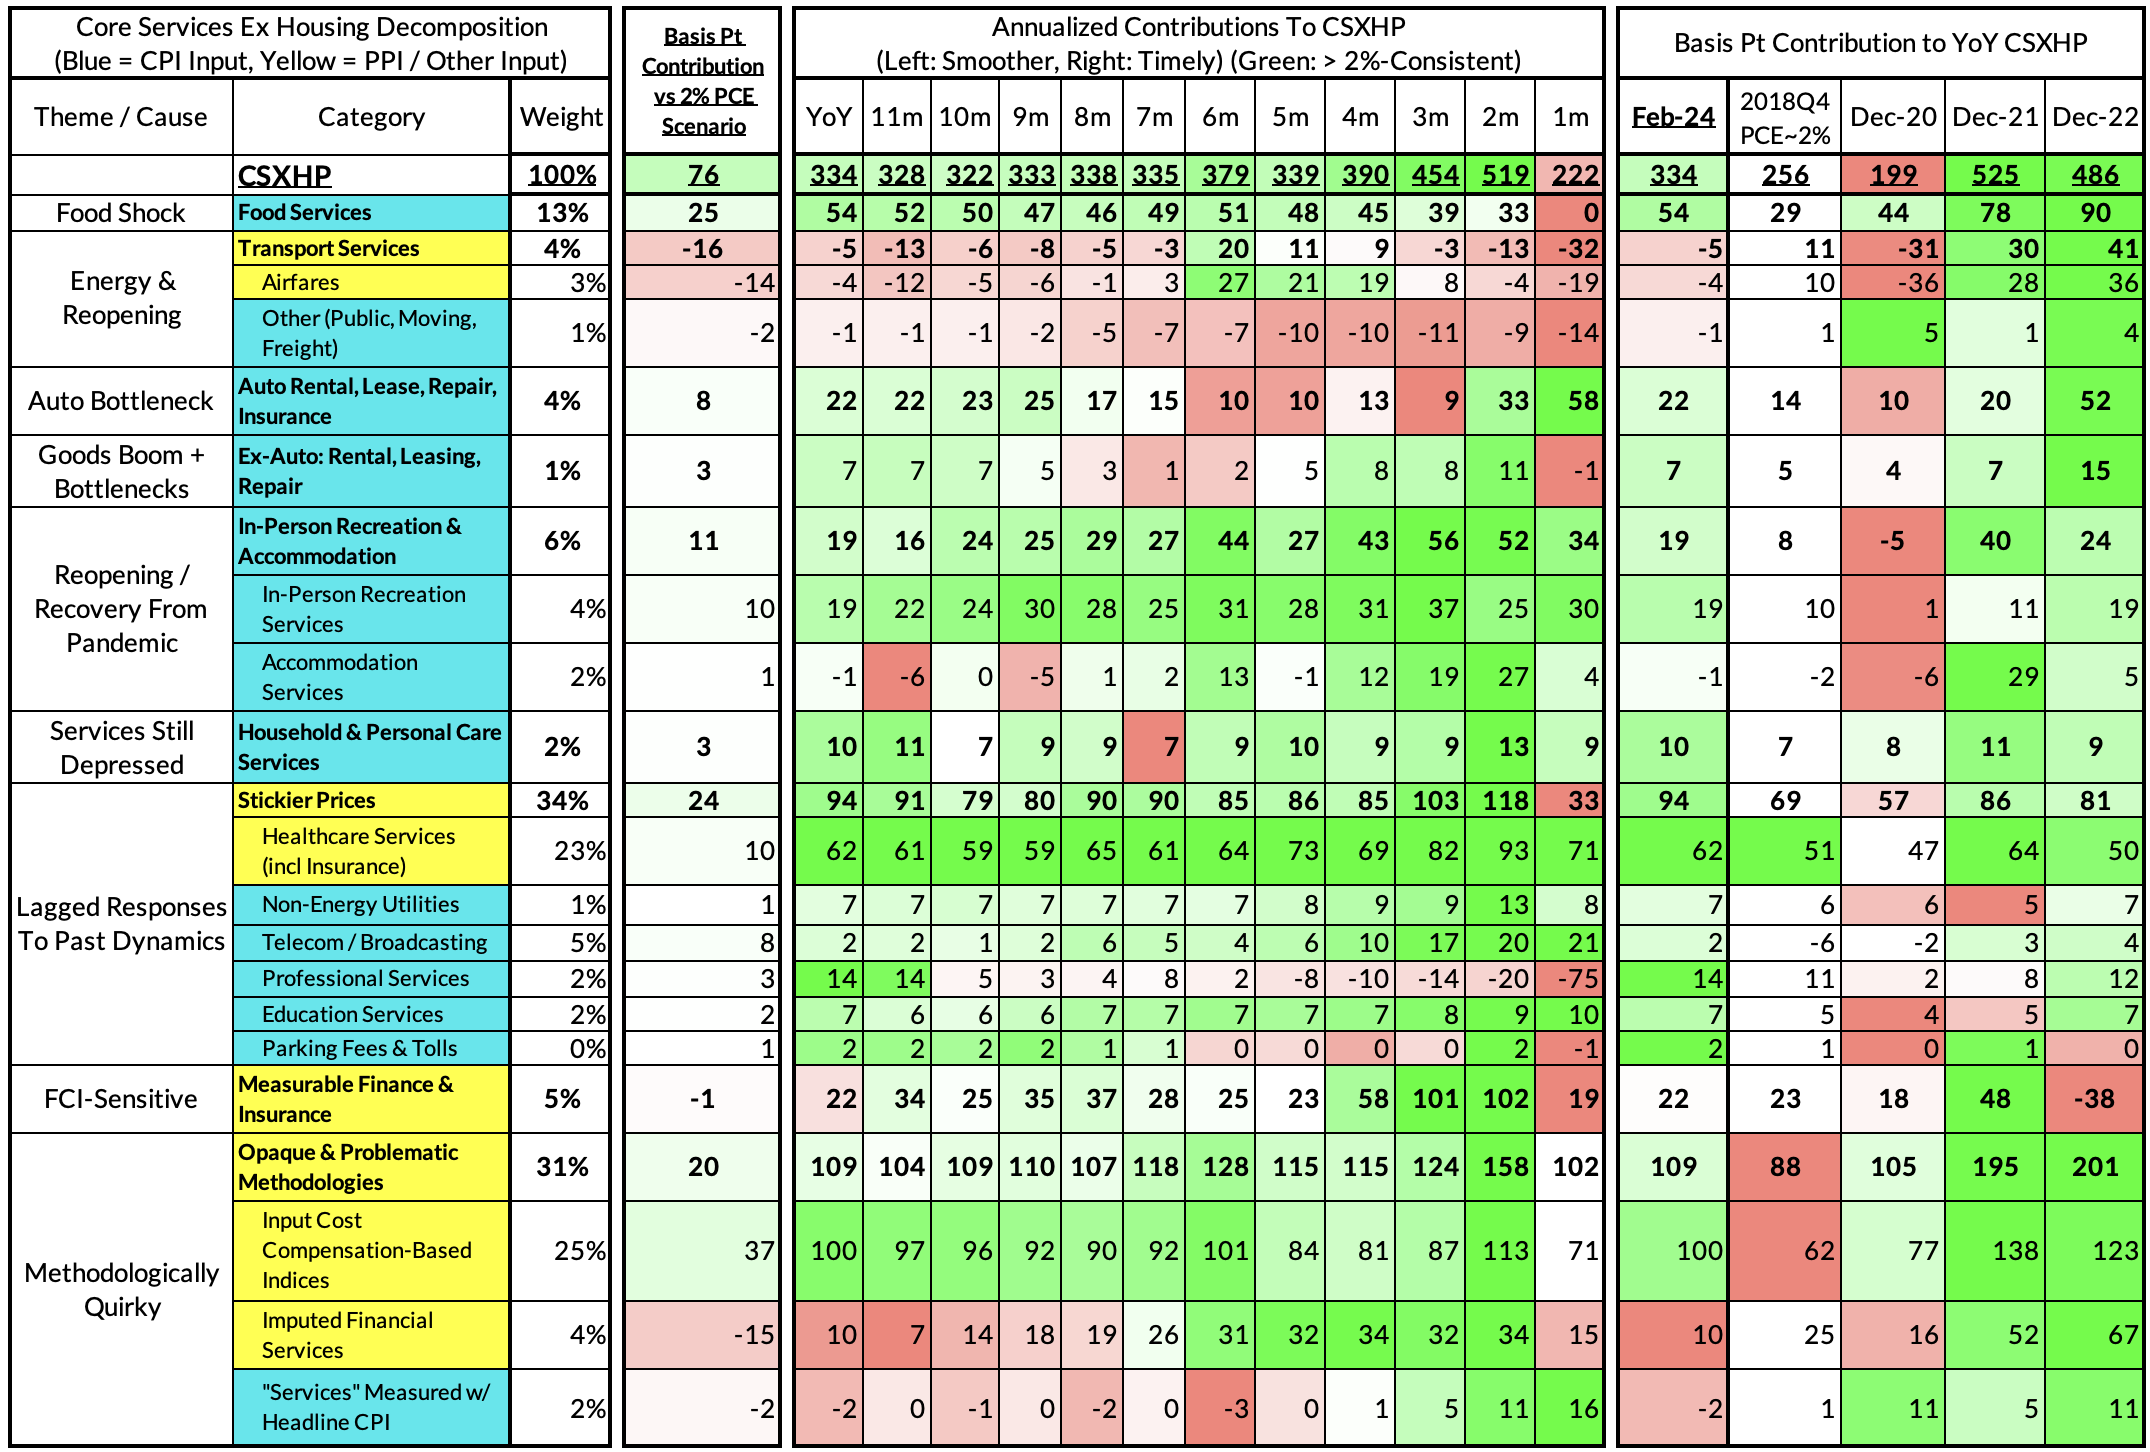
February monthly supercore ran at a 2.22% annualized rate, a 37 basis point undershoot of what would be consistent with 2% headline and core PCE.