Core-Cast is our nowcasting model to track the Fed's preferred inflation gauges before and through their release date. The heatmaps below give a comprehensive view of how inflation components and themes are performing relative to what transpires when inflation is running at 2%. If you are interested in more timely access to this content following the release of data, feel free to reach out to us here.
Today we received upside information in the final PCE numbers, relative to our nowcast, and even more so versus a soft forecasting consensus. At the center of the 0.10% upside surprise to year-over-year core PCE (versus our nowcast) was:
An amplified "seasonal echo" in PCE translation of PPI and CPI data (January is a high-leverage month for price increases in stickier categories)
An upside surprise in "price effects" that matter to the calculation of airfares and some other components for PCE purposes.
Most importantly, an additional 10basis point contribution from opaque and problematic indices (input cost indices, imputed financial services) not rooted in CPI, PPI, or IPI data.
Discussion
January PCE thus proved to be hot (for reasons we warned) and Q1 inflation upside risks remain. The new information today is not particularly tied to the supply and demand dynamics apparent in CPI and PPI data, and foretell more monthly PCE volatility over the course of this year. The risk of hawkish panic from the Fed in response to this upside information is nevertheless elevated. The Fed is most likely to signal a higher terminal rate at their March meeting in response, with a risk of faster hikes becoming more mainstream, especially if February inflation proves equally hot across components.
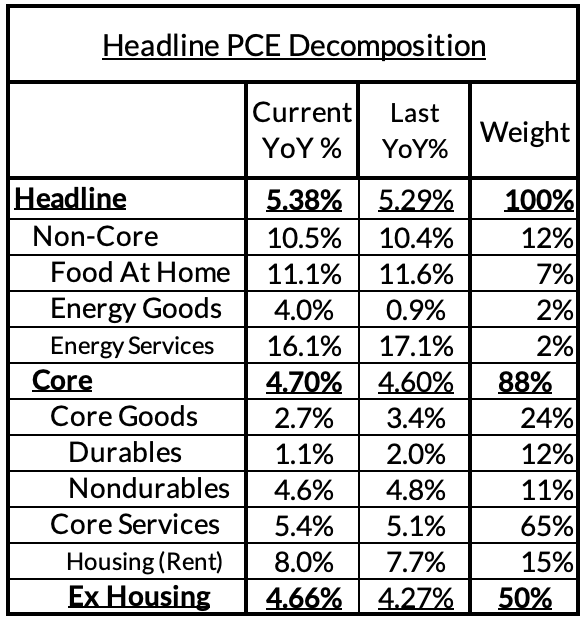
Headline PCE increased from 5.29% to 5.38% year over year (0.62% month-over-month); the core-cast had only implied a flat y/y trajectory. In our previous update, headline PCE was 5.0% but PCE underwent incomplete seasonal adjustment revisions that lifted up 2022Q4 inflation. We'll provide a more complete update soon regarding the impact of seasonal adjustment revisions over the course of the year (big changes coming in September).
Core PCE increased from 4.60% to 4.7% y/y (0.56% m/m); the core-cast had only implied a flat y/y trajectory and 0.46% m/m. Revisions for 2022Q4 pushed up y/y core PCE an additional 20bps. While stickier prices and airfares added to today's suprise, so did opaque indices in PCE not based on market prices for consumption (input cost indices which invoke compensation measures for an ad hoc set of categories, components that aim to proxy financial services received without an observed payment). These 'problematic' components' added 14bps to y/y core PCE vs what our core-cast model implied.
Core Services Ex Housing PCE rose from 4.27% to 4.66% y/y (0.58% m/m); the core-cast implied less acceleration and 0.48% m/m. The incomplete seasonal adjustment revisions for 2022Q4 lifted up year-over-year readings an additional 15bps. The crux of the year-over-year surprise can be distilled to aforementioned opaque indices getting revised and surprising higher. They added 19bps to y/y CSXHP in January vs what our core-cast model anticipated. They occupy 30% weight of core services ex housing. Whether the Fed realizes it or not, they are engaged in a form of ad hoc wage targeting by giving outsized importance to some of these components.
Core PCE Heatmaps
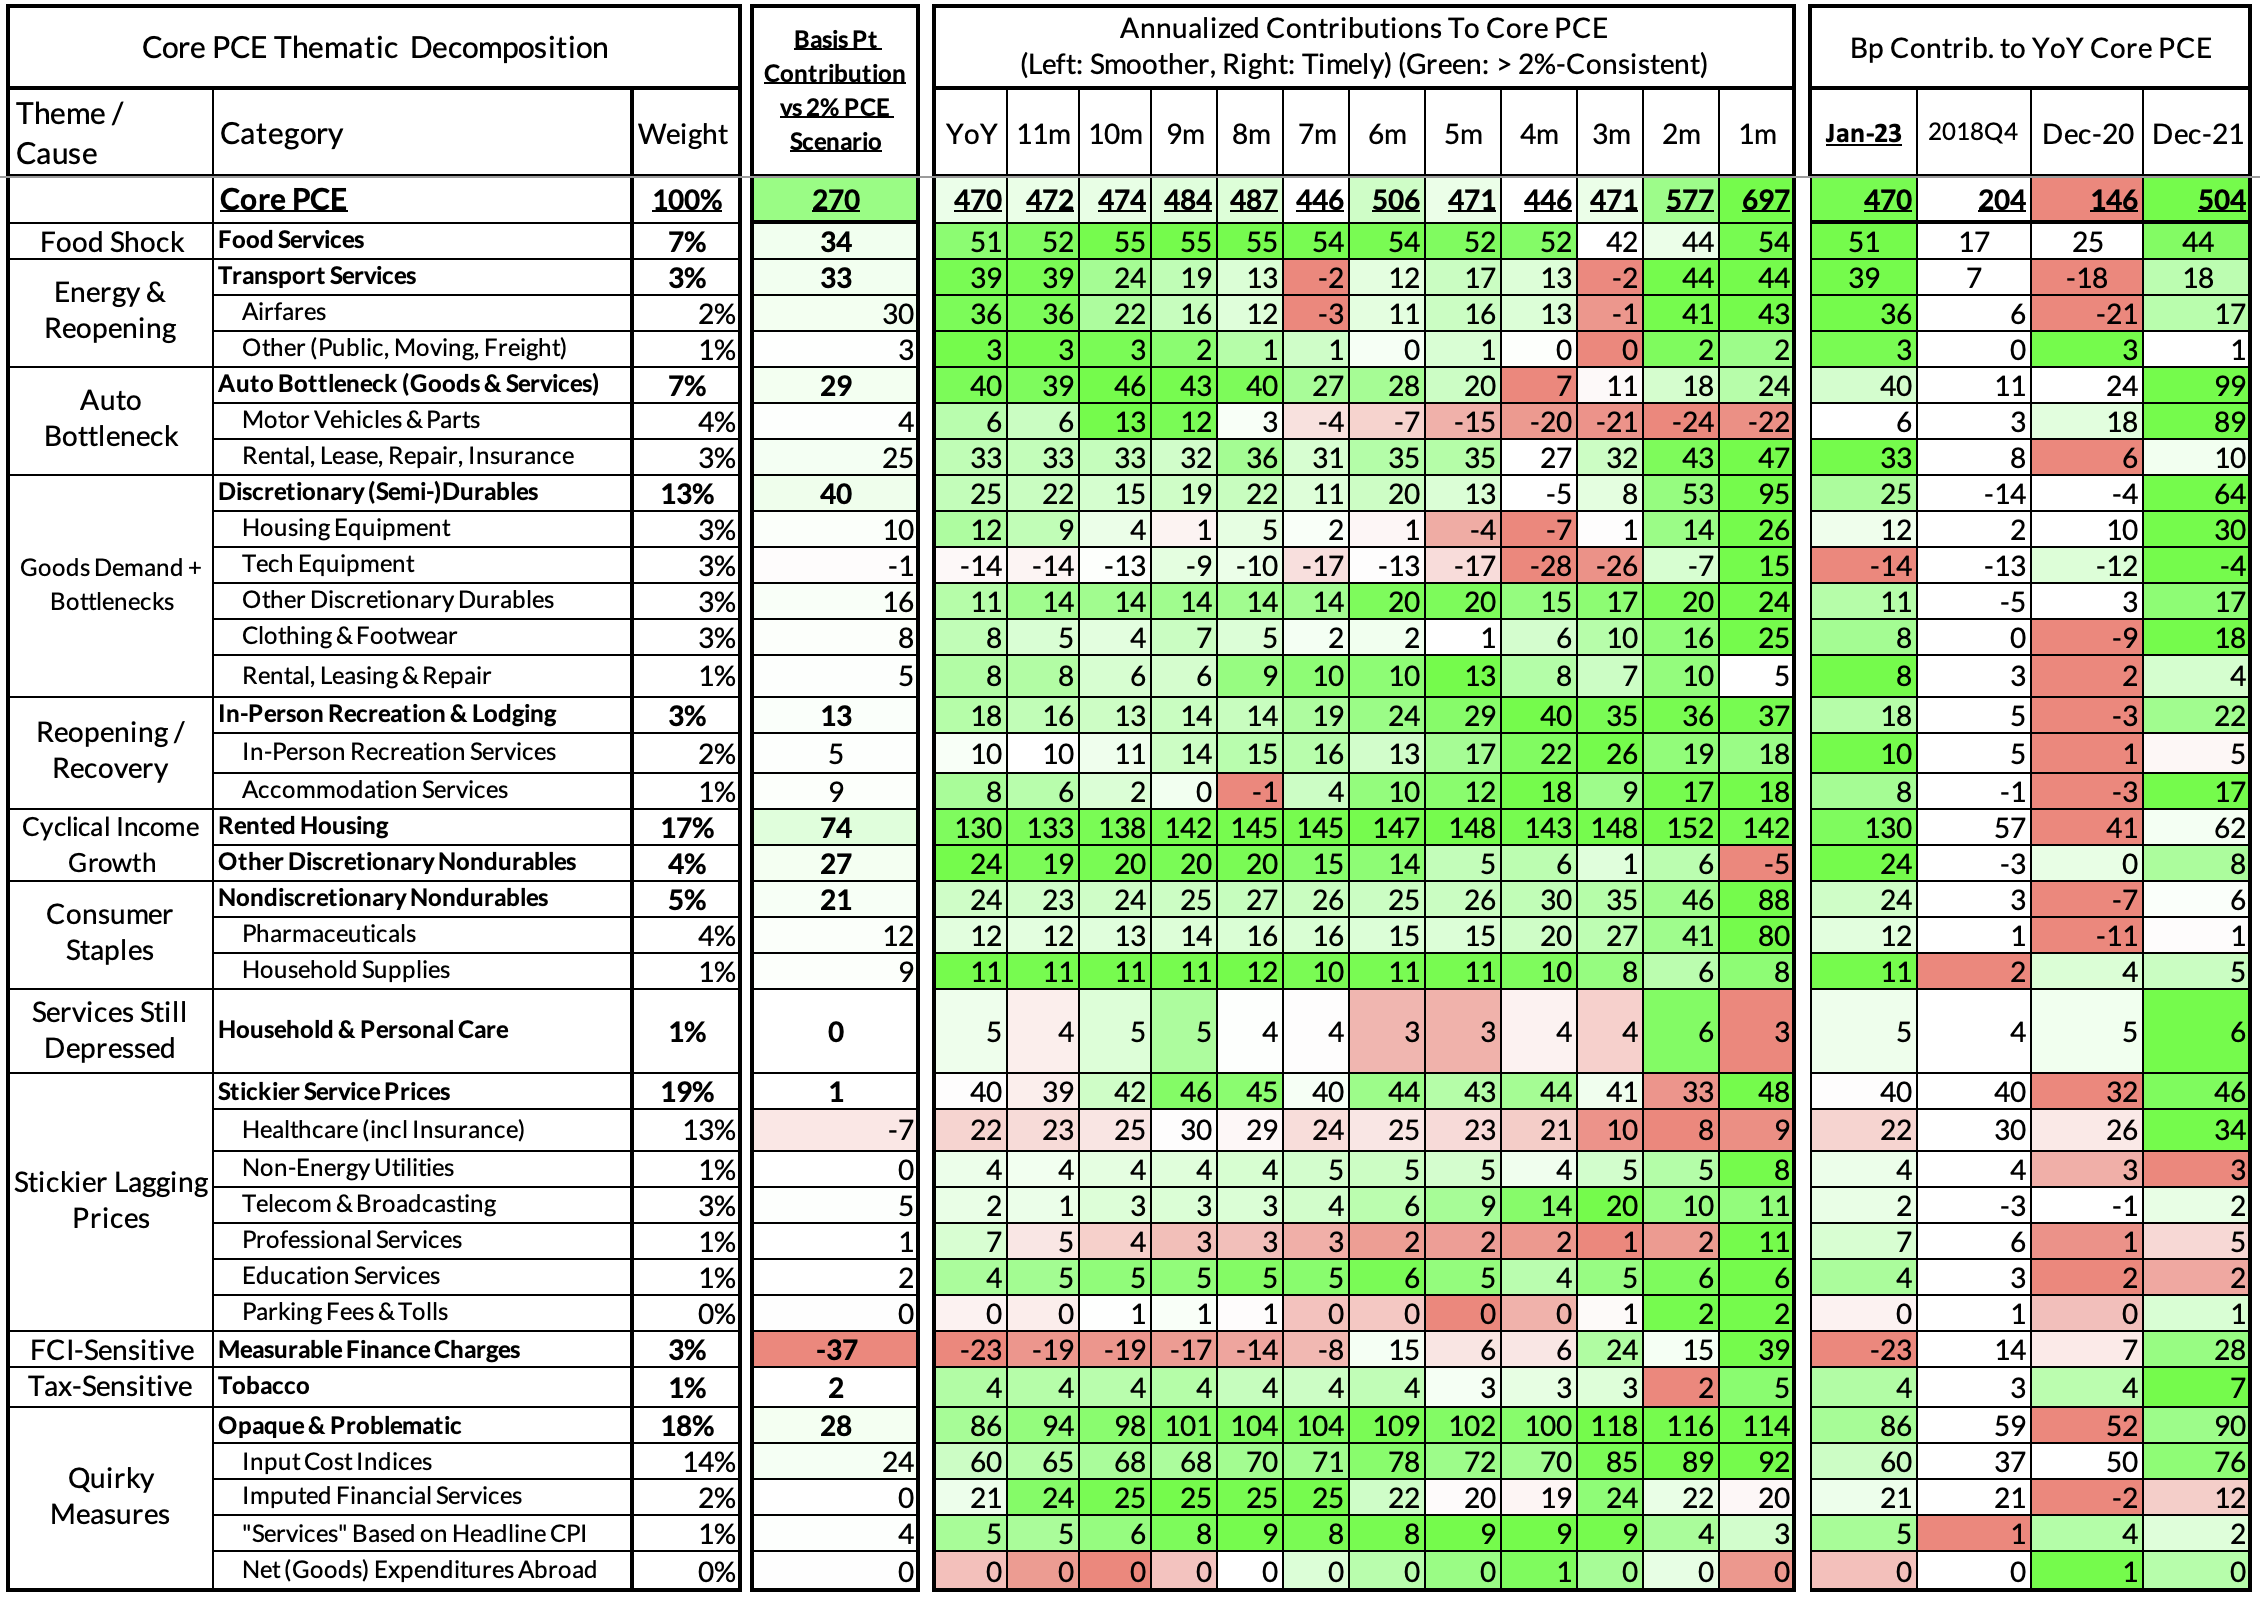
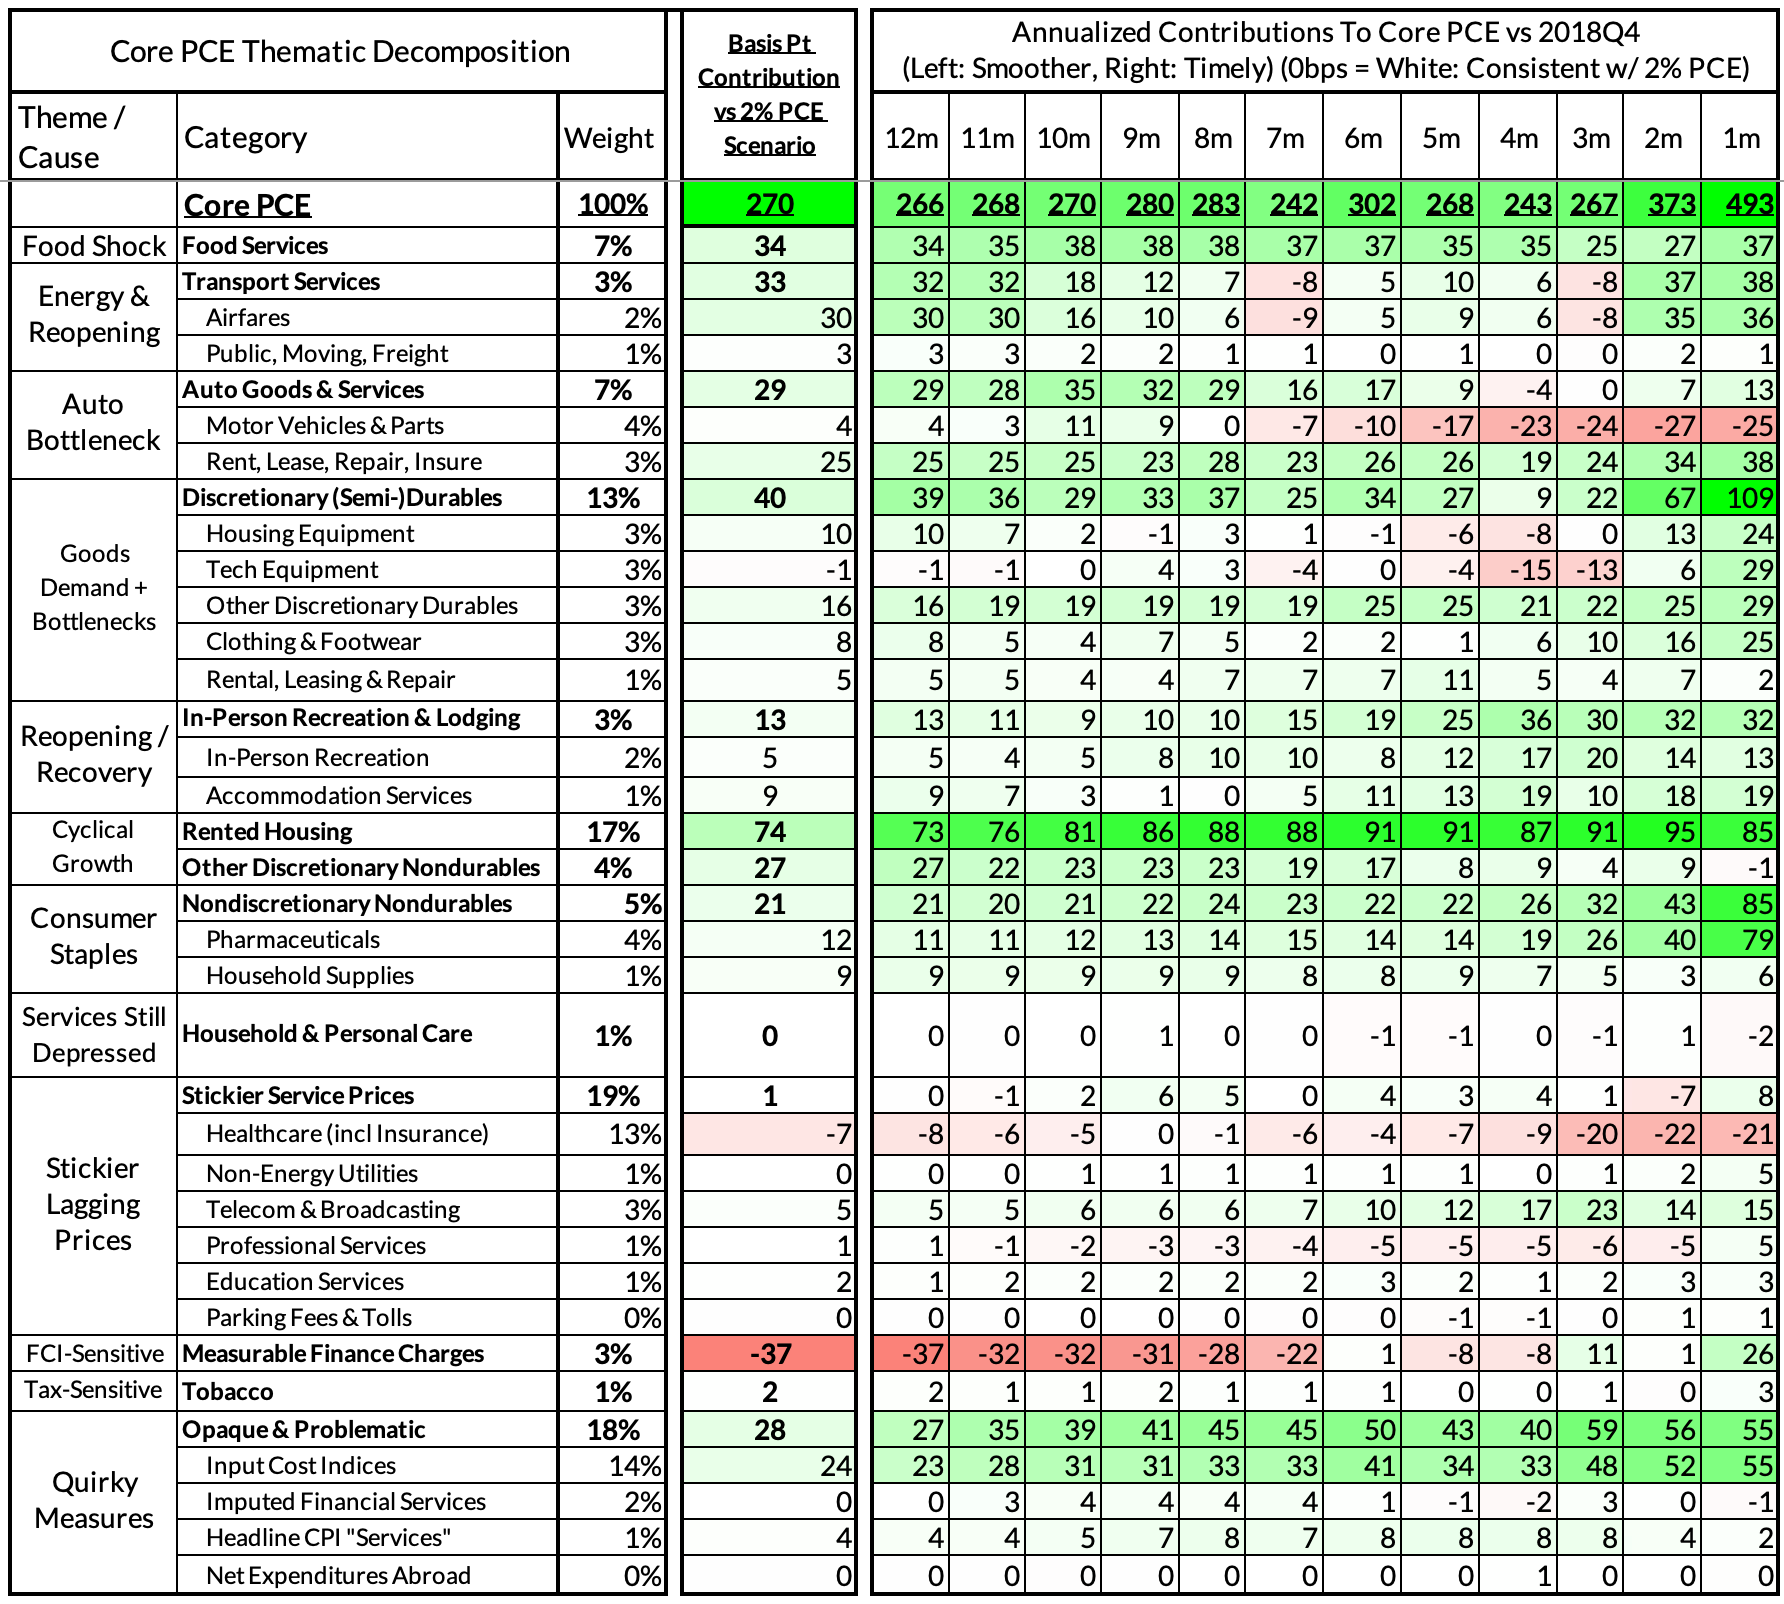
Core PCE year-over-year readings are now running at 4.7% year over year, 270 basis points above what would be transpiring if inflation was running close to the Fed's target. There are supply, demand, and mixed causes for this result.
Food, energy, and automobile supply shocks have mattered for both goods and service prices (food services, transportation services, motor vehicles and adjacent services, discretionary durables and semi-durables)
A ripping cyclical recovery tied to reopening has provided the demand-pressure to lift prices (housing, recreation goods and services, and a number of in-person and stickier services, including air travel).
Of course there are also prices where there is overlap between reopening dynamics and identifiable supply constraints (airfares, discretionary goods).
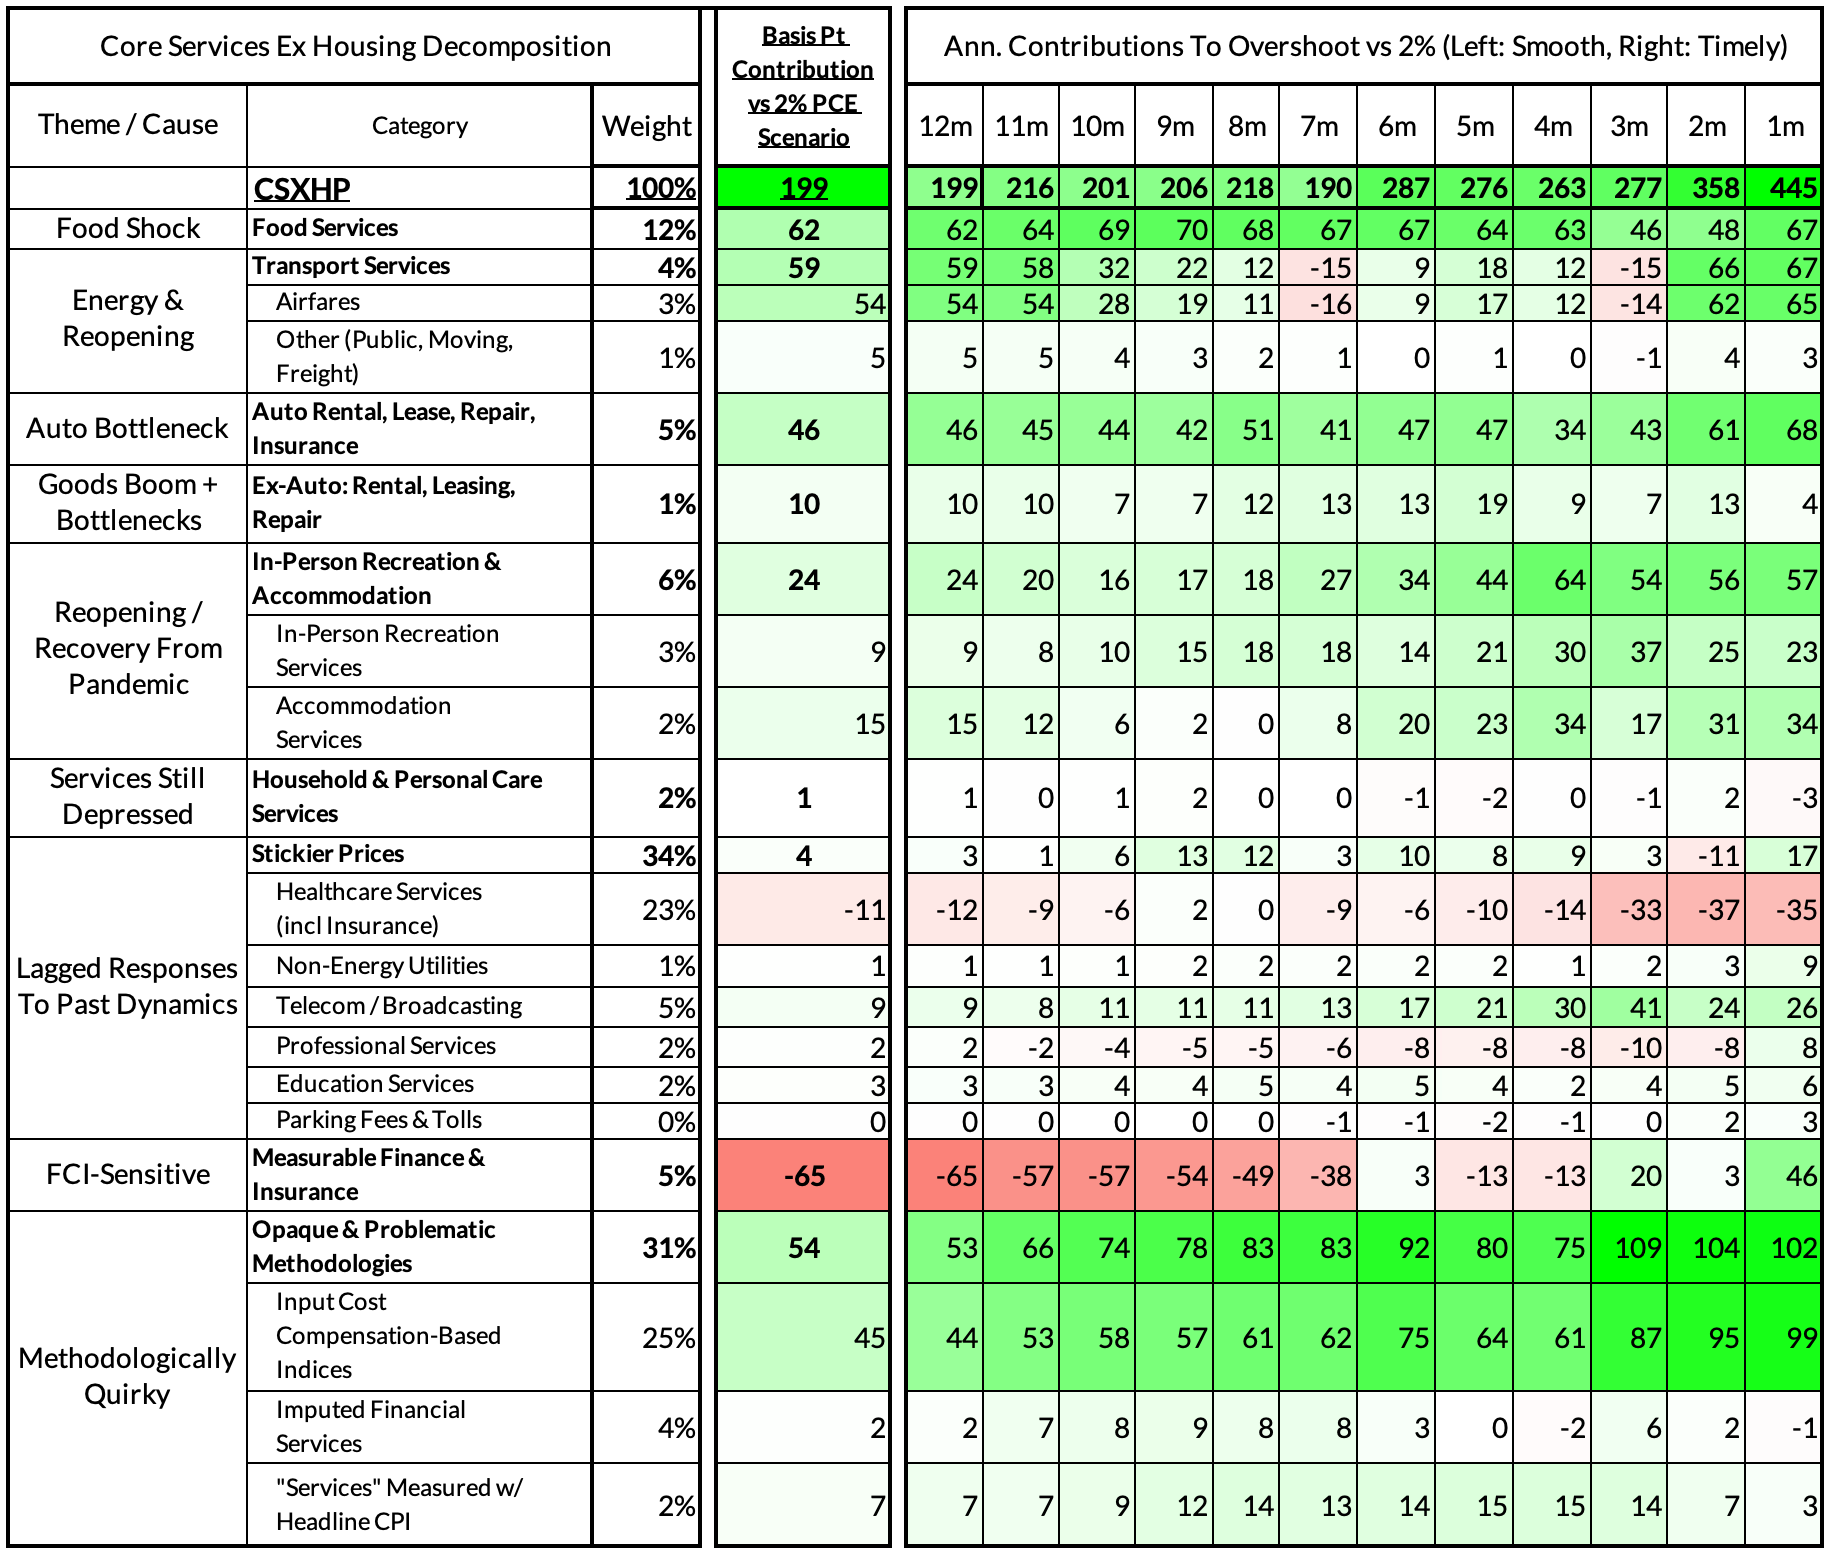
Core Services Ex Housing PCE Heatmaps
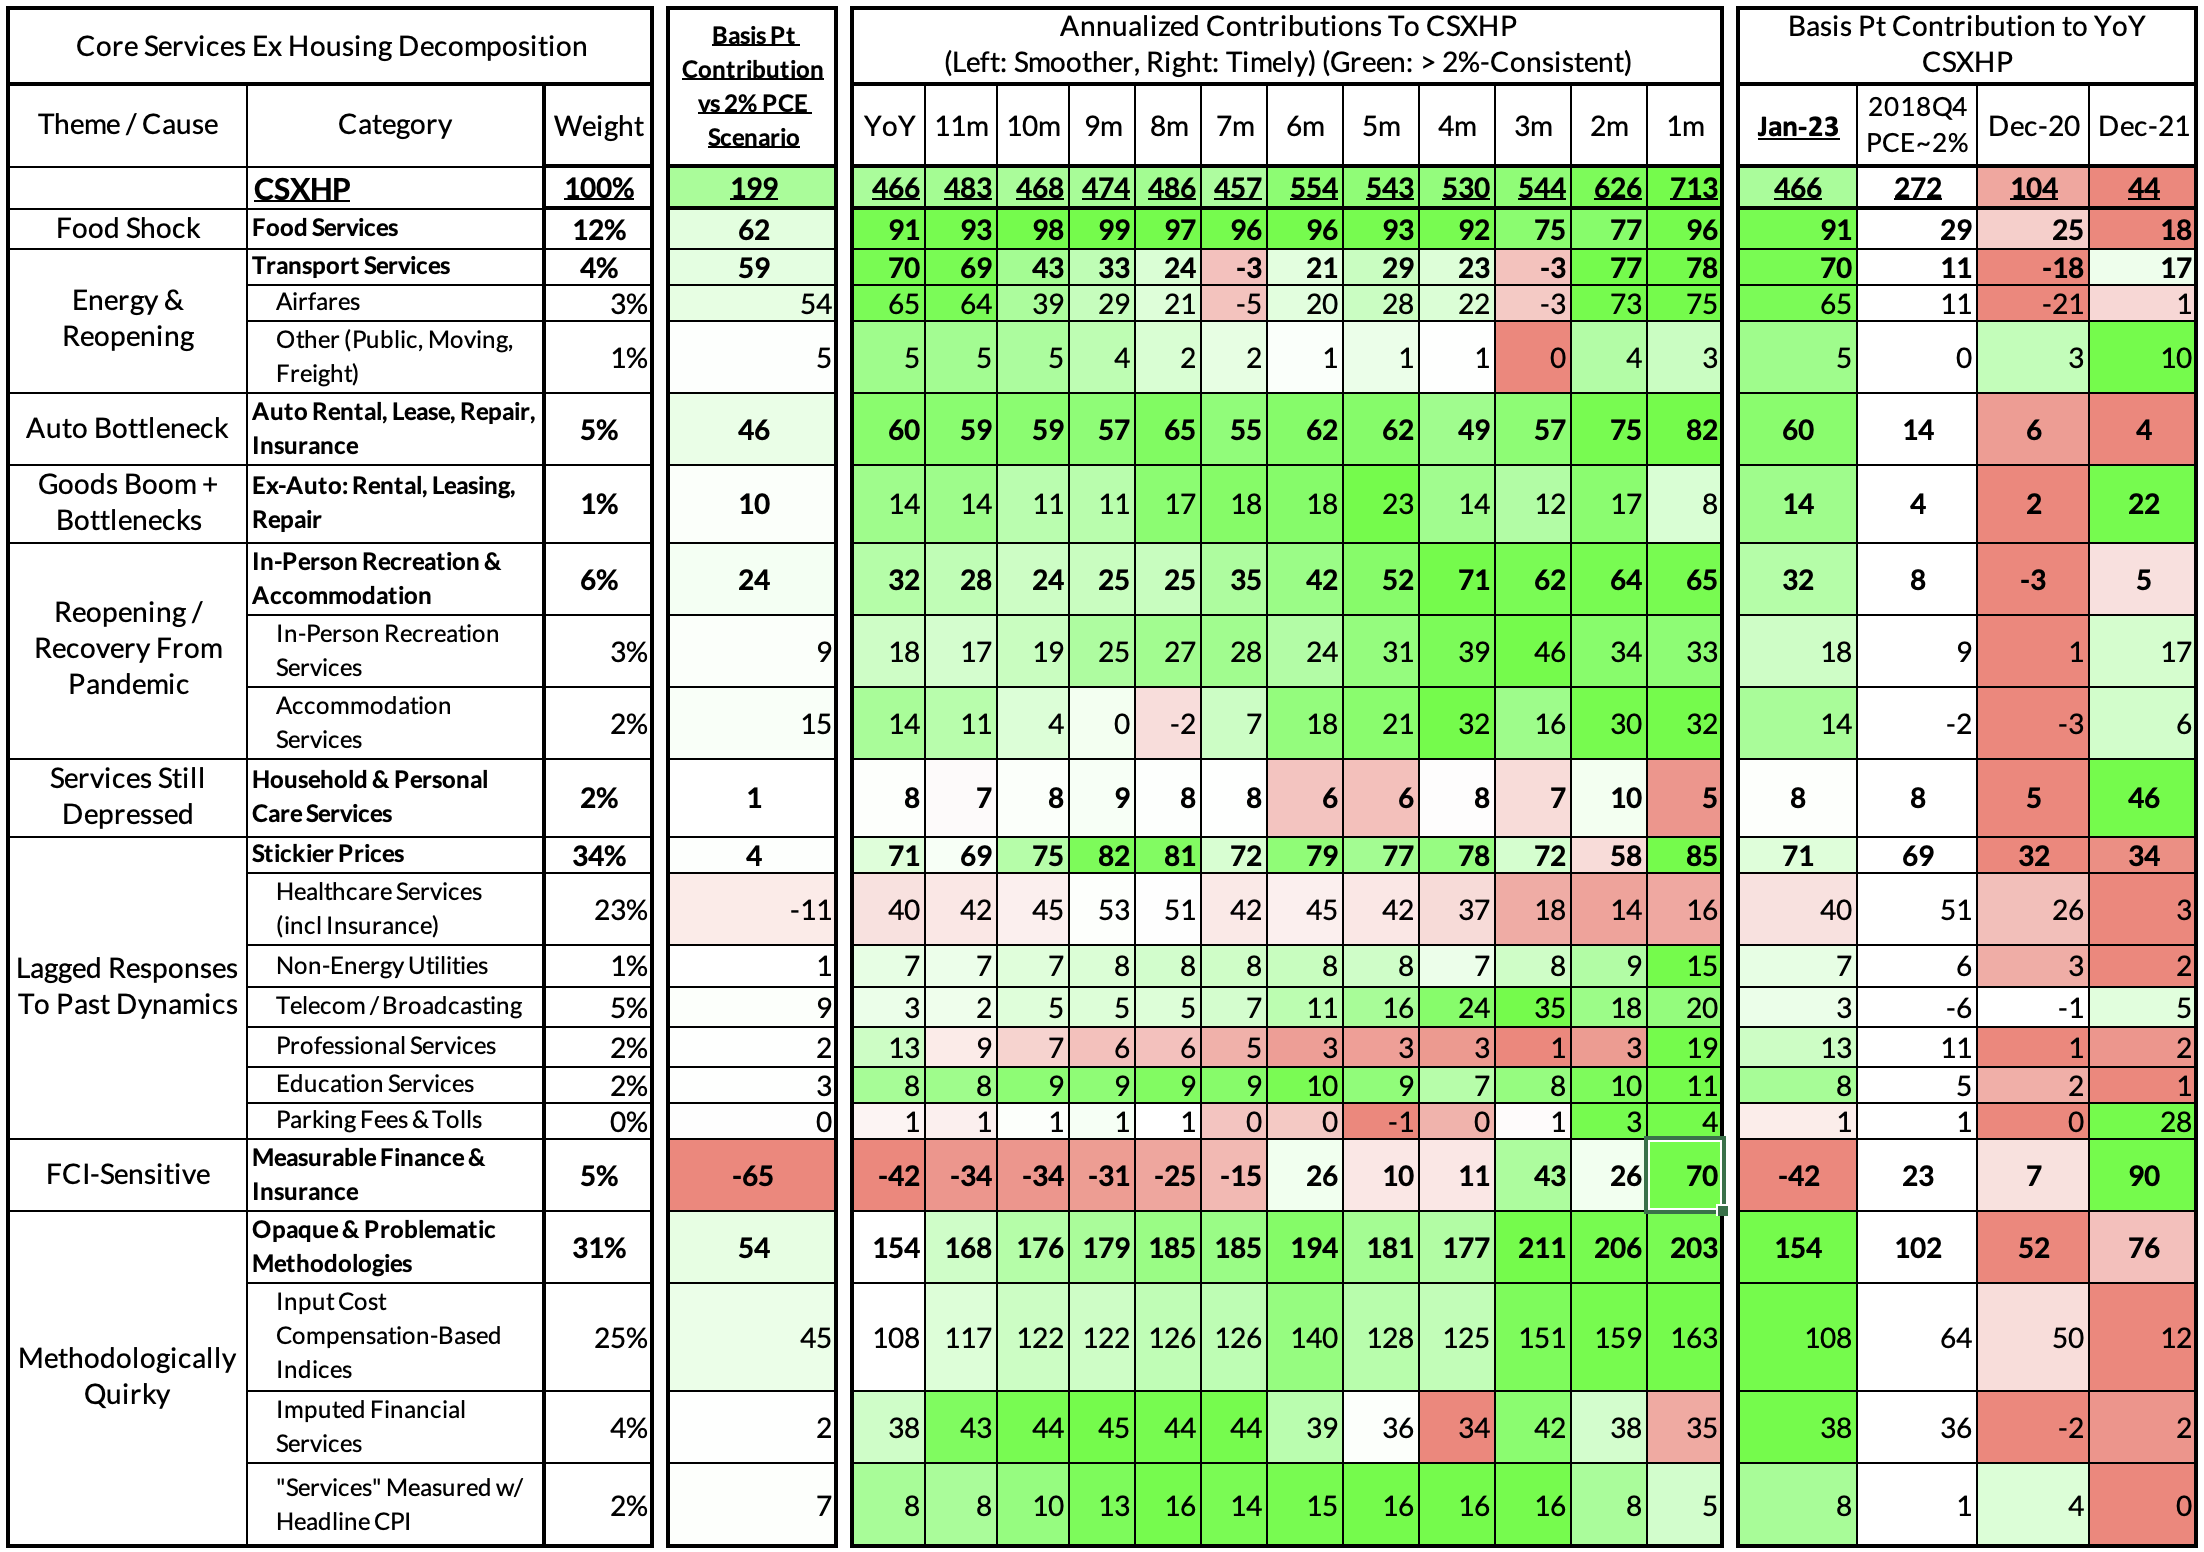
Core PCE year-over-year readings are now running at 4.7% year over year as well, nearly 200 basis points above what would be transpiring if inflation was running close to the Fed's target. Problematic components like imputed financial services and input cost indices are starting to grow in their relevance, contributing 54bps to the overshoot. Nevertheless, the dominant fundamental dynamics to focus on are whether:
Food services (62bps / 31% of overshoot) can follow food price deceleration
Transportation services (59bps / 30% of overshoot) can cool with lower jet fuel and diesel prices and dissipating reopening pressures.
Motor vehicle services (46bps / 23% of overshoot) can cool with an overall cooling in automobile prices (ideally driven by a full recovery in motor vehicle assemblies)
In-person recreation and accommodation services cool with dissipating reopening pressures (24bps / 12% of overshoot)
Discretionary goods-adjacent service prices (10bps / 5% of overshoot) can cool alongside goods demand generally, while supply chains continue to play catch-up.
The link has been copied!
Your link has expired. Please request a new one.
Your link has expired. Please request a new one.
Your link has expired. Please request a new one.
Great! You've successfully signed up.
Great! You've successfully signed up.
Welcome back! You've successfully signed in.
Success! You now have access to additional content.