Core-Cast is our nowcasting model to track the Fed's preferred inflation gauges before and through their release date. The heatmaps below give a comprehensive view of how inflation components and themes are performing relative to what transpires when inflation is running at 2%.
Summary: If you thought that 2% core PCE inflation was basically impossible without a recession, today is as good a day as ever to revisit that prior. Our nowcasts yesterday were just a touch high; our assessments are largely unchanged. The surprise innovations in today's data show that even the wild card "dark spaces"—input cost indices and imputed financial services—might begin to catch down as a result of fundamental dynamics (slower wage growth, slower PPI growth, higher deposit rates), which would accelerate the timeline for getting back to 2% core PCE. That said, it's too early to have high confidence about the trajectory in these quirky segments.
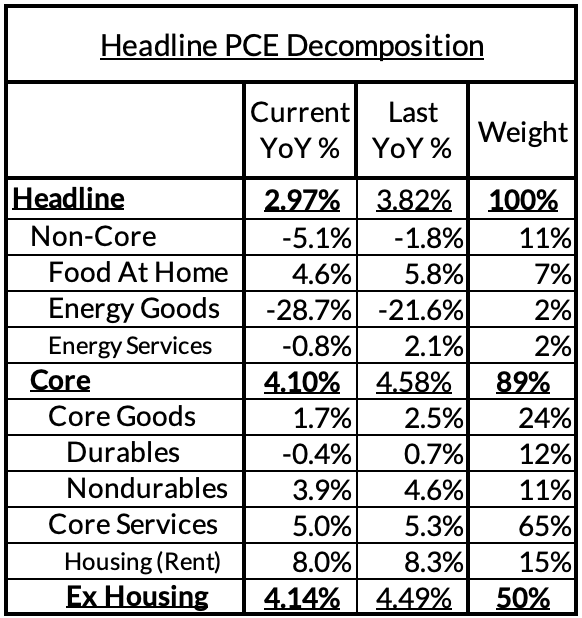
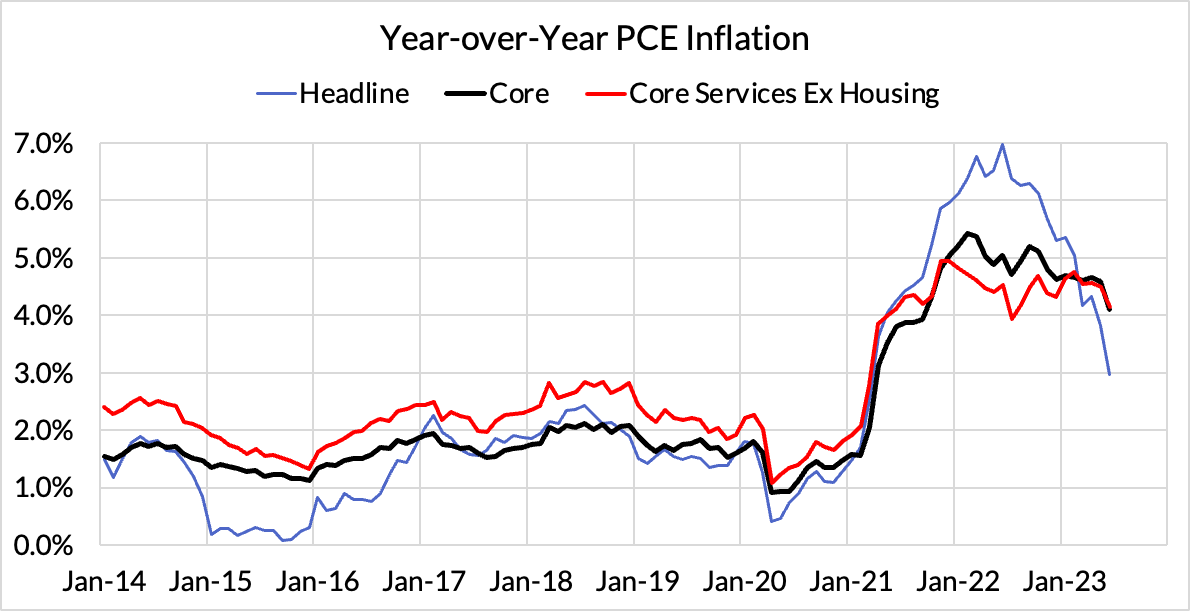
Headline PCE declined, from 3.82%* year-over-year in May to 2.97% in June (vs our 2.99% nowcast). 0.16% monthly increase vs 0.14%, our latest nowcast. *The latest revisions push year-over-year readings for May marginally from 3.85% to 3.82%
Core PCE declined, from 4.58%* year-over-year in May to 4.10% in June (vs our 4.12% nowcast). 0.17% monthly increase vs 0.19%, our latest nowcast. *The latest revisions push year-over-year readings for May from 4.62% to 4.58%. Monthly annualized core PCE was precisely 2.00%!
Core Services Ex Housing PCE (CSXHP) declined, from 4.49%* year-over-year in May to 4.14% in June (vs our 4.18% nowcast). 0.22% monthly increase vs 0.28%, our latest nowcast. *Latest revisions push down May year-over-year readings from 4.54% to 4.49%. When core PCE is running at 2%, CSXHP typically runs at 2.68%. The current overshoot is effectively 146 basis points (196 basis points as of the May PCE release). Monthly annualized CSXHP is 267 basis points, 1 basis point below what transpires when PCE is at 2%.
Takeaways:
We're At 2% For This Month At Least. Both on Core PCE and on Core Services Ex Housing, the monthly readings are what you would see when inflation is running at 2%. Of course this is only one month, but it's a necessary condition for inflation to run at or below 2% for at least one month if inflation is to reach such readings on a year-over-year basis. If anything, right now inflation is decelerating ahead of our forecasted schedule, though we would warn that some of the developments today could revert in future months. And the next two months should be softer for core inflation than June.
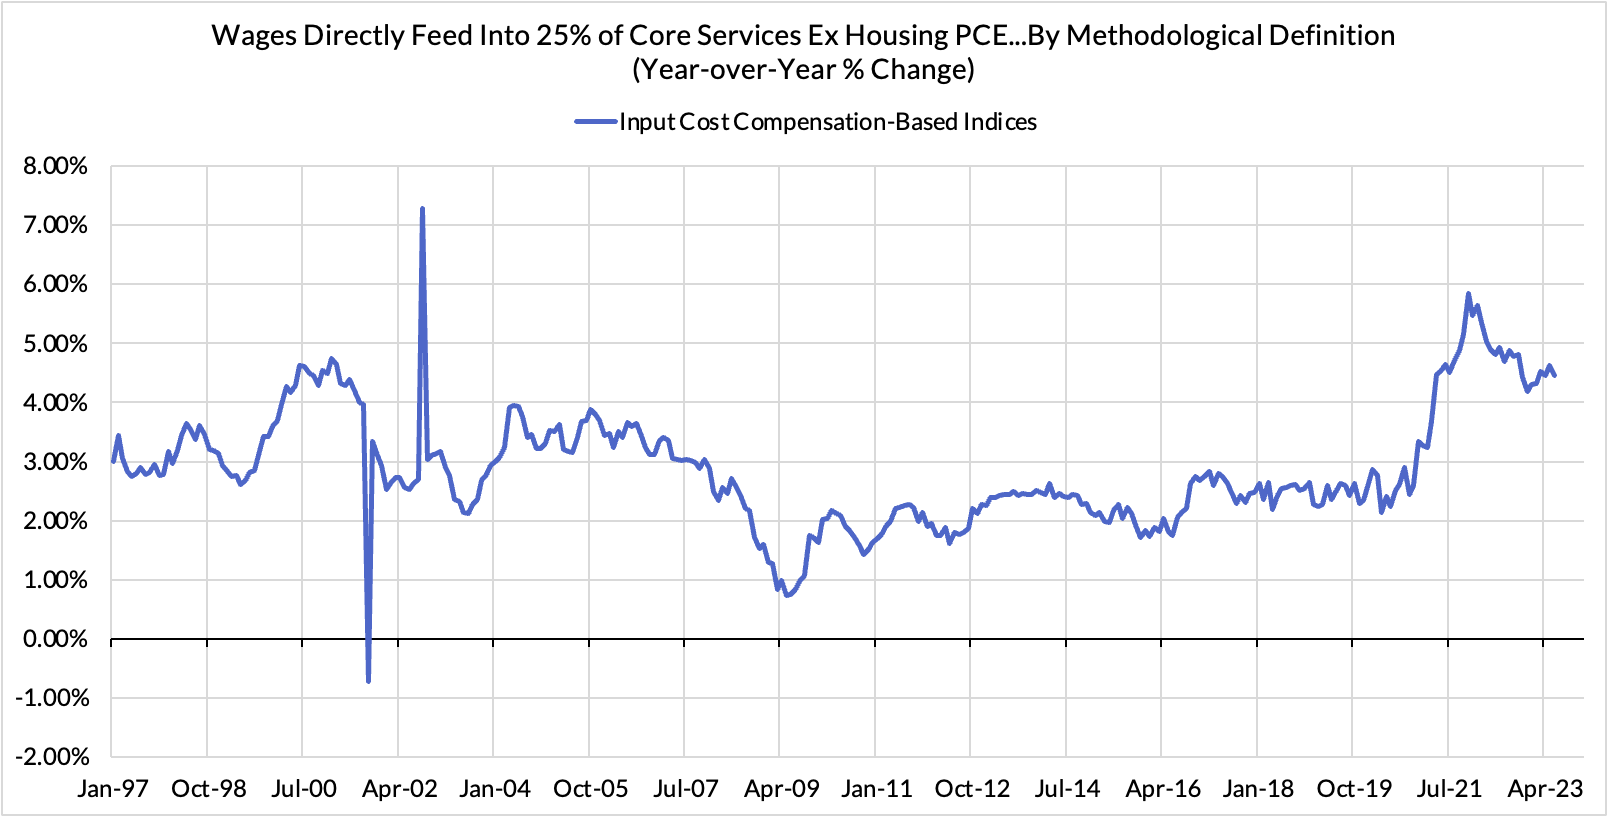
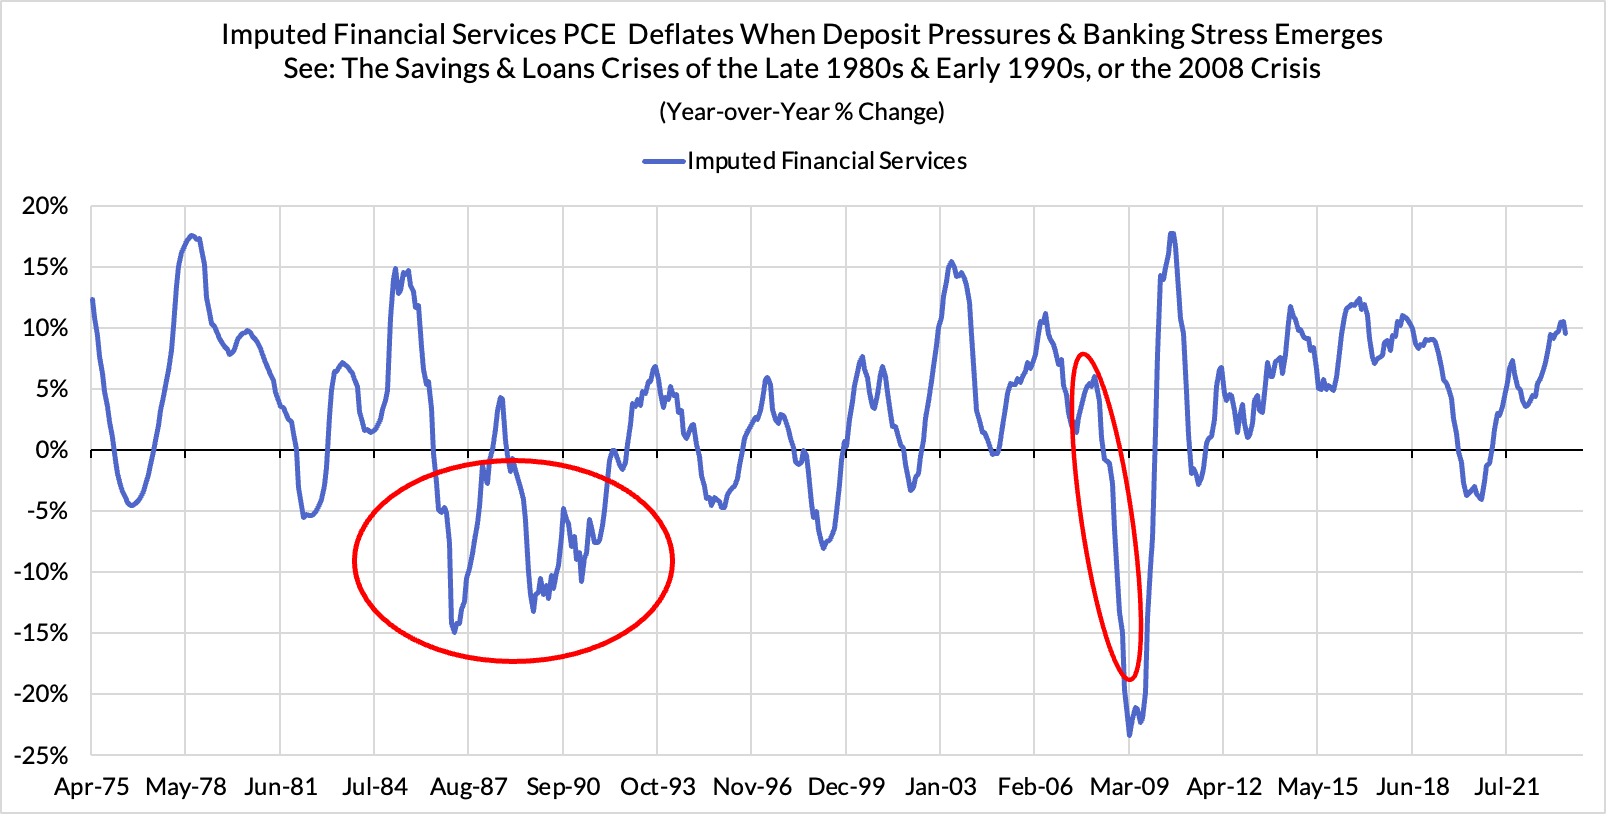
The Dark Spaces Are Showing The Light...For Now: There are two big segments of PCE inflation that are only known the day of: input cost indices and imputed financial services. These series are opaquely measured and subject to mean-reverting revisions, so it's hard to hang your hat on them in the moment. That said, they do show sensitivity to fundamental dynamics over time. Slower wage growth (as most clear in the latest Employment Cost Index release today) and slower PPI growth should have some effect for the input cost indices over time. Likewise, higher deposit rates relative to the Fed Funds Rate should also lower imputed financial services disinflation?
Will The Last Mile Of Disinflation Actually Be The Hardest? "The last mile will be the hardest" rhetoric has been a fixture in Fed and broader discussions of inflation. It's true that rent and motor vehicles only explain part of the inflation overshoot, but they are likely not the only segments of core inflation with scope for deceleration over the coming months and quarters, especially if energy and other input costs are relatively stable. Other inflationary causes also have scope to dissipate and even reverse, including food services, other core goods, and "revenge demand" in-person services. While it's plausible the last mile will indeed be the hardest, we'd highlight the feasibility of alternative scenarios materializing
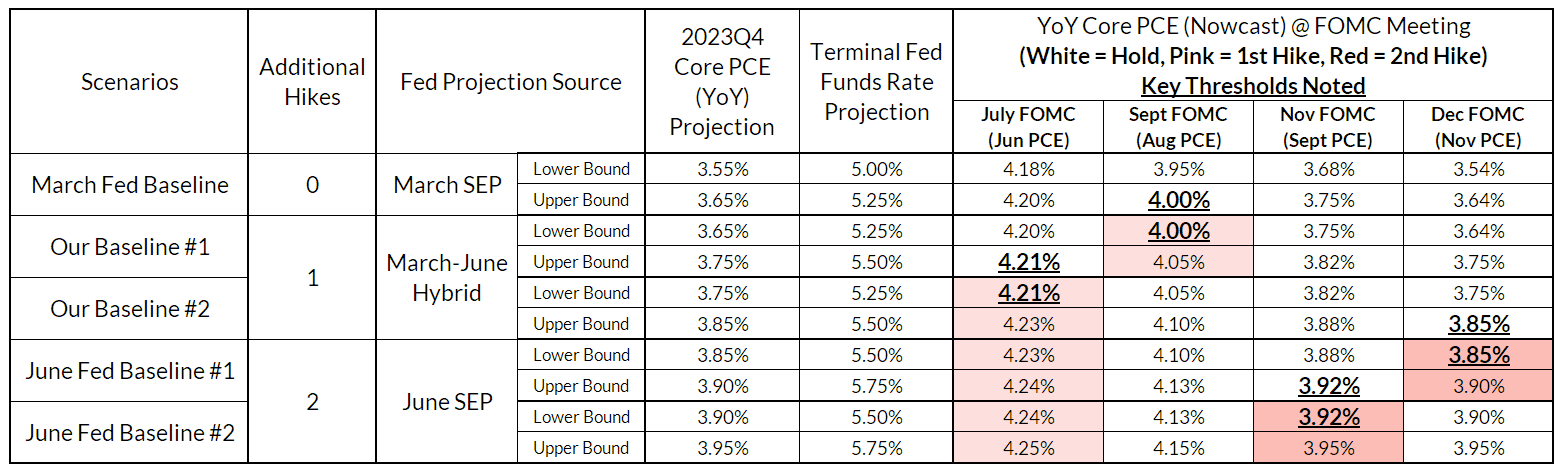
Core PCE inflation is now tracking down faster than what the Fed would have assumed in their March projections
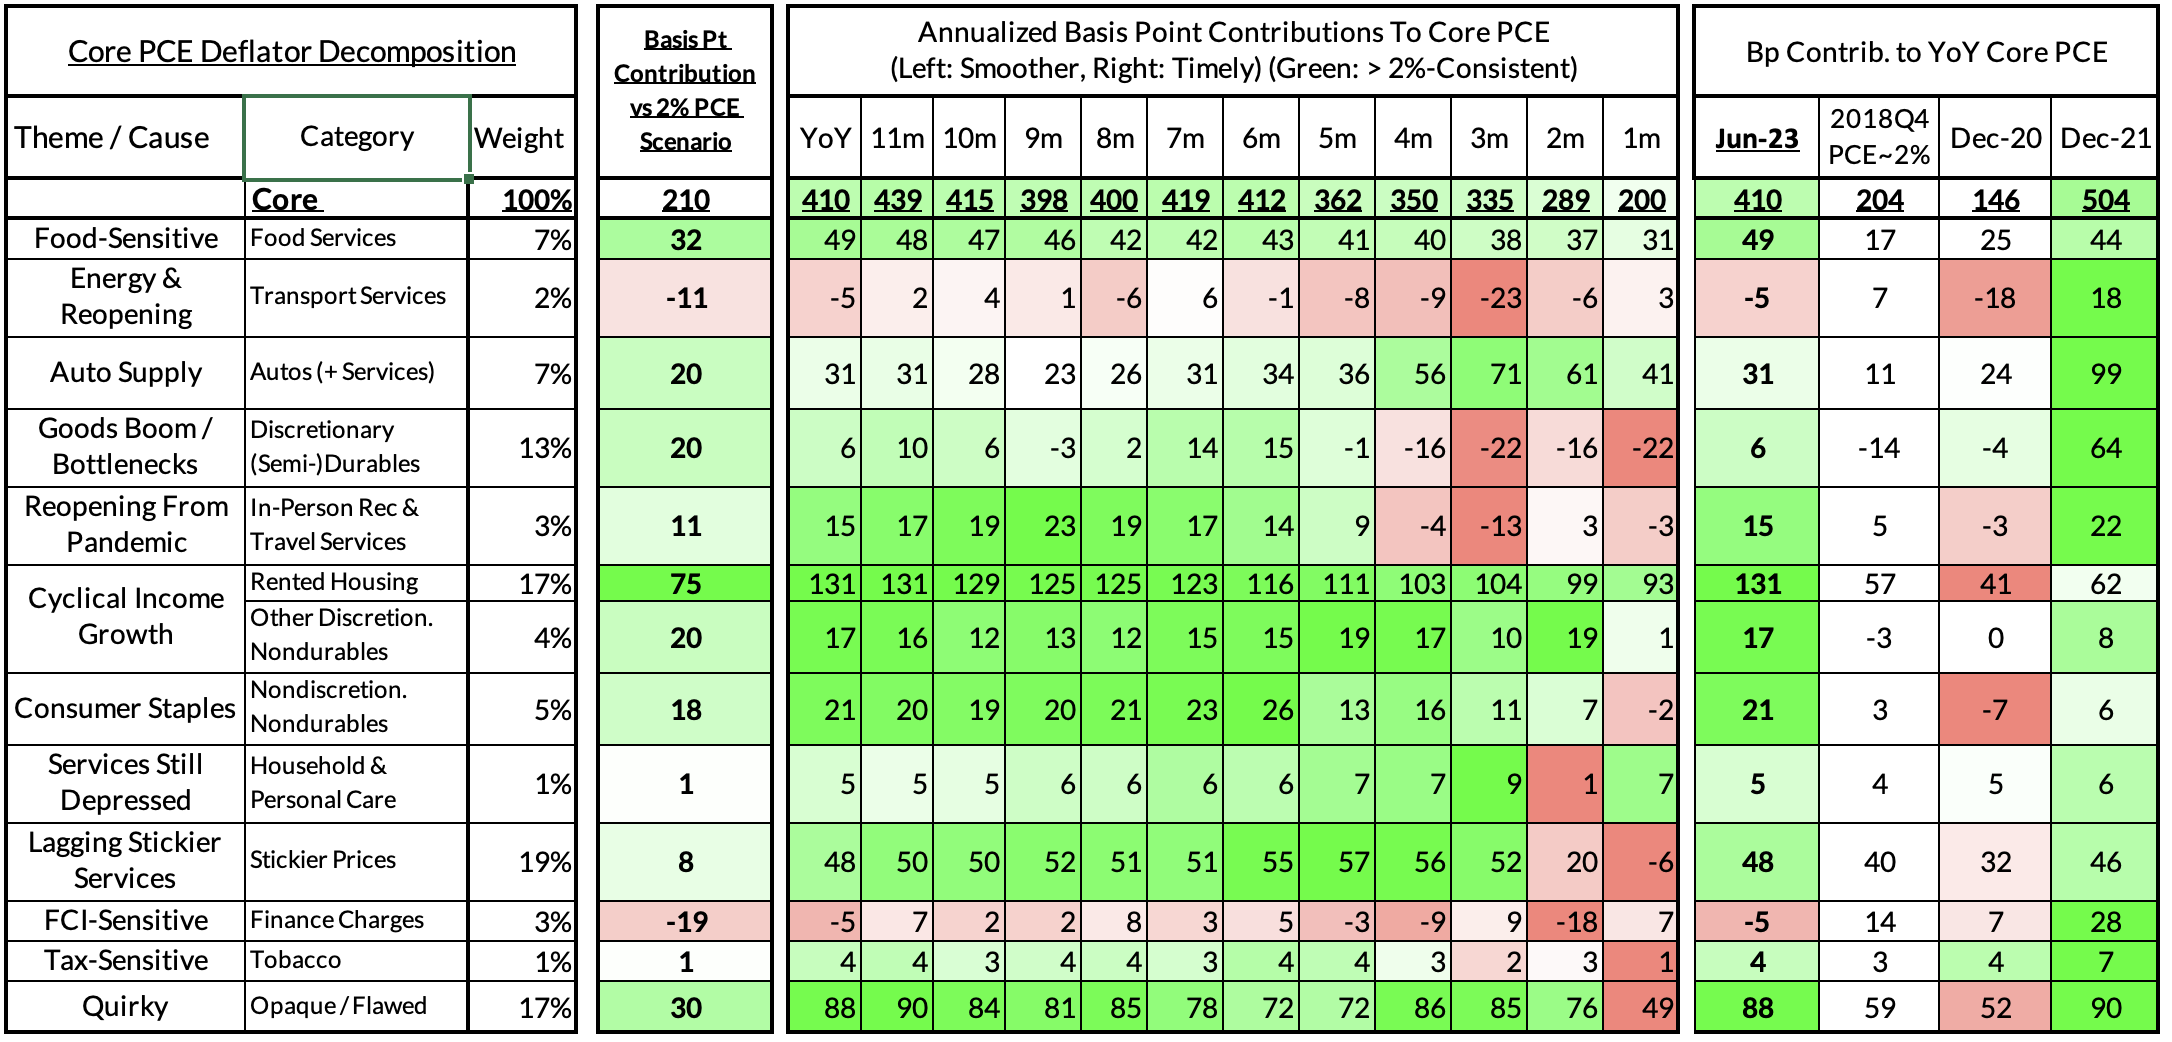
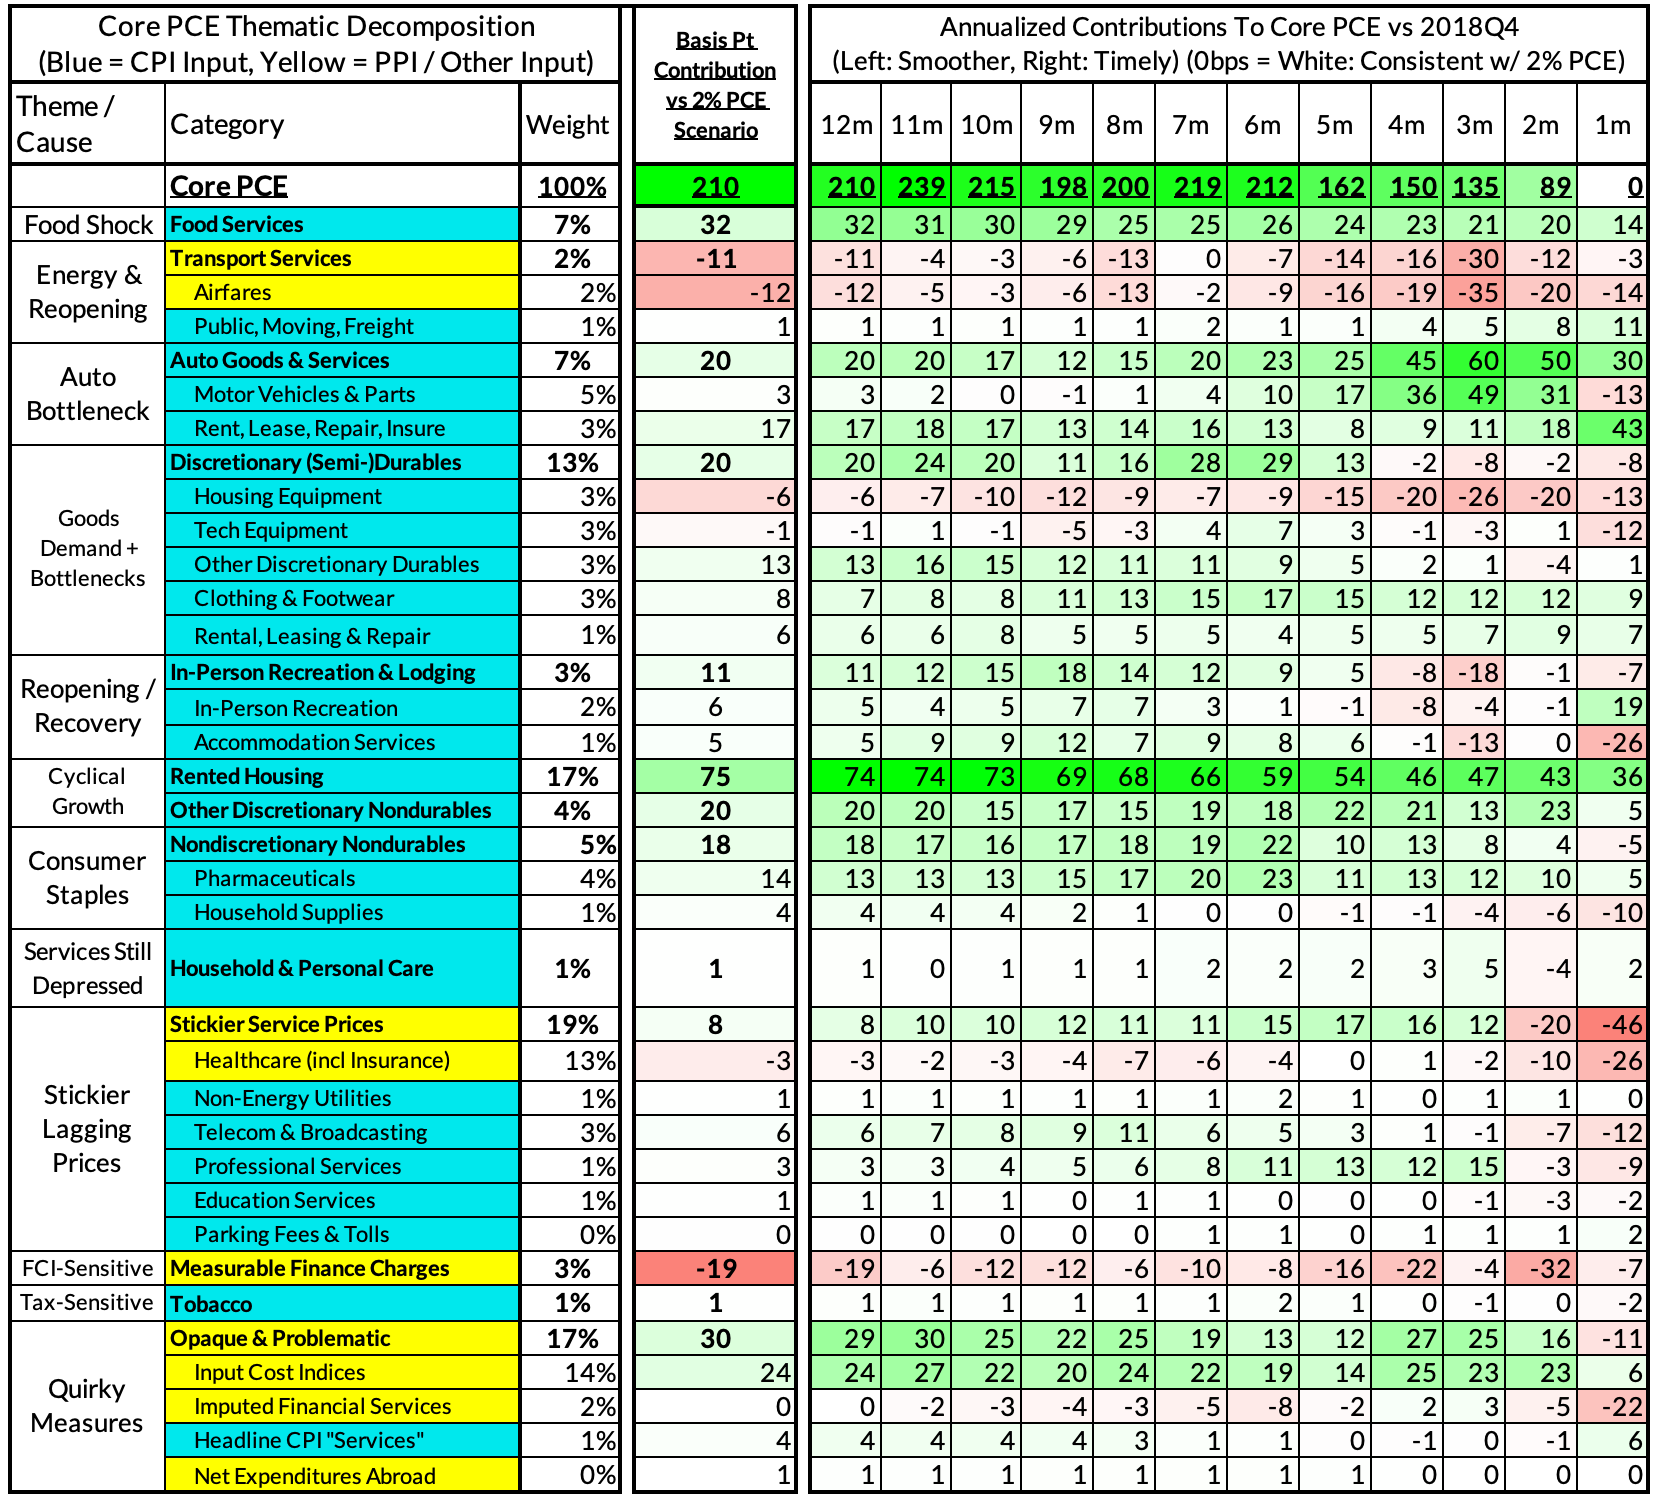
For the Detail-Oriented: Core PCE Heatmaps
Right now Core PCE (PCE less food products and energy) running at a 4.10% as of June, 210 basis points above the Fed's 2% inflation target for PCE. That overshoot is disproportionately driven by catch-up rent CPI inflation in response to the surge in household formation (a byproduct of rapidly recovering job growth) and market rents in 2021-22. Rent is contributing 75 basis points to the 210 basis point core PCE overshoot.
There are other contributors to the overshoot:
Some more supply-driven (automobile bottlenecks likely explain 20 basis points, while food inputs likely added 32 basis points to the overshoot)
Some more demand-driven (in-person recreation and travel services adding 11 basis points to the overshoot)
So with demand- and supply-side drivers (consumer staples and other discretionary goods adding 58 basis points).
Some oddball segments have offsetting effects (measured financial service charges are dragging 19 basis points, while contributions from input cost indices and imputed financial services add 30 basis points to Core PCE vs 2%-consistent outcomes).
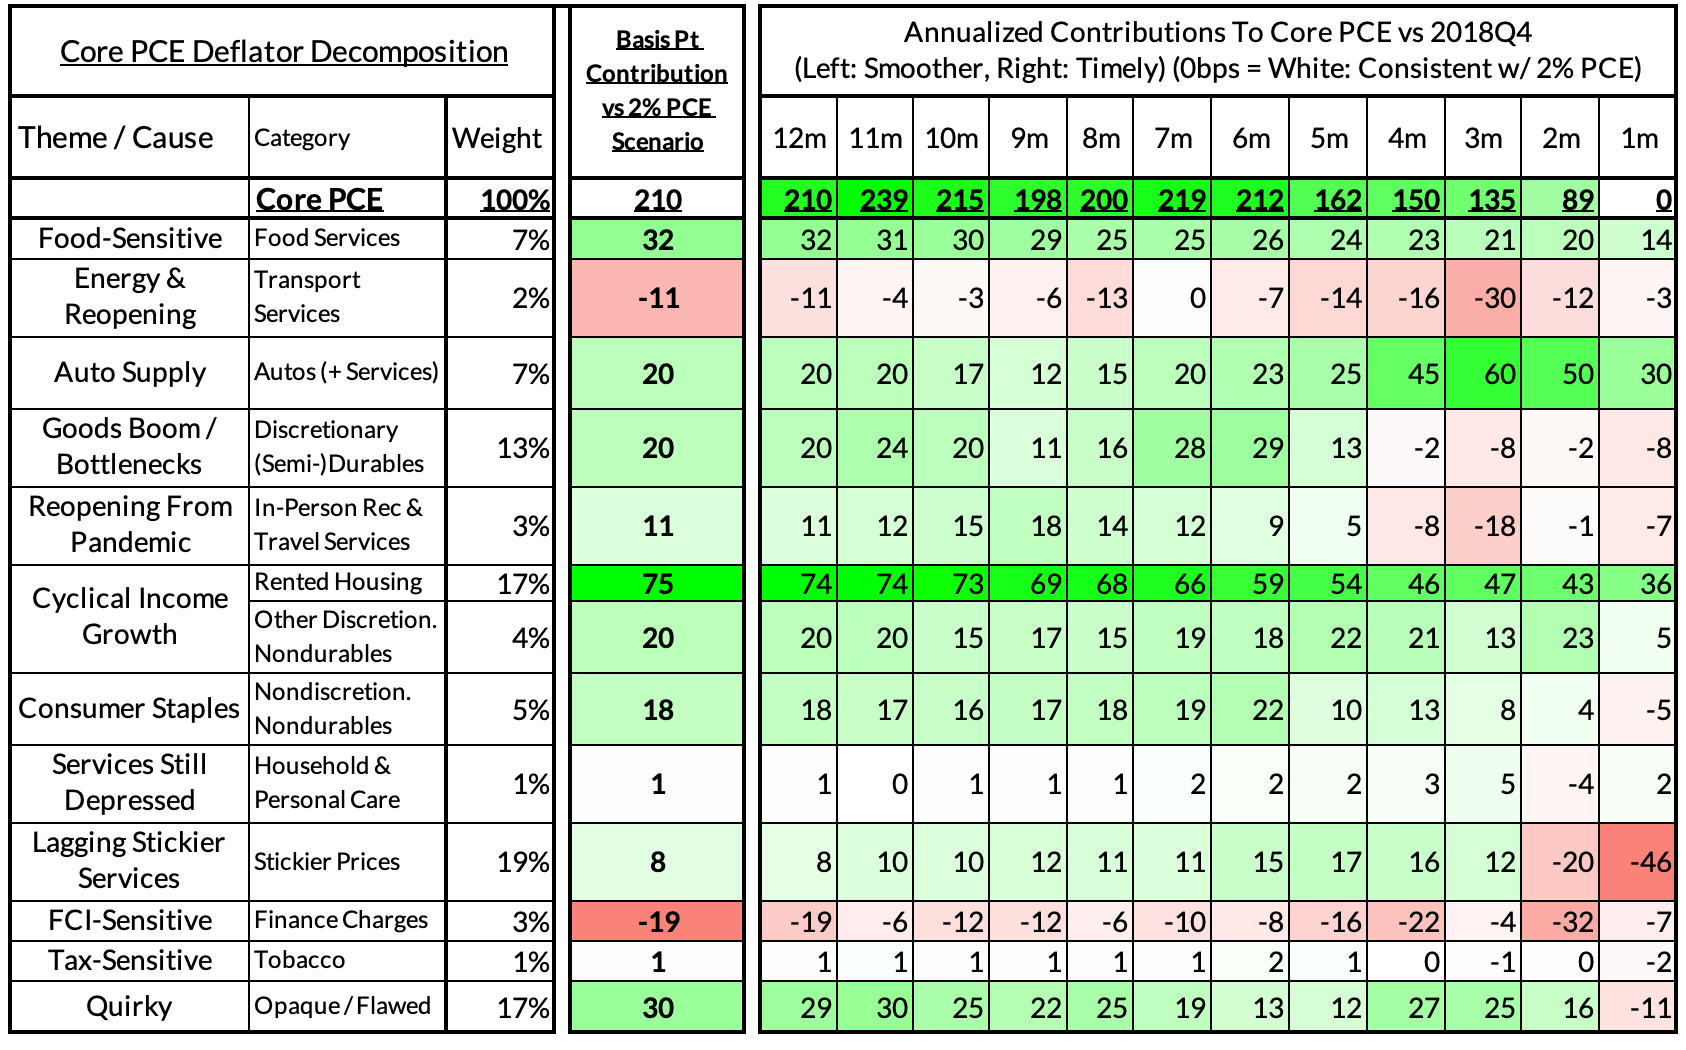
The final heatmap gives you a sense of the overshoot on shorter annualized run-rates. Monthly annualized June core PCE likely was right on the screws with the 2% inflation target.
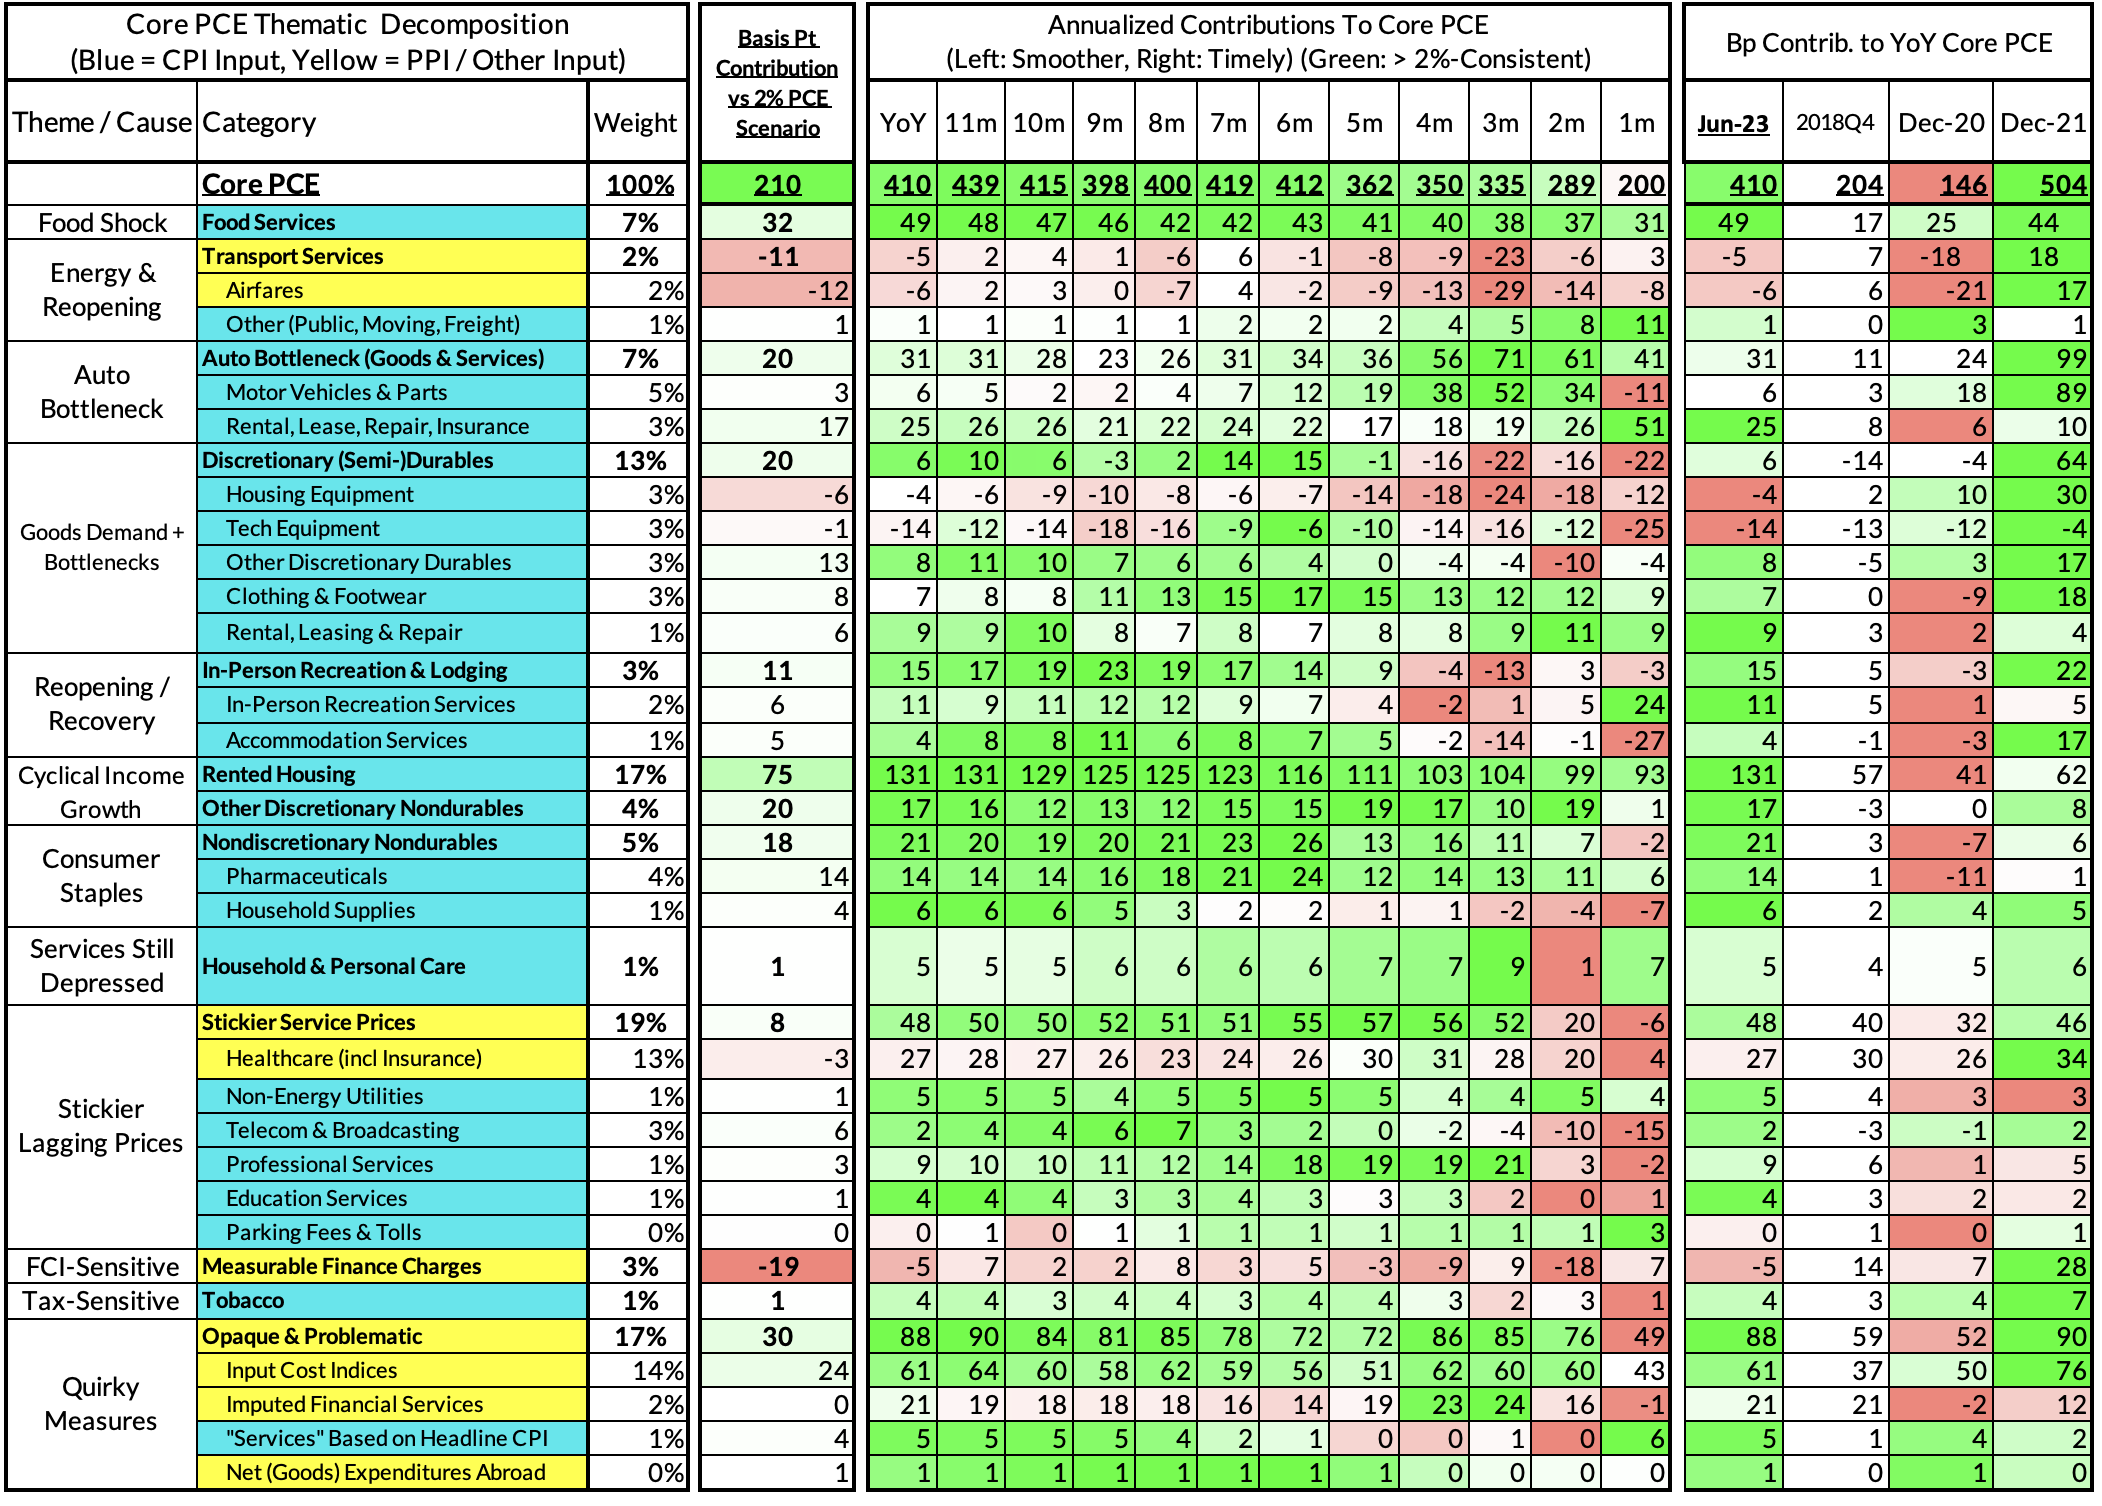
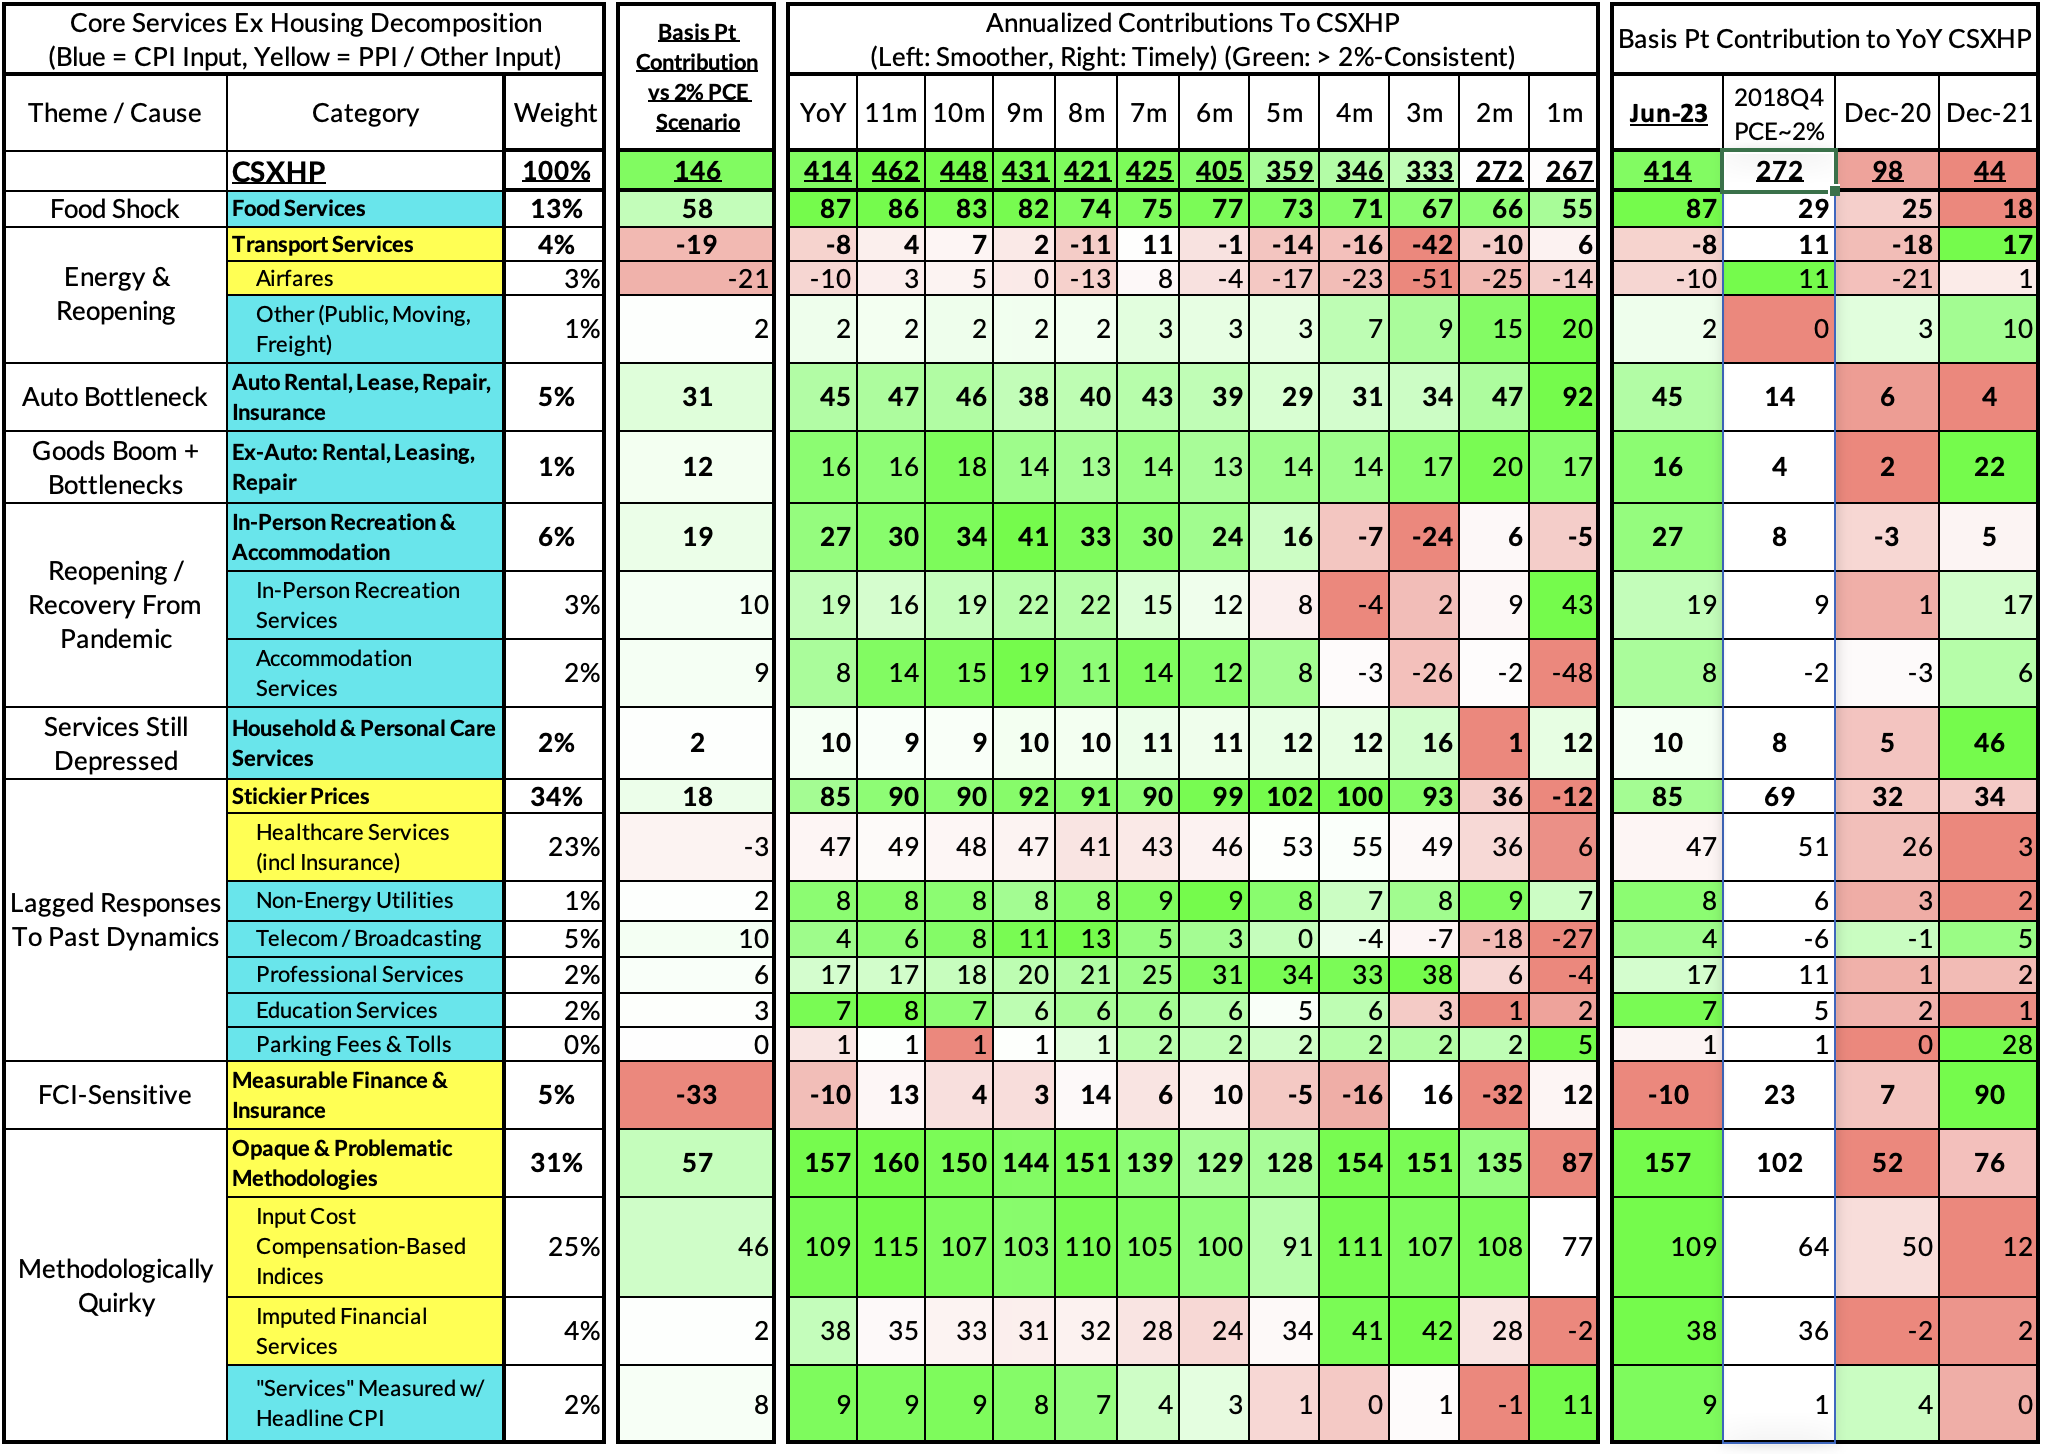
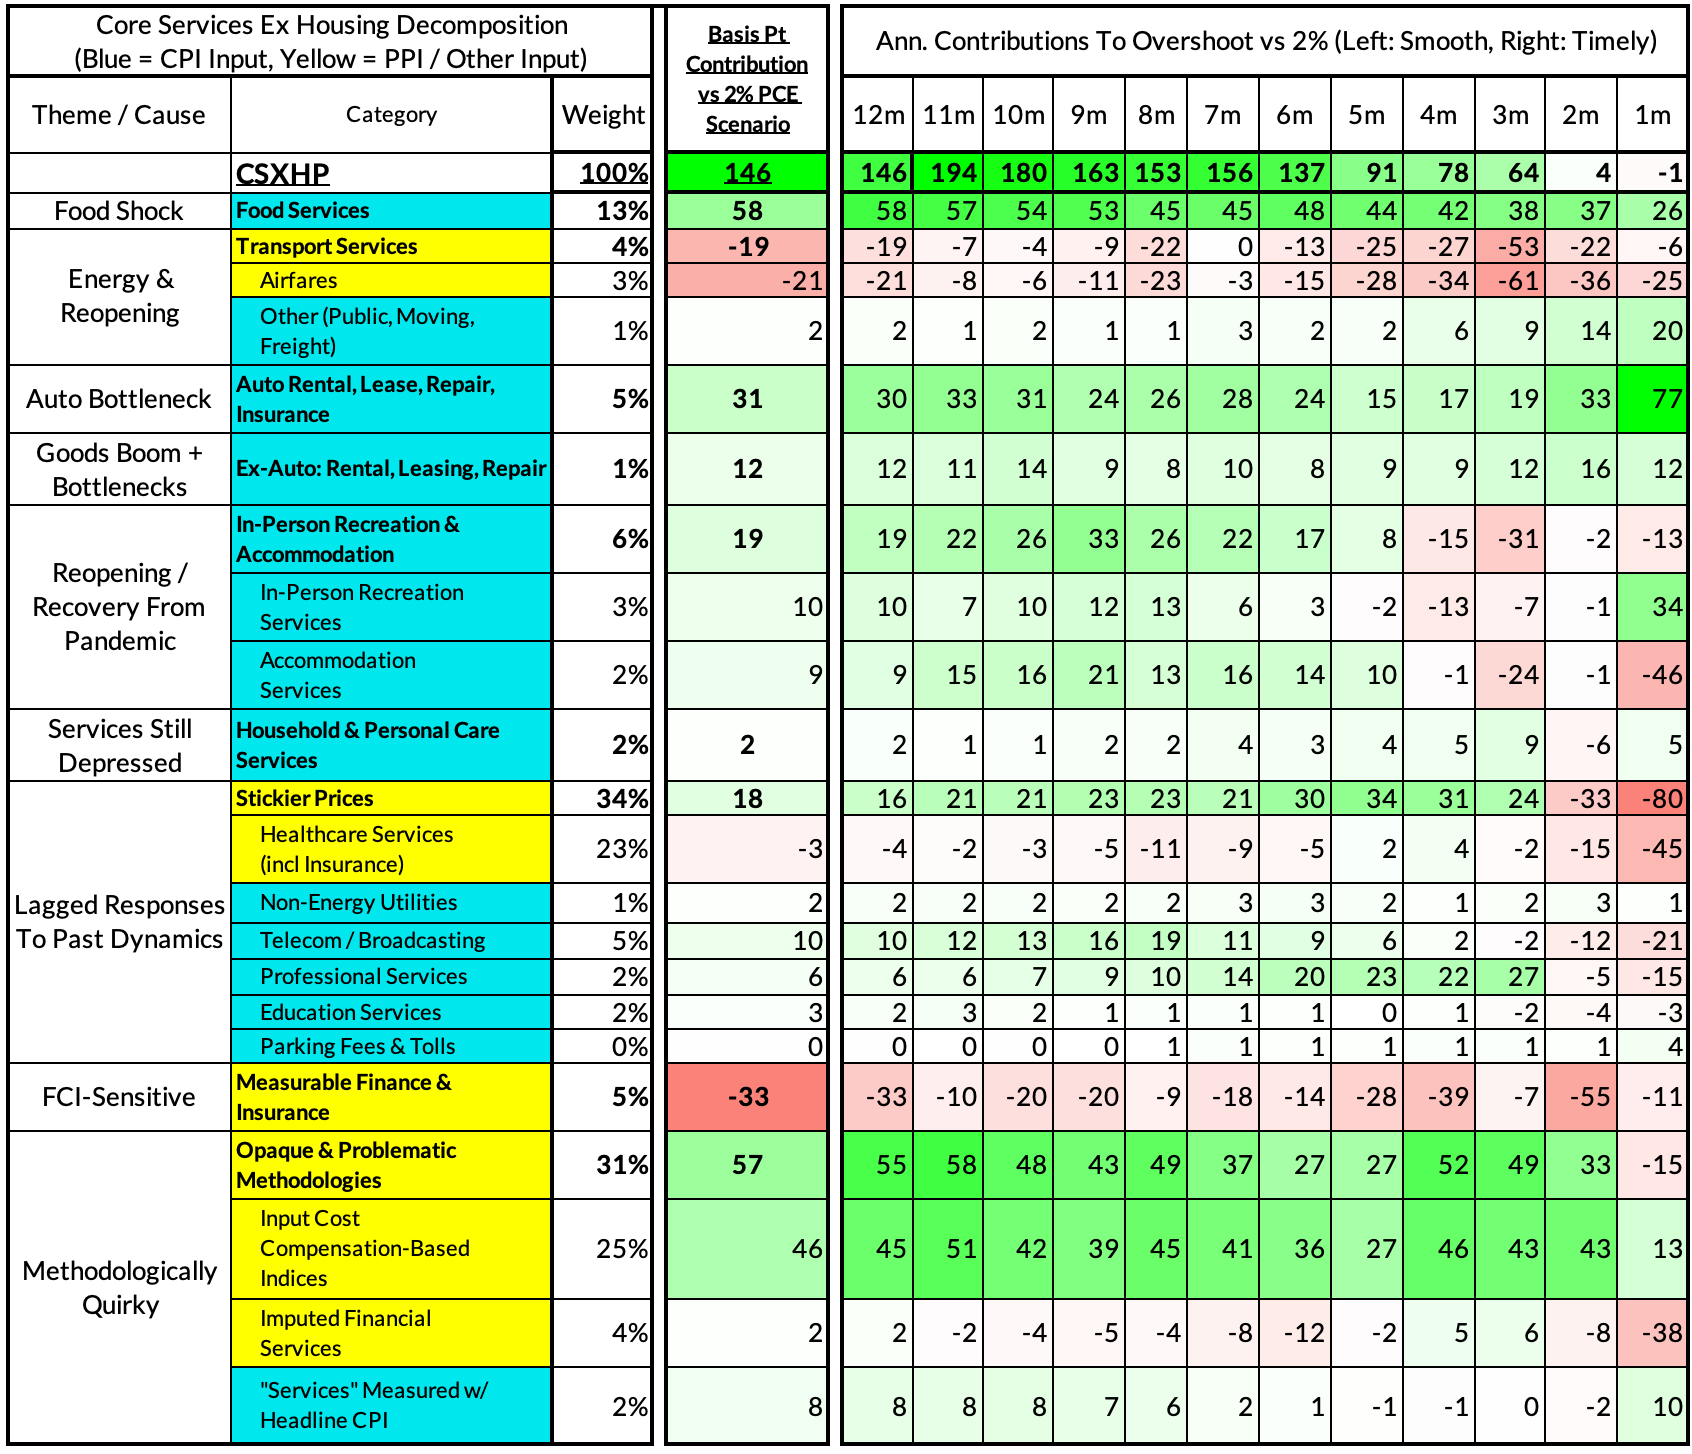
For the Detail-Oriented: Core Services Ex Housing PCE Heatmaps
The June growth rate in "Core Services Ex Housing PCE" was 4.14% year-over-year, a 146 basis point overshoot versus the 2.68% run rate that coincided with ~2% headline and core PCE.
Supply: Food and auto goods supply challenges have driven an overshoot in their services counterparts, 58 and 31 basis points contribution to CSXHP respectively.
Demand: "Revenge demand" for in-person leisure and hospitality services adds another 19 basis points to the CSXHP overshoot.
Sticky: Stickier prices are starting to show signs of decelerating locally but still add 18 basis points to the year-over-year overshoot. These include healthcare, telecommunication, and professional services.
Wage-Input: Input cost indices are adding 46 basis points to the CSXHP overshoot due to elevated nominal wage growth and PPI-specific inflation.
Deposit rates: Imputed financial services only add 2bps to the CSXHP overshoot but have potential scope to substantially undershoot in the next 4-6 quarters
We are seeing increasing evidence of a potentially serious deceleration in the services ex housing PCE components of CPI. June monthly CSXHP ran at a 2.67% annualized rate, a basis point below what would be consistent with 2% headline and core PCE.
The link has been copied!
Your link has expired. Please request a new one.
Your link has expired. Please request a new one.
Your link has expired. Please request a new one.
Great! You've successfully signed up.
Great! You've successfully signed up.
Welcome back! You've successfully signed in.
Success! You now have access to additional content.