The Fed is worried that inflation will continue until wage growth comes down or unemployment ticks up. As evidence for this proposition, the Fed has been pointing to the continued strength in “Core PCE Services ex-Housing” as the most important metric for the monetary policy outlook. The presumption here is simple: since labor makes up the largest share of the cost structure for services, rising labor costs must be the main driver of prices in these components (regardless of whether this analysis ultimately confuses average and marginal cost). In the words of Chair Powell, “Core PCE Services ex-Housing”:
"may be the most important category for understanding the future evolution of core inflation. Because wages make up the largest cost in delivering these services, the labor market holds the key to understanding inflation in this category." Jerome Powell, November 30, 2022
But the Fed is wrong to be so confident that this measure can uniquely identify persistent wage-driven inflation today.

By using “Core PCE Services ex-Housing”, the Fed is acknowledging that pandemic disruptions have led to inflation in a wide range of sectors, and that inflation in core goods and housing is analytically distinct from wage-driven cost-push inflation. But does this metric actually capture cyclical inflation driven by the labor market? And how much of the inflation that it does capture is actually evidence of wage-driven cost-push inflation? To find out, we have to dig into the NIPA handbook and lay out all of the components included in this aggregate, as well as some of the methodological factors behind their measurement.
As we have emphasized throughout the pandemic, some apparently “clear” pictures in economic data are often quite murky up close. The argument for focusing on services rather than goods is simple, but specious: service prices are taken to be a rough proxy for wage pressures. However, an a priori rule of thumb is no substitute for evidentiary identification. To see how well this index captures cyclical inflation due to rising wages, we have to dig into the underlying methodologies.
Going through these one-by-one will take a long time, so for ease of exposition, let’s look at three key groups of potentially-flawed metrics in the “Core Services ex Housing” aggregate.
- The first are those that are susceptible to idiosyncratic price pressures via the pandemic or commodities markets.
- The second are services that are plausibly affected by spillovers from bottlenecks in goods markets (a dynamic which the Fed is looking to screen out by excluding goods from its metric).
- The third–and most flagrant–are services where prices are measured using opaque or otherwise problematic methodologies for the Fed’s causal claims.
There are still prices that lie outside the three, and in some of these prices to reflect a cyclical upswing in pricing power. But here too, it is far from obvious that labor costs are the driver of pricing power, and not merely driven by a surge in nominal consumer spending growth (that is now decelerating).
Whether or not the behavior of the Fed’s aggregate captures wage-driven price pressures comes down to how well these components capture those dynamics. As we will see, there are ample side-channels through which the very dynamics the Fed is looking to screen out can show up in this aggregate. Even worse, roughly a quarter of this newly preferred price aggregate is directly based on opaque indices of compensation and not market-determined consumer prices, creating a mechanical relationship between compensation data and the Fed’s gauge of inflation. A wage target is not a priori wrong – our flagship Floor Gross Labor Income proposal sits comfortably within the idea of wage targets – but presenting a wage target as though it were a price target is analytically unacceptable.
Commodity- and Pandemic-Driven Effects
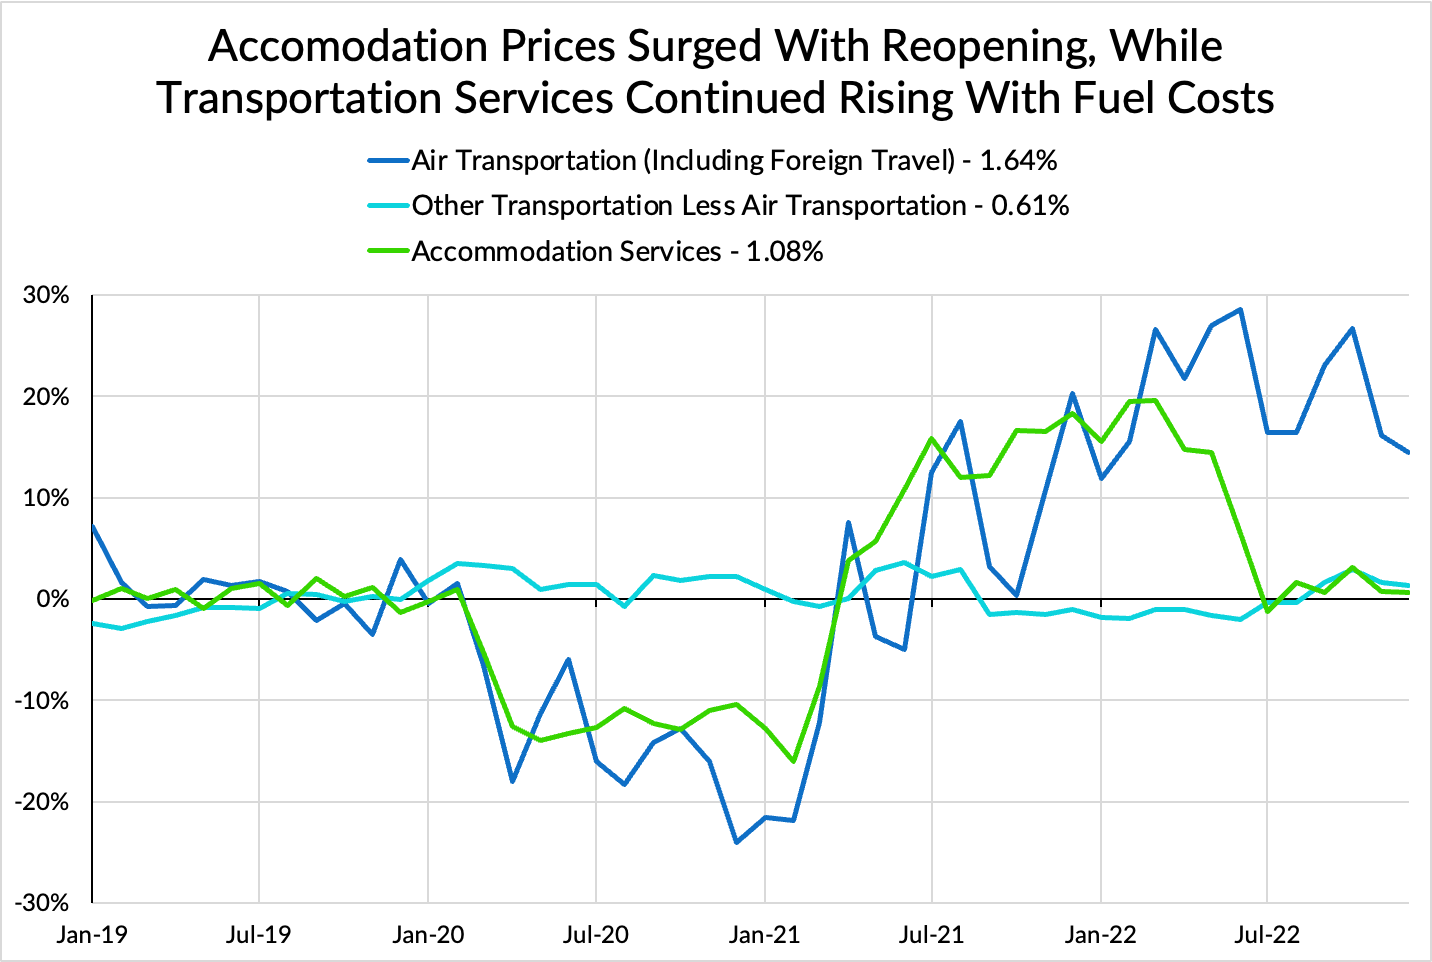
In the first section, we see several categories where the prices charged for these services are liable to be tightly coupled to disruptions caused by the pandemic, or spiking commodity prices that the Fed intends to exclude, or both. Air Transportation potentially suggests evidence of direct passthrough from rising jet fuel costs over the summer, bringing high petroleum product prices into the metric. Other public transportation services might be more modestly affected by this dynamic. At the same time, demand for air travel and accommodation services was extremely suppressed during the pandemic, such that it is fair to expect a rapid cyclical recovery gives operators temporarily substantial demand-side pricing power.
Food Services is liable to see the same distortions from disruptions to food commodities that the metric is designed to exclude as well. The pressures in Food Services and Food At Home look remarkably similar below, with alcohol pricing also responding, just with a longer lag:


Accommodation, Other Transportation, and Air Transportation also show clear signs of pandemic-related disruption: prices fell dramatically during the pandemic, and then rose substantially afterwards, as pent-up demand for those particular services was unleashed.
Service Price Implications of Goods Bottlenecks
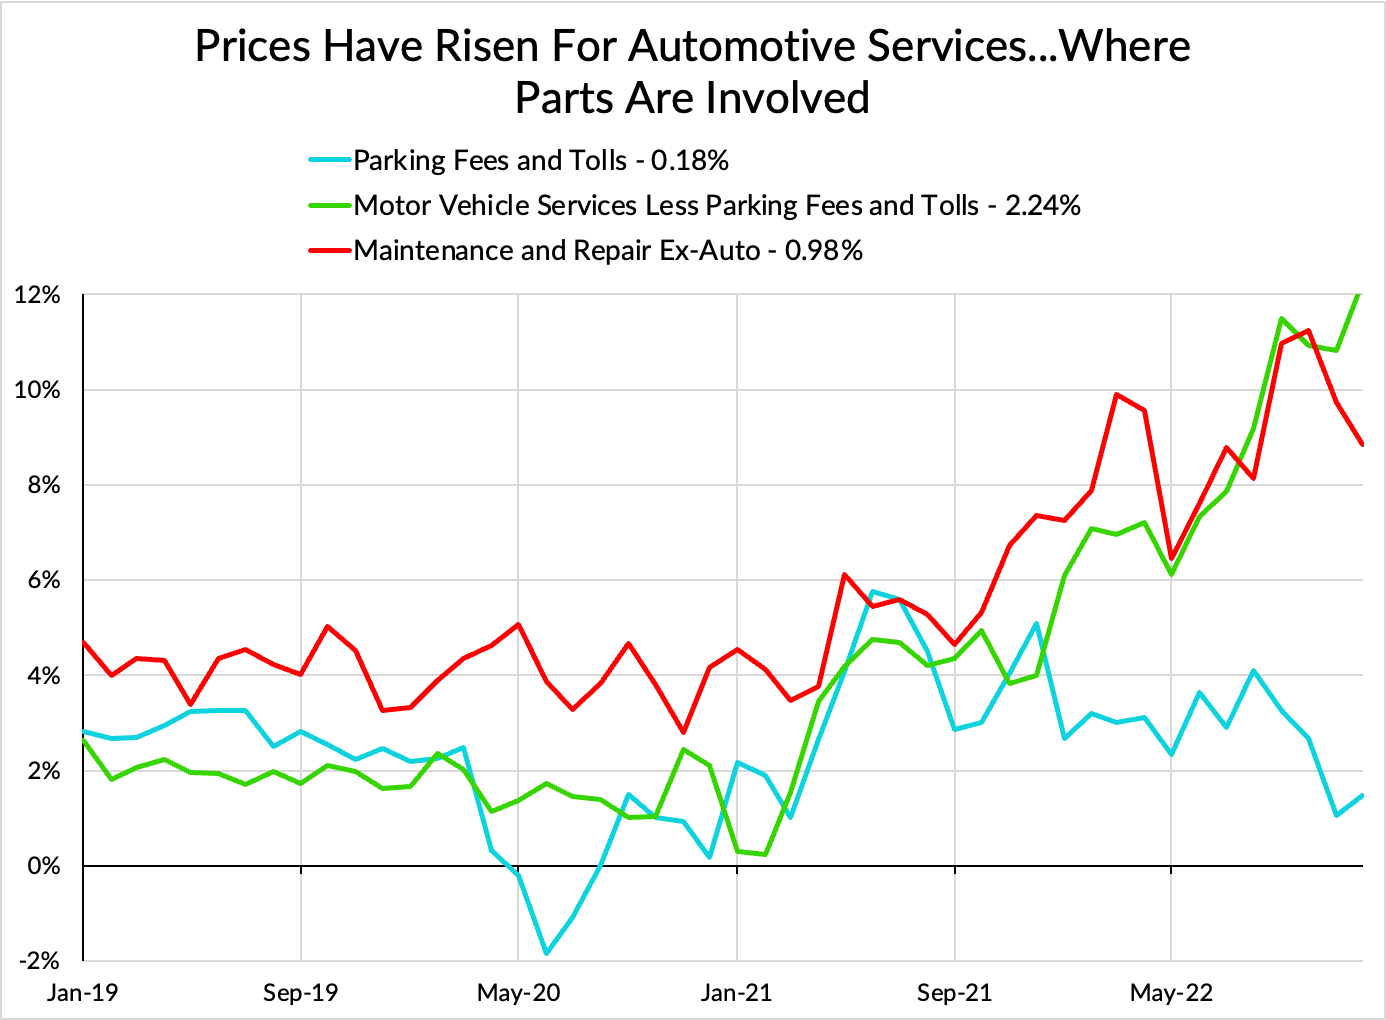
In this second category, we see a handful of sectors where shortages of intermediate inputs are liable to play a substantial role. As anyone who has had their car repaired can attest, the price includes parts and labor. It is not a stretch to think that the same factors that led to dramatic shortages of new and used autos would also lead to issues for garages and maintenance shops looking to acquire parts. Higher automobile values and the higher cost of automobile repair, alongside the rebound in driving volume from the pandemic also plausibly explains the increase in motor vehicle insurance prices. Here again, wage pressures on prices are likely to be more limited relative to the pandemic disruption.
Direct Reliance on Compensation Data and Opaque Methodologies

Still other sections have particularly obscure or opaque methodologies for calculation. There are two different categories here. The first are components for which the BEA measures prices using a “BEA composite index of input costs.” These cover a handful of disparate industries (pension funds, life insurance, labor unions, professional associations, and some social services) where the prices are more or less directly derived from wage indices. These prices account for roughly 25% of Core PCE services ex Housing.
This means that a large portion of the metric the Fed is using to guide future rate hikes is by definition a measure of wages in a handful of white collar industries. If the Fed wants to adopt a labor income growth target, we are favorably inclined, as long as it is adopted with a view to protecting Americans from crushing joblessness. However, if the Fed wants to begin any kind of wage or gross labor income growth targeting, it needs to actually 1) make the case in general and 2) make the case for the specific index it intends to use. Here, the Fed is doing neither, despite anchoring to an inflation metric where 25% of the total weight is given to wage costs in an oddball group of industries.
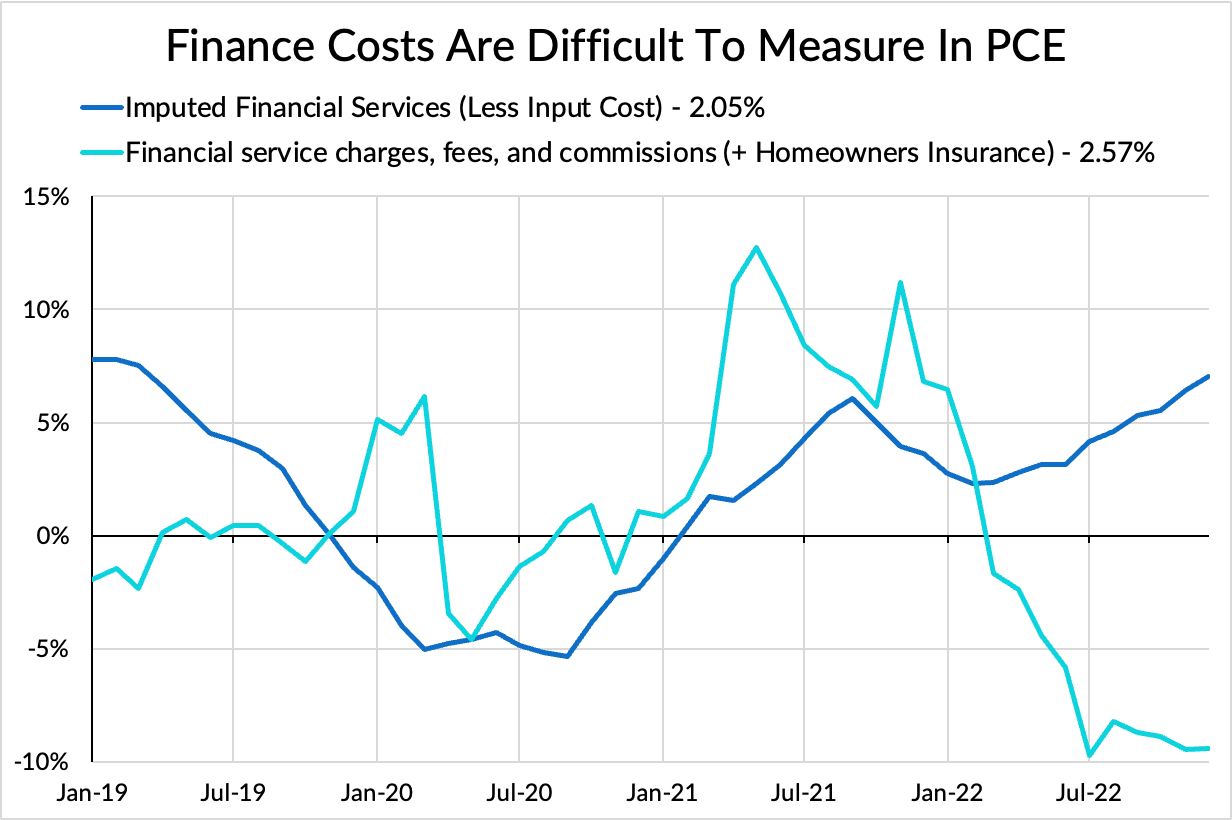
The second highly opaque category is imputed financial services, which is even less concretely measured. Without going into the gory details [thanks Matt Klein], this component is essentially an attempt to impute the cost of financial services from measures of interest rates and other proxies of bank profitability.
In other subcomponents, like gambling services and parts of health insurance, the measured price is just headline CPI. Seriously, small chunks of the aggregate that the Fed is arguing uniquely captures wage-cost pressures just track headline CPI.
Are the less problematic service price increases a function of labor costs?
This is not to say that all strength in “PCE Core Services ex-Housing” can be neatly attributed to the pandemic, commodities markets, goods bottlenecks or input cost indices. The prices for Netflix and Disney+ subscriptions – both conceptually included in this metric – have risen over the pandemic. Yet it is even harder to make the case that the main driver there was rising labor costs. Instead, it is often much easier to explain these kinds of price hikes as a response to rapid consumer spending growth and perhaps shareholder pressure to shift from growth to margin-sensitivity as stock prices decline. Where this cyclical service pricing dynamic obtains, it is hard to see inflation in these categories as evidence that labor costs are the core driver today.

Even stranger, if the Fed wanted to make sure that the metric it used was maximally sensitive to cyclical strength in the labor market, they ought to have left housing in! Even though it makes sense conceptually to exclude housing for certain mechanical reasons related to how long instantaneous rent hikes take to be incorporated, rents tend to correlate most reliably (with a lag) with labor market and business cycle strength.

The question at the end of the day is: is this dispositive evidence of cost-push inflation that the Fed must react to? With closer scrutiny, it is hard to give a definitive “yes” in response. The same reasons that the Fed is using to justify de-emphasizing the disinflation in core goods are also present, to varying extents, in many of the components of core services.